. 2016 Apr 1;11(4):e0152729.
doi: 10.1371/journal.pone.0152729. eCollection 2016.

The qEEG Signature of Selective NMDA NR2B Negative Allosteric Modulators; A Potential Translational Biomarker for Drug Development

Affiliations

The qEEG Signature of Selective NMDA NR2B Negative Allosteric Modulators; A Potential Translational Biomarker for Drug Development

Deborah Keavy et al. PLoS One. .

Abstract

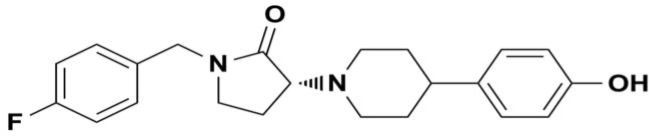
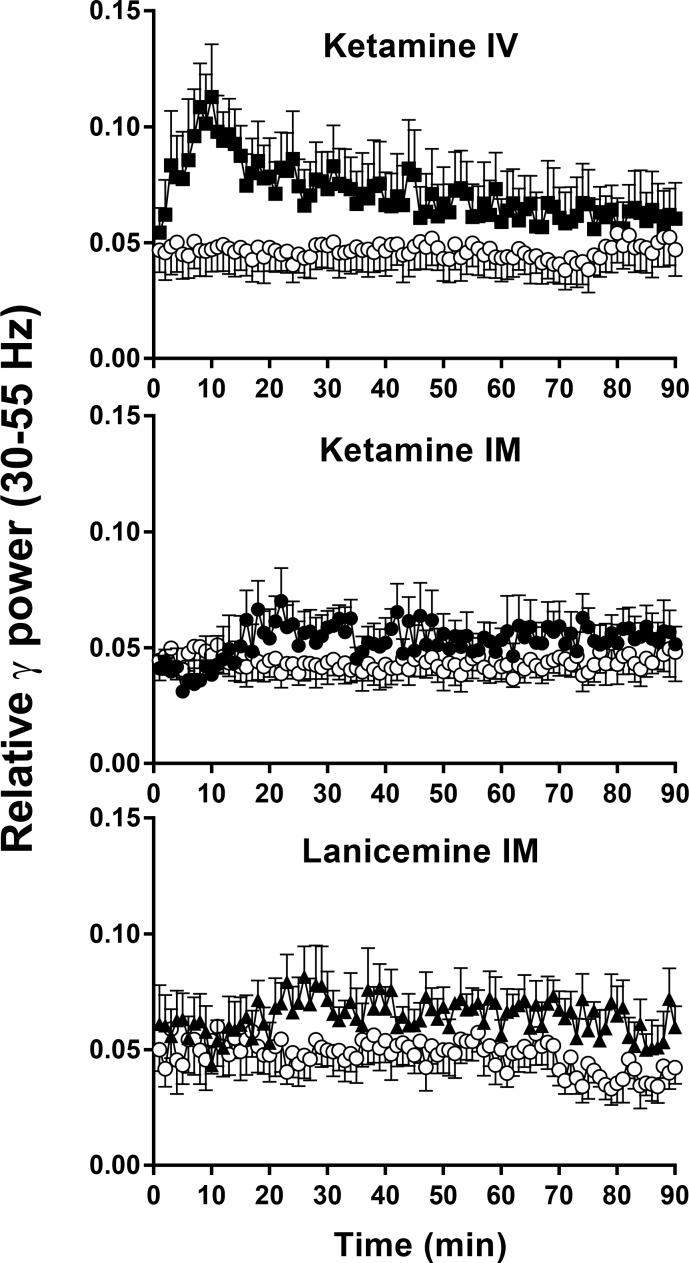
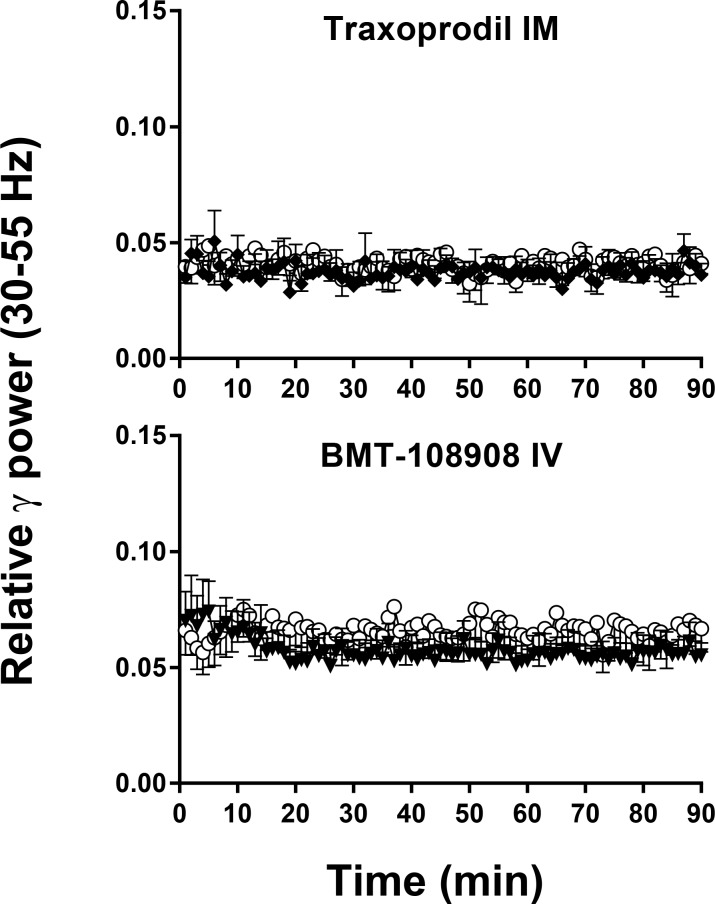
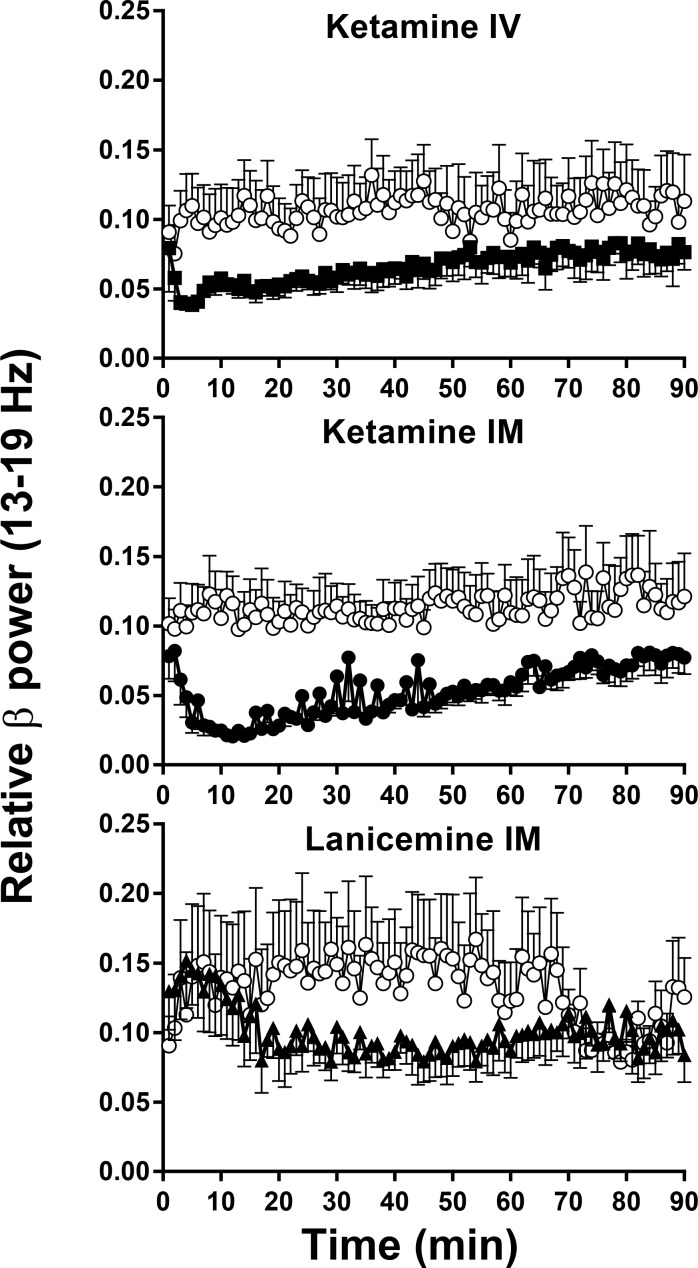
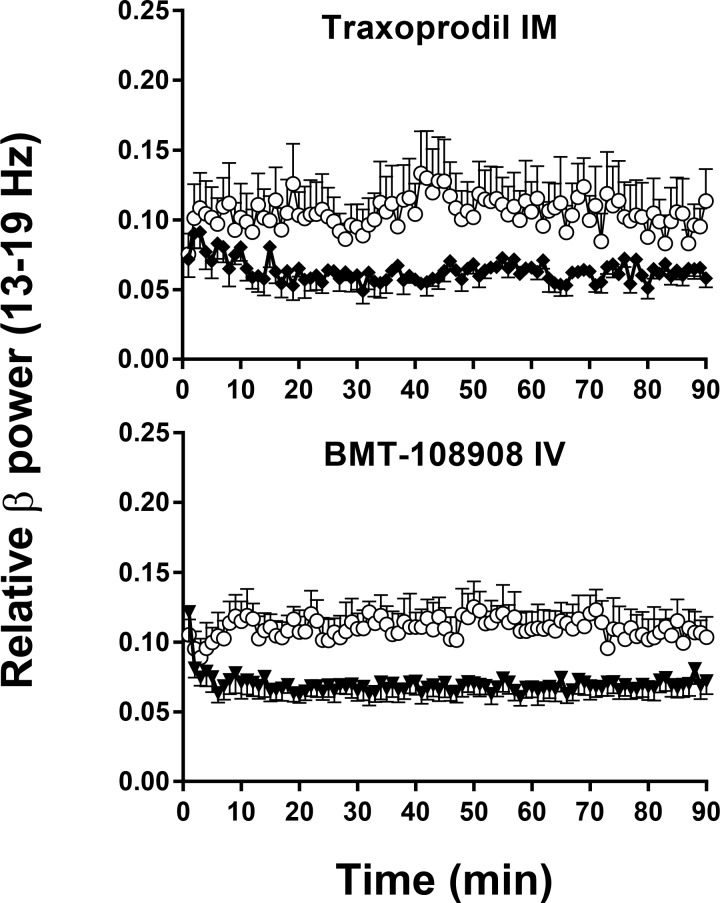
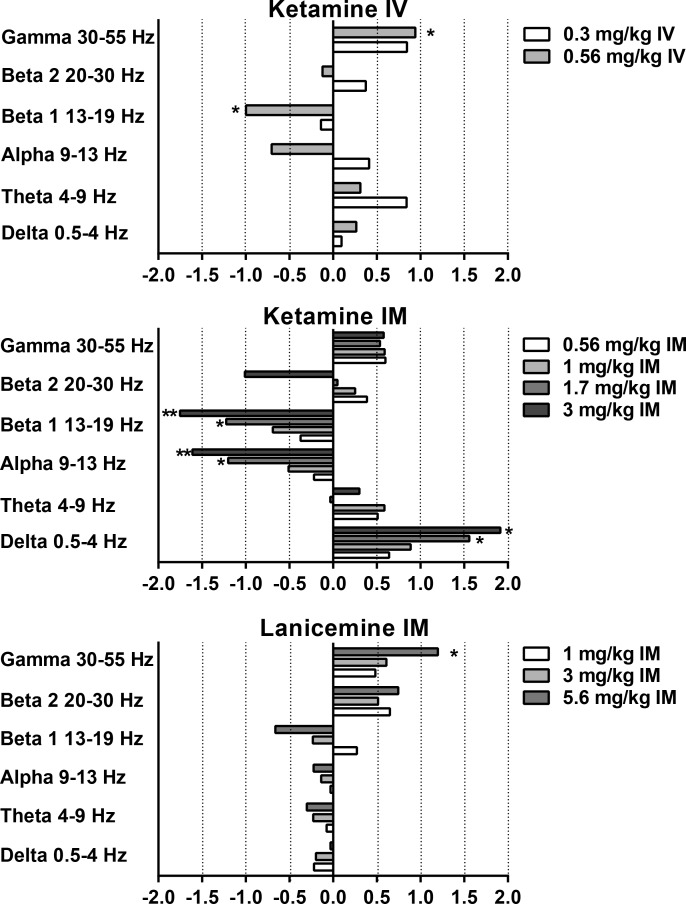
The antidepressant activity of the N-methyl-D-aspartate (NMDA) receptor channel blocker, ketamine, has led to the investigation of negative allosteric modulators (NAMs) selective for the NR2B receptor subtype. The clinical development of NR2B NAMs would benefit from a translational pharmacodynamic biomarker that demonstrates brain penetration and functional inhibition of NR2B receptors in preclinical species and humans. Quantitative electroencephalography (qEEG) is a translational measure that can be used to demonstrate pharmacodynamic effects across species. NMDA receptor channel blockers, such as ketamine and phencyclidine, increase the EEG gamma power band, which has been used as a pharmacodynamic biomarker in the development of NMDA receptor antagonists. However, detailed qEEG studies with ketamine or NR2B NAMs are lacking in nonhuman primates. The aim of the present study was to determine the effects on the qEEG power spectra of the NR2B NAMs traxoprodil (CP-101,606) and BMT-108908 in nonhuman primates, and to compare them to the NMDA receptor channel blockers, ketamine and lanicemine. Cynomolgus monkeys were surgically implanted with EEG radio-telemetry transmitters, and qEEG was measured after vehicle or drug administration. The relative power for a number of frequency bands was determined. Ketamine and lanicemine increased relative gamma power, whereas the NR2B NAMs traxoprodil and BMT-108908 had no effect. Robust decreases in beta power were elicited by ketamine, traxoprodil and BMT-108908; and these agents also produced decreases in alpha power and increases in delta power at the doses tested. These results suggest that measurement of power spectra in the beta and delta bands may represent a translational pharmacodynamic biomarker to demonstrate functional effects of NR2B NAMs. The results of these studies may help guide the selection of qEEG measures that can be incorporated into early clinical evaluation of NR2B NAMs in healthy humans.


Conflict of interest statement

Competing Interests: All authors were employees of Bristol-Myers Squibb during these studies. The authors have declared that no competing interests exist. This does not alter the authors' adherence to PLOS ONE policies on sharing data and materials.

Figures

Fig 1
Fig 1. Structure of BMT-108908.
Fig 2
Fig 2. Non-selective NMDA channel blockers elicit robust changes in gamma (30–55 Hz) qEEG in cynomolgus monkeys.
Y-axis is relative power in gamma (30–55 Hz) frequency band of the EEG power spectrum. X-axis is time after IM or IV administration. Results are the mean ± SEM (N = 5–6). Gamma band after 0.56 mg/kg IV ketamine (solid symbol) differs from vehicle (open symbol) at p < .01 level (Table 1). IM Ketamine (solid symbol) caused an increase in gamma relative power after 3 mg/kg, but was not significantly different from vehicle (open symbol), p>.05 (Table 1). Lanicemine 5.6 mg/kg IM (solid symbol), increases gamma band relative power and differs from vehicle (open symbol) at p < .05 level (Table 1).
Fig 3
Fig 3. NR2b selective NAM’s have no effect on gamma (30–55 Hz) qEEG in cynomolgus monkeys.
Y-axis is relative power in gamma (30–55 Hz) frequency band of the EEG power spectrum. X-axis is time after IM or IV administration. Results are the mean ± SEM (N = 5–6). Traxoprodil, 10 mg/kg IM and BMT-108908 3 mg/kg IV (closed symbol) had no effect on gamma, p>.05 (Table 1).
Fig 4
Fig 4. Non-selective NMDA channel blockers elicit robust changes in beta 1 (13–19 Hz) qEEG in cynomolgus monkeys.
Y-axis is relative power in beta 1 (13–19 Hz) frequency band of the EEG power spectrum. X-axis is time after IM or IV administration. N = 5–6. Error Bars are SEM. Beta 1 band after 0.56 mg/kg IV, ketamine (closed symbol) differs from vehicle (open symbol) at p < .05 level. (Table 1). Ketamine caused a decrease in beta 1 relative power after 3 mg/kg IM (closed symbol), and differs from vehicle (open symbol) at p < .001 level (Table 1). Lanicemine 5.6 mg/kg IM (closed symbol), decreased beta 1 relative power but was not significantly different from vehicle (open symbol), p>.05 (Table 1).
Fig 5
Fig 5. NR2b selective NAM’s elicit robust changes in beta 1 (13–19 Hz) qEEG in cynomolgus monkeys.
Traxoprodil, 10 mg/kg IM (closed symbol) caused a reduction in beta 1 relative power and differs from vehicle (open symbol) at p < .05 level (Table 1). BMT-108908 3 mg/kg IV (closed symbol) decreased beta 1 band and differs from vehicle (open symbol) at p < .001 (Table 1).
Fig 6
Fig 6. Non-selective NMDA channel blockers elicit robust changes in qEEG power spectra in cynomolgus monkeys.
Y-axis is relative power in designated frequency bands of the qEEG power spectrum. X-axis is Cohen’s d’ calculated from the area under the relative power curve for each band. N = 5–6. Significant changes from qEEG AUC following vehicle are designated by *, **, or *** indicating significant differences at the p < .05, p < .01, and p < .001 levels, respectively.
Fig 7
Fig 7. NR2b selective NAM’s elicit robust changes in qEEG power spectra in cynomolgus monkeys.
Y-axis is relative power in designated frequency bands of the qEEG power spectrum. X-axis is Cohen’s d’ calculated from the area under the relative power curve for each band. N = 5–6. Significant changes from qEEG AUC following vehicle are designated by *, **, or *** indicating significant differences at the p < .05, p < .01, and p < .001 levels, respectively.

References

    1. Association WAP. American Psychiatric Association: Diagnostic and Statistical Manual of Mental Disorders. 2000;Text Revision. 4th ed.
    1. Trivedi MH, Rush AJ, Wisniewski SR, Nierenberg AA, Warden D, Ritz L, et al. Evaluation of outcomes with citalopram for depression using measurement-based care in STAR*D: implications for clinical practice. Am J Psychiatry. 2006;163(1):28–40. - PubMed
    1. Hashimoto K. Emerging role of glutamate in the pathophysiology of major depressive disorder. Brain Res Rev. 2009;61(2):105–23. 10.1016/j.brainresrev.2009.05.005 - DOI - PubMed
    1. Skolnick P, Popik P, Trullas R. Glutamate-based antidepressants: 20 years on. Trends Pharmacol Sci. 2009;30(11):563–9. 10.1016/j.tips.2009.09.002 - DOI - PubMed
    1. Berman RM, Cappiello A, Anand A, Oren DA, Heninger GR, Charney DS, et al. Antidepressant effects of ketamine in depressed patients. Biol Psychiatry. 2000;47(4):351–4. - PubMed

Publication types

MeSH terms

LinkOut - more resources