

Adipocytes as a Link Between Gut Microbiota-Derived Flagellin and Hepatocyte Fat Accumulation
- PMID: 27035341
- PMCID: PMC4817958
- DOI: 10.1371/journal.pone.0152786
Adipocytes as a Link Between Gut Microbiota-Derived Flagellin and Hepatocyte Fat Accumulation
Erratum in
-
Correction: Adipocytes as a Link Between Gut Microbiota-Derived Flagellin and Hepatocyte Fat Accumulation.PLoS One. 2016 Jun 3;11(6):e0157254. doi: 10.1371/journal.pone.0157254. eCollection 2016. PLoS One. 2016. PMID: 27258376 Free PMC article.
Abstract
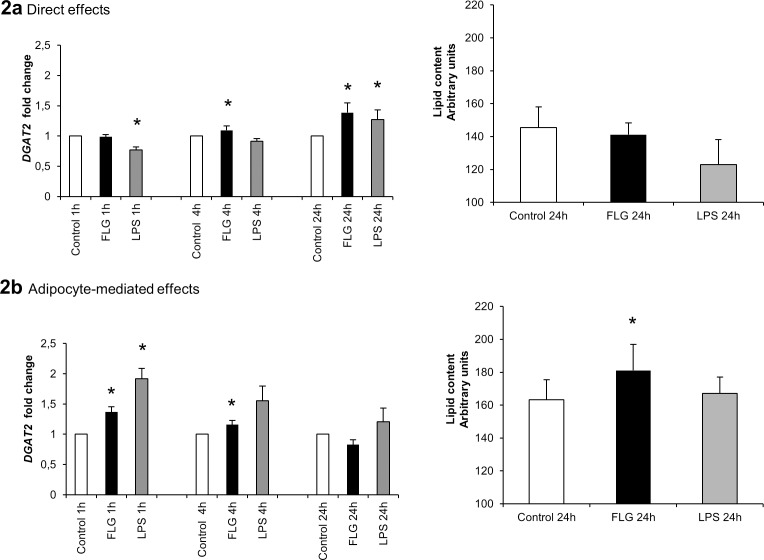
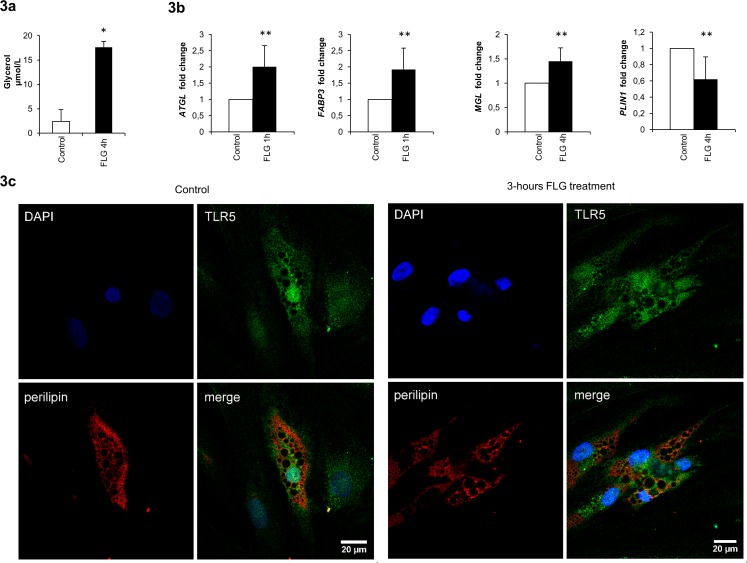
While the role of both elevated levels of circulating bacterial cell wall components and adipose tissue in hepatic fat accumulation has been recognized, it has not been considered that the bacterial components-recognizing adipose tissue receptors contribute to the hepatic fat content. In this study we found that the expression of adipose tissue bacterial flagellin (FLG)-recognizing Toll-like receptor (TLR) 5 associated with liver fat content (r = 0.699, p = 0.003) and insulin sensitivity (r = -0.529, p = 0.016) in humans (n = 23). No such associations were found for lipopolysaccharides (LPS)-recognizing TLR4. To study the underlying molecular mechanisms of these associations, human HepG2 hepatoma cells were exposed in vitro to the conditioned culture media derived from FLG or LPS-challenged human adipocytes. The adipocyte-mediated effects were also compared to the effects of direct HepG2 exposure to FLG and LPS. We found that the media derived from FLG-treated adipocytes stimulated fat accumulation in HepG2 cells, whereas either media derived from LPS-treated adipocytes or direct FLG or LPS exposure did not. This is likely due to that FLG-treatment of adipocytes increased lipolysis and secretion of glycerol, which is known to serve a substrate for triglyceride synthesis in hepatocytes. Similarly, only FLG-media significantly decreased insulin signaling-related Akt phosphorylation, IRS1 expression and mitochondrial respiratory chain ATP5A. In conclusion, our results suggest that the FLG-induced TLR5 activation in adipocytes increases glycerol secretion from adipocytes and decreases insulin signaling and mitochondrial functions, and increases fat accumulation in hepatocytes. These mechanisms could, at least partly, explain the adipose tissue TLR5 expression associated with liver fat content in humans.
Conflict of interest statement
Figures


Similar articles
-
Interleukin-1beta may mediate insulin resistance in liver-derived cells in response to adipocyte inflammation.Endocrinology. 2010 Sep;151(9):4247-56. doi: 10.1210/en.2010-0340. Epub 2010 Jul 21. Endocrinology. 2010. PMID: 20660063
-
Toll-like receptor 5 in obesity: the role of gut microbiota and adipose tissue inflammation.Obesity (Silver Spring). 2015 Mar;23(3):581-90. doi: 10.1002/oby.20993. Epub 2015 Jan 22. Obesity (Silver Spring). 2015. PMID: 25611816
-
Insulin resistance and increased lipolysis in bone marrow derived adipocytes stimulated with agonists of Toll-like receptors.Horm Metab Res. 2010 Sep;42(10):703-9. doi: 10.1055/s-0030-1261872. Epub 2010 Jul 5. Horm Metab Res. 2010. PMID: 20603780
-
Hepatocyte Toll-Like Receptor 5 Promotes Bacterial Clearance and Protects Mice Against High-Fat Diet-Induced Liver Disease.Cell Mol Gastroenterol Hepatol. 2016 May 5;2(5):584-604. doi: 10.1016/j.jcmgh.2016.04.007. eCollection 2016 Sep. Cell Mol Gastroenterol Hepatol. 2016. PMID: 28090564 Free PMC article.
-
Insulin- and leptin-mediated control of aquaglyceroporins in human adipocytes and hepatocytes is mediated via the PI3K/Akt/mTOR signaling cascade.J Clin Endocrinol Metab. 2011 Apr;96(4):E586-97. doi: 10.1210/jc.2010-1408. Epub 2011 Feb 2. J Clin Endocrinol Metab. 2011. PMID: 21289260
Cited by
-
Activation of Toll-like receptor 5 in microglia modulates their function and triggers neuronal injury.Acta Neuropathol Commun. 2020 Sep 10;8(1):159. doi: 10.1186/s40478-020-01031-3. Acta Neuropathol Commun. 2020. PMID: 32912327 Free PMC article.
-
Correction: Adipocytes as a Link Between Gut Microbiota-Derived Flagellin and Hepatocyte Fat Accumulation.PLoS One. 2016 Jun 3;11(6):e0157254. doi: 10.1371/journal.pone.0157254. eCollection 2016. PLoS One. 2016. PMID: 27258376 Free PMC article.
-
Molecular and Cellular Mediators of the Gut-Liver Axis in the Progression of Liver Diseases.Front Med (Lausanne). 2021 Sep 28;8:725390. doi: 10.3389/fmed.2021.725390. eCollection 2021. Front Med (Lausanne). 2021. PMID: 34650994 Free PMC article. Review.
-
Silica nanoparticles trigger hepatic lipid-metabolism disorder in vivo and in vitro.Int J Nanomedicine. 2018 Nov 9;13:7303-7318. doi: 10.2147/IJN.S185348. eCollection 2018. Int J Nanomedicine. 2018. PMID: 30519016 Free PMC article.
-
Understanding the dynamics of Toll-like Receptor 5 response to flagellin and its regulation by estradiol.Sci Rep. 2017 Jan 23;7:40981. doi: 10.1038/srep40981. Sci Rep. 2017. PMID: 28112187 Free PMC article.
References
Publication types
MeSH terms
Substances
LinkOut - more resources
Full Text Sources
Other Literature Sources
Miscellaneous
