

SAMA: A Method for 3D Morphological Analysis
- PMID: 27035711
- PMCID: PMC4818086
- DOI: 10.1371/journal.pone.0153022
SAMA: A Method for 3D Morphological Analysis
Abstract
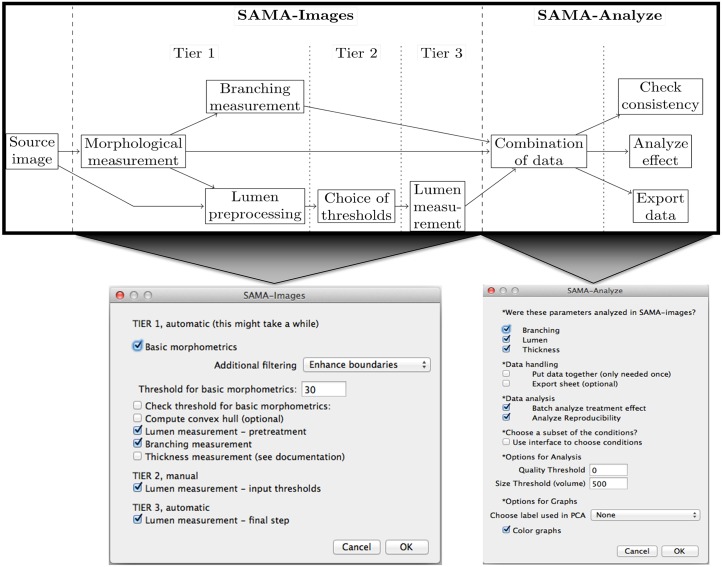
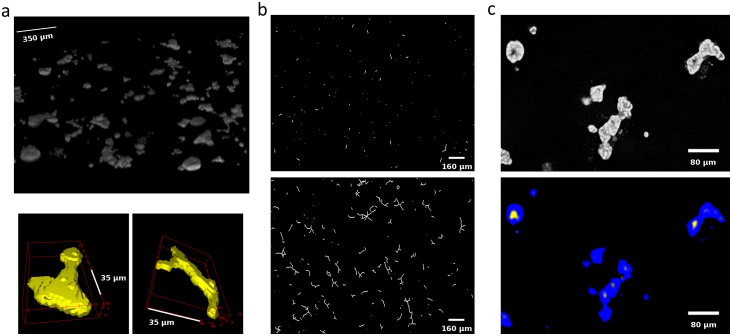
Three-dimensional (3D) culture models are critical tools for understanding tissue morphogenesis. A key requirement for their analysis is the ability to reconstruct the tissue into computational models that allow quantitative evaluation of the formed structures. Here, we present Software for Automated Morphological Analysis (SAMA), a method by which epithelial structures grown in 3D cultures can be imaged, reconstructed and analyzed with minimum human intervention. SAMA allows quantitative analysis of key features of epithelial morphogenesis such as ductal elongation, branching and lumen formation that distinguish different hormonal treatments. SAMA is a user-friendly set of customized macros operated via FIJI (http://fiji.sc/Fiji), an open-source image analysis platform in combination with a set of functions in R (http://www.r-project.org/), an open-source program for statistical analysis. SAMA enables a rapid, exhaustive and quantitative 3D analysis of the shape of a population of structures in a 3D image. SAMA is cross-platform, licensed under the GPLv3 and available at http://montevil.theobio.org/content/sama.
Conflict of interest statement
Figures
Similar articles
-
Endothelial-rich microenvironment supports growth and branching morphogenesis of prostate epithelial cells.Prostate. 2013 Jun;73(8):884-96. doi: 10.1002/pros.22634. Epub 2012 Dec 31. Prostate. 2013. PMID: 23280591
-
Culture requirements of prostatic epithelial cell lines for acinar morphogenesis and lumen formation in vitro: role of extracellular calcium.Prostate. 2007 Nov 1;67(15):1601-13. doi: 10.1002/pros.20628. Prostate. 2007. PMID: 17705248
-
Label-free analysis of prostate acini-like 3D structures by lensfree imaging.Biosens Bioelectron. 2013 Nov 15;49:176-83. doi: 10.1016/j.bios.2013.05.001. Epub 2013 May 21. Biosens Bioelectron. 2013. PMID: 23747358
-
CellTrack: an open-source software for cell tracking and motility analysis.Bioinformatics. 2008 Jul 15;24(14):1647-9. doi: 10.1093/bioinformatics/btn247. Epub 2008 May 29. Bioinformatics. 2008. PMID: 18511469
-
Use of three-dimensional basement membrane cultures to model oncogene-induced changes in mammary epithelial morphogenesis.J Mammary Gland Biol Neoplasia. 2004 Oct;9(4):297-310. doi: 10.1007/s10911-004-1402-z. J Mammary Gland Biol Neoplasia. 2004. PMID: 15838601 Free PMC article. Review.
Cited by
-
Marker-controlled watershed with deep edge emphasis and optimized H-minima transform for automatic segmentation of densely cultivated 3D cell nuclei.BMC Bioinformatics. 2022 Jul 21;23(1):289. doi: 10.1186/s12859-022-04827-3. BMC Bioinformatics. 2022. PMID: 35864453 Free PMC article.
-
Software tools for 3D nuclei segmentation and quantitative analysis in multicellular aggregates.Comput Struct Biotechnol J. 2020 Jun 3;18:1287-1300. doi: 10.1016/j.csbj.2020.05.022. eCollection 2020. Comput Struct Biotechnol J. 2020. PMID: 32612752 Free PMC article. Review.
-
A comprehensive review of computational and image analysis techniques for quantitative evaluation of striated muscle tissue architecture.Biophys Rev (Melville). 2022 Dec;3(4):041302. doi: 10.1063/5.0057434. Epub 2022 Nov 4. Biophys Rev (Melville). 2022. PMID: 36407035 Free PMC article. Review.
-
Modeling Mammary Organogenesis from Biological First Principles: A Systems Biology Approach.Methods Mol Biol. 2024;2745:177-188. doi: 10.1007/978-1-0716-3577-3_11. Methods Mol Biol. 2024. PMID: 38060186
-
Vitamin D3 constrains estrogen's effects and influences mammary epithelial organization in 3D cultures.Sci Rep. 2019 May 15;9(1):7423. doi: 10.1038/s41598-019-43308-1. Sci Rep. 2019. PMID: 31092845 Free PMC article.
References
-
- Kohl P, Noble D, Winslow RL, Hunter PJ. Computational modelling of biolobical systems: tools and visions. Philos Trans R Soc London [Biol] 2000;358:579–610.
Publication types
MeSH terms
Grants and funding
LinkOut - more resources
Full Text Sources
Other Literature Sources
