. 2016 Apr 1;10(4):e0004592.
doi: 10.1371/journal.pntd.0004592. eCollection 2016 Apr.

Leprosy Reactions Show Increased Th17 Cell Activity and Reduced FOXP3+ Tregs with Concomitant Decrease in TGF-β and Increase in IL-6

Affiliations

Leprosy Reactions Show Increased Th17 Cell Activity and Reduced FOXP3+ Tregs with Concomitant Decrease in TGF-β and Increase in IL-6

Chaman Saini et al. PLoS Negl Trop Dis. .

Abstract

Background: 50% of leprosy patients suffer from episodes of Type 1/ reversal reactions (RR) and Type 2/ Erythema Nodosum Leprosum (ENL) reactions which lead to morbidity and nerve damage. CD4+ subsets of Th17 cells and CD25+FOXP3+ regulatory T cells (Tregs) have been shown to play a major role in disease associated immunopathology and in stable leprosy as reported by us and others. The aim of our study was to analyze their role in leprosy reactions.

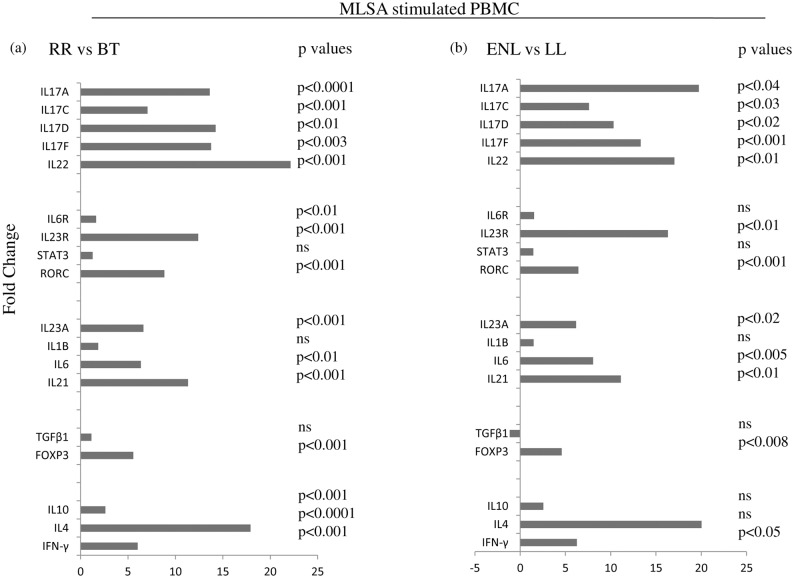
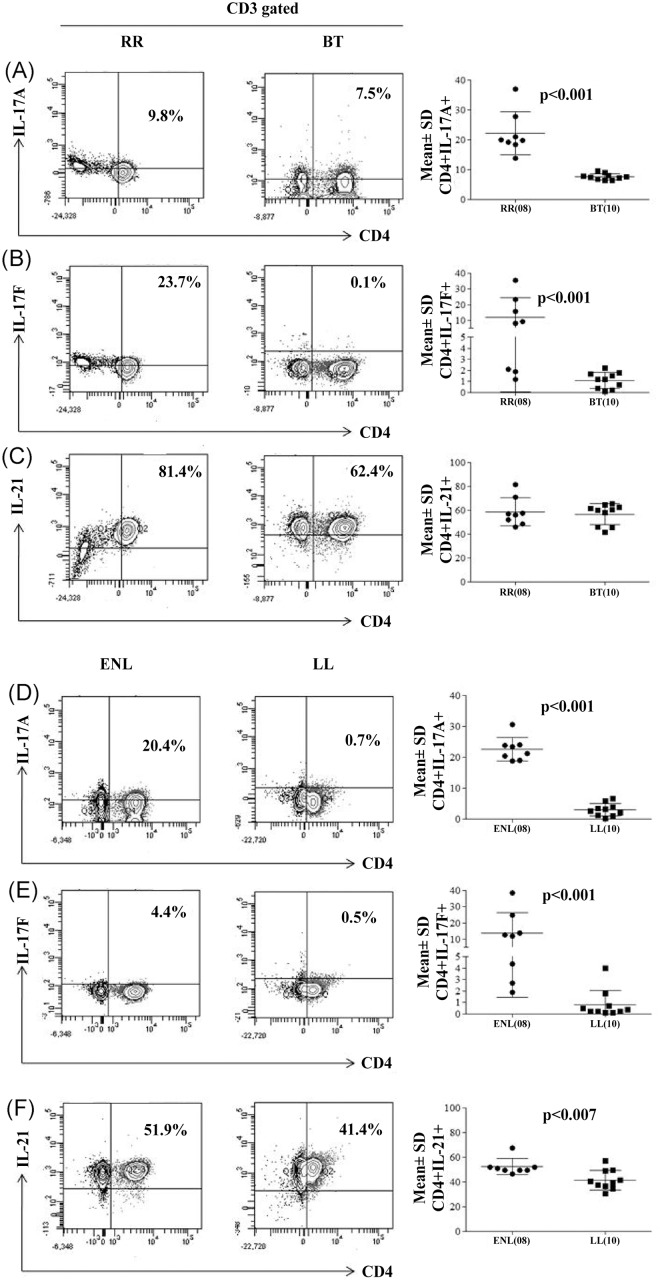
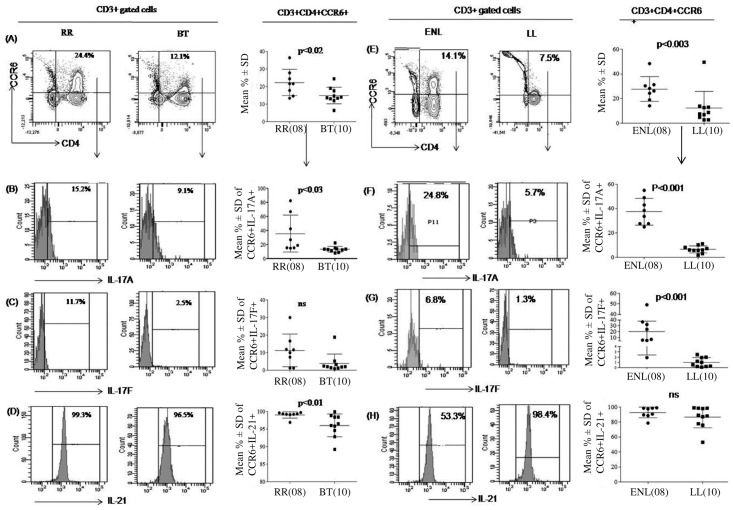
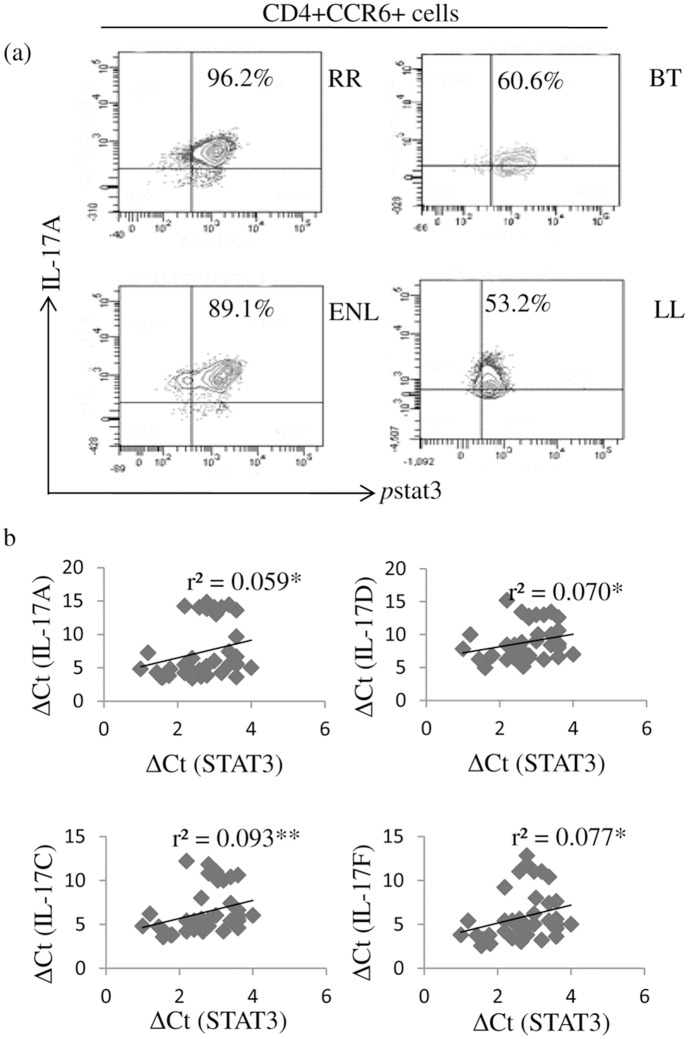
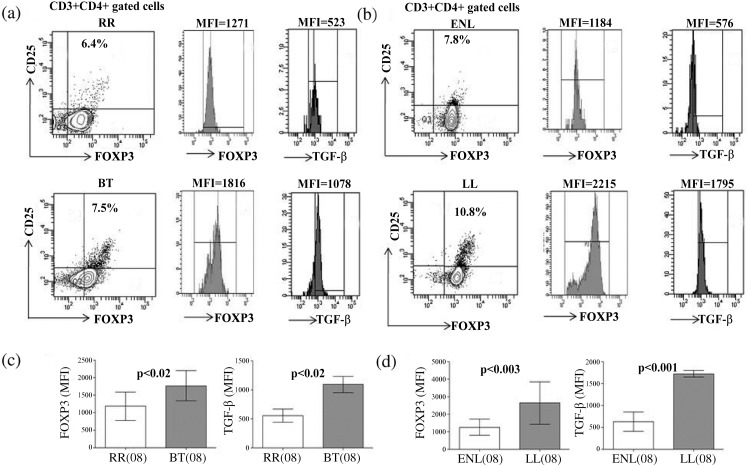
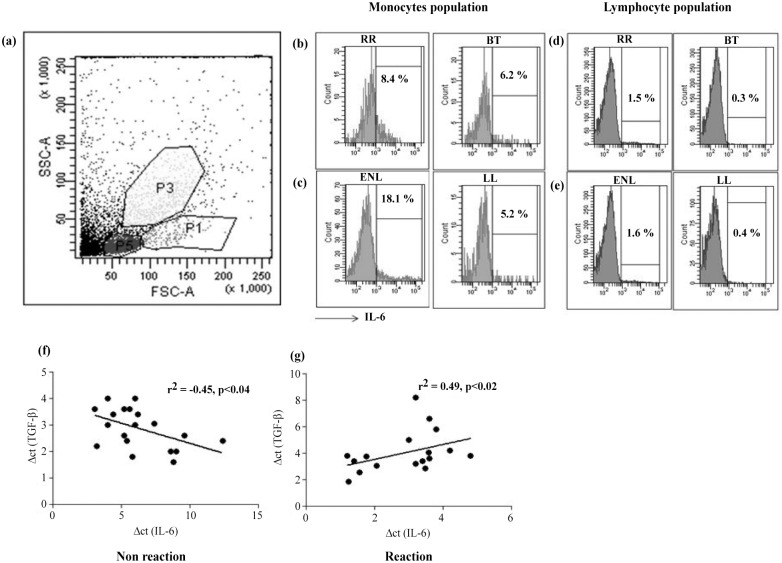
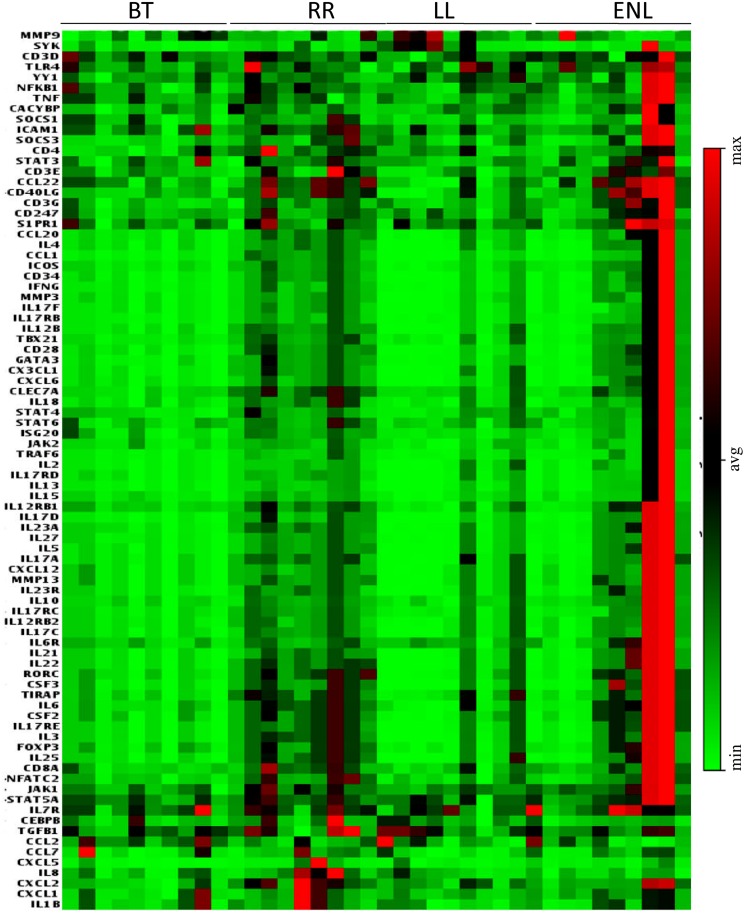
Methodology and principle findings: Quantitative reverse transcribed PCR (qPCR), flowcytometry and ELISA were used to respectively investigate gene expression, cell phenotypes and supernatant levels of cytokines in antigen stimulated PBMC cultures in patients with stable disease and those undergoing leprosy reactions. Both types of reactions are associated with significant increase of Th17 cells and associated cytokines IL-17A, IL-17F, IL-21, IL-23 and chemokines CCL20, CCL22 as compared to matching stable forms of leprosy. Concurrently patients in reactions show reduction in FOXP3+ Treg cells as well as reduction in TGF-β and increase in IL-6. Moreover, expression of many T cell markers, cytokines, chemokines and signaling factors were observed to be increased in RR as compared to ENL reaction patients.

Conclusions: Patients with leprosy reactions show an imbalance in Th17 and Treg populations. The reduction in Treg suppressor activity is associated withhigherTh17cell activity. The combined effect of reduced TGF-β and enhanced IL-6, IL-21 cytokines influence the balance between Th17 or Treg cells in leprosy reactions as reported in the murine models and autoimmune diseases. The increase in Th17 cell associated cytokines may contribute to lesional inflammation.


Conflict of interest statement

The authors have declared that no competing interests exist.

Figures

Fig 1
Fig 1. Fold change in gene expression of Th17, Treg, Th1 and 2 associated markers in leprosy reaction patients (RR,ENL) as compared to matching stable leprosy patients (BT, LL) as evaluated by qPCR of ex-vivo antigen (MLSA) stimulated PBMC.
Horizontal histogram shows significant fold increase in (a) RR, (b) ENL as compared to BT, LL patients respectively for gene expression of Th17 and Treg associated cytokines, receptors and transcription factors as well as Th1 and Th2 cytokines. p value was calculated based on a Student’s t-test and p< 0.05 was considered to be statistically significant. Abbreviations: BT; borderline tuberculoid, RR; reversal reaction, LL; lepromatous leprosy, ENL; erythema nodosum leprosum as per Ridley Jopling classification[2,29], ns = non significant.
Fig 2
Fig 2. Increase in IL-17 and IL-21 bearing CD3+CD4+ T cells in patients undergoing leprosy reactions.
Flowcytometry analysis of antigen stimulated PBMC from one each of representative patient with RR, BT, ENL, and LL leprosy (see Materials and Methods). Dot plot shows percentage of CD3+ gated CD4+ cells with intracellular IL-17A (Figs A, D), IL-17F (Figs B, E) and IL-21 (Figs C, F) in BT, RR and LL, ENL subjects. Scattergram (Mean % ± SD of cells) confirms the significant increase in percentage of Th17 cells in RR, ENL compared to BT, LL patients respectively for IL-17A, IL-17F cytokines as indicated by p values. IL-21+ cells were increased only in ENL. p< 0.05 was considered statistically significant (two tailed Mann-Whitney). (), parenthesis shows number of subjects tested. Abbreviations as in Fig 1.
Fig 3
Fig 3. CD4+CCR6+ effector Th17 cells are increased in patients undergoing leprosy reactions.
Flowcytometry analysis of antigen stimulated PBMC from one representative patient of RR, BT, ENL and LL (see Materials and Methods). Fig 3 and e show dot blots with increase in percentage of CD3+ CD4+CCR6+ cells in RR as compared to BT (A) and ENL as compared to LL patient(E). Histograms show increase in percentages of intracellular IL-17A+ (B, F), IL-17F+ (C, G) and IL-21+ cells (D, H) in both leprosy reactions as compared to stable leprosy patients. Scattergrams show individual data with Mean % ± SD of IL-17A/F, IL-21 in patient groups. p< 0.05 was considered statistically significant (two tailed Mann-Whitney). (), Parenthesis shows number of subjects tested. Abbreviations as in Fig 1.
Fig 4
Fig 4. Increase in pSTAT3+IL17+ cells in leprosy reactions patients.
Flow cytometry analysis of antigen stimulated 48 h culture of PBMC shows increase in pSTAT3 bearing CCR6+ cells with intracellular IL-17A in both RR and ENL subjects as compared to matching stable leprosy (a) Representative dot plots from each of RR, BT and ENL, LL leprosy patients (see Materials and Methods). (b) Scatter plots of combined qPCR data from both reaction patients RR and ENL, showing significant positive correlation of STAT3 expression (ΔCT) with IL17A, IL17D, IL17C and IL17F. Correlation coefficient (r2) was calculated by Spearman non-parametric correlation test, p< 0.05 was considered statistically significant. p<0.01 = *, p<0.001 = **, Abbreviations as in Fig 1.
Fig 5
Fig 5. Reduction of FOXP3 and TGF-β in T cells of leprosy reaction patients.
Flowcytometry analysis demonstrates reduction in percentage of CD3+CD4+gated CD25+FOXP3+ cells (see Materials and Methods). Dot plots show percentage of CD25+FOXP3+ cells in representative patients with RR, ENL as compared to stable BT, LL patients respectively. Histogram shows MFI (mean florescent intensity) of nuclear FOXP3 and intracellular TGF-β in each of RR and ENL as compared to respective BT and LL (Figs a, b). Bar diagram shows MFI of nuclear FOXP3 and TGF-β (mean±SD) in RR, ENL as compared to BT, LL leprosy groups respectively (Figs b, c). Data were analyzed using two tailed Mann-Whitney, p< 0.05 was considered as statistically significant. (), Parenthesis shows number of subjects tested. Abbreviations as Fig 1.
Fig 6
Fig 6. IL-6 increase in leprosy reactions is associated with monocyte population in antigen stimulated PBMC cultures of patients.
Fig 6(a) shows monocytes gating strategy in flowcytometry. Histogram represents percentage of IL-6+ population in monocyte and lymphocyte populations in one each of (b, d) RR, BT and (c,e) ENL, LL respectively. Scattergrams shows pooled qPCR data where TGF-β and IL-6 gene expression was undertaken on antigen stimulated PBMC of patients of (f) non-reaction stable (BT, LL) and (g) leprosy reaction (RR, ENL) patients. Correlation coefficient (r2) was calculated by Spearman nonparametric correlation test, p< 0.05 was considered statistically significant. Abbreviations as in Fig 1.
Fig 7
Fig 7. Heat map of customized PCR array showing differential expression of 84 genes in antigen stimulated PBMC of leprosy groups.
Each horizontal row represents the same gene product and each vertical row the same patient. The fluorescence range from high (red) to low (green) is indicated by the colored bar and reflects the degree of fluorescence intensity/gene expression. Heat map obtained from online free software S.A Bioscience (pcrdataanalysis.sabiosciences.com). In general, PBMC of patients in reactions show higher expression of several genes representing, cytokines, cytokine receptors, cheekiness and transcription factors as compared to non reaction patients (see also Table 5). Abbreviations as in Fig 1.

Similar articles

Cited by

References

    1. WHO (2014) Weekly epidemiological record. 89: 389–400. - PubMed
    1. Ridley DS, Jopling WH (1966) Classification of leprosy according to immunity. A five-group system. Int J Lepr Other Mycobact Dis 34: 255–273. - PubMed
    1. Nath I, Chaduvula M (2010) Immunological Aspects In: Kar HK KB, editor. IAL Textbook of LEPROSY. First ed New Delhi: Jaypee Brothers Medical Publishers (P) Ltd; pp. 60–73.
    1. Modlin RL (1994) Th1-Th2 paradigm: insights from leprosy. J Invest Dermatol 102: 828–832. - PubMed
    1. Misra N, Murtaza A, Walker B, Narayan NP, Misra RS, et al. (1995) Cytokine profile of circulating T cells of leprosy patients reflects both indiscriminate and polarized T-helper subsets: T-helper phenotype is stable and uninfluenced by related antigens of Mycobacterium leprae. Immunology 86: 97–103. - PMC - PubMed

Publication types

MeSH terms

Substances