. 2016 Apr 1;12(4):e1005962.
doi: 10.1371/journal.pgen.1005962. eCollection 2016 Apr.

Staphylococcus aureus Transcriptome Architecture: From Laboratory to Infection-Mimicking Conditions

Affiliations

Staphylococcus aureus Transcriptome Architecture: From Laboratory to Infection-Mimicking Conditions

Ulrike Mäder et al. PLoS Genet. .

Abstract

Staphylococcus aureus is a major pathogen that colonizes about 20% of the human population. Intriguingly, this Gram-positive bacterium can survive and thrive under a wide range of different conditions, both inside and outside the human body. Here, we investigated the transcriptional adaptation of S. aureus HG001, a derivative of strain NCTC 8325, across experimental conditions ranging from optimal growth in vitro to intracellular growth in host cells. These data establish an extensive repertoire of transcription units and non-coding RNAs, a classification of 1412 promoters according to their dependence on the RNA polymerase sigma factors SigA or SigB, and allow identification of new potential targets for several known transcription factors. In particular, this study revealed a relatively low abundance of antisense RNAs in S. aureus, where they overlap only 6% of the coding genes, and only 19 antisense RNAs not co-transcribed with other genes were found. Promoter analysis and comparison with Bacillus subtilis links the small number of antisense RNAs to a less profound impact of alternative sigma factors in S. aureus. Furthermore, we revealed that Rho-dependent transcription termination suppresses pervasive antisense transcription, presumably originating from abundant spurious transcription initiation in this A+T-rich genome, which would otherwise affect expression of the overlapped genes. In summary, our study provides genome-wide information on transcriptional regulation and non-coding RNAs in S. aureus as well as new insights into the biological function of Rho and the implications of spurious transcription in bacteria.


Conflict of interest statement

The authors have declared that no competing interests exist.

Figures

Fig 1
Fig 1. Transcriptional landscape reconstruction leads to a new annotation of the S. aureus HG001 genome.
Panels (A-G) show examples of the different categories of transcription segments outside annotated CDSs and RNA genes. Each panel shows from top-to-bottom (i) the original GenBank annotation, (ii) a selection of 30 representative expression profiles (horizontal black lines show for each strand the chromosome median, and the associated 5-fold and 10-fold cut-offs) colored according to the position of the hybridization in 3D PCA, (iii) the detected up-shifts, the associated transcription units, and the down-shift positions, (iv) the new annotation with unannotated expressed segments colored according to the classification based on the transcriptional context. The different categories of terminal regions are 5’UTR (green boxes) and three classes of 3’ regions: 3’UTR (red) ending with a defined termination site, 3’NT (orange) without defined termination site, and 3’PT (old yellow) downstream a site of partial termination. Two categories of intergenic regions are distinguished: intra (dark blue) for strictly intracistronic regions, and inter (light blue) for regions where the downstream gene can be transcribed from its own promoter. Finally, depending of the presence or absence of a defined termination site, independent segments decompose into two categories: indep (black) and indep-NT (brown). Transcription segments overlapping (≥100bp or ≥50%) GenBank annotated genes on the opposite strand are referred to as antisense (AS).
Fig 2
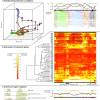
Fig 2. The diversity of S. aureus HG001 wild-type expression profiles across 156 RNA samples from 44 laboratory and infection-related experimental conditions.
(A) The left subpanel shows a 3D representation of the relationships between the 156 RNA samples. This projection obtained by Principal Component Analysis accounts for ~67% of the total variance in the initial space of the expression levels of 4028 chromosomal regions (annotated genes and new segments). A different color was associated to each RNA sample according to its position in the 3D space, each axis being associated with a different color component (R/G/B). The right sub-panel displays the 156 RNA samples along a single horizontal axis corresponding to the shortest tour also represented by a black polygonal path in the 3D representation. Below the horizontal axis, a unique identifier of the biological condition is reported vertically (when consecutive RNA samples arise from the same biological condition only the first biological replicate is labeled). Above the horizontal axis, three curves indicate the coordinates of the RNA samples on the three first axes of the PCA. (B) Heatmap representation of the expression profiles of selected genes: reference genes for amino-acid, iron and oxygen limitation; genes known to be involved in virulence ordered by hierarchical clustering. On the left-hand side, the scale bar provides the correspondence between colors and quantile-normalized expression levels. (C) Activity of the SigA and SigB regulons across RNA samples computed as the average expression level of SigA-dependent and SigB-dependent promoters identified by our analysis. On the left-hand side the consensus motifs (shown as sequence logos) defined by our analysis indicate the characteristics of the different types of sigma-factor binding sites.
Fig 3
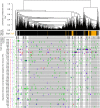
Fig 3. Promoter tree, sigma-factor and TFBS predictions.
From top to bottom, the figure includes the following elements: A promoter tree built by hierarchical clustering of promoter activities across RNA samples based on pairwise correlations. The classification of up-shifts according to the type of sigma-factor binding sites identified (black bars for SigA, orange bars for SigB, gray bars for lack of sigma-factor binding site identification). The clusters of size ≥15 promoters obtained when splitting the tree at an average Pearson correlation coefficient 0.6. The TFBSs identified by MAST search. Here, the different transcription factors are listed on the left-hand side of the plot along with the counts for three different categories of up-shifts. The color codes used for counts and symbols are: blue for sites predicted by MAST search and included in the training (RegPrecise) set, red for sites in the training set but not identified by our MAST search, green for sites predicted by MAST search but not listed in the training set thus representing newly identified potential TFBSs.
Fig 4
Fig 4. Context and impact of elevated antisense expression levels in the Δrho mutant.
(A) Transcription profiles for selected regions showing different effects of rho deletion, from left to right: 1) flattening of the downstream drift expression patterns typical of regions lacking defined termination sites (3’PT and 3’NT); 2) & 3) expression of regions for which no promoters are detected in the wild-type; 4) & 5) transcriptional read-through at defined termination sites; 6) higher transcript levels of coding genes. For the first two regions we show the transcription profiles for the four growth conditions examined, with wild-type profiles in black and Δrho mutant profiles in condition-specific colors, as well as the 30 representative wild-type profiles. As seen in these examples, the impact of rho deletion tends to be stronger in RPMI than in TSB medium and in exponential growth than in stationary phase. Some degree of decrease of sense transcript levels, which may be caused by elevated antisense levels, is seen in these examples. (B) Sense versus antisense transcription levels in the wild-type and in the Δrho mutant for exponential growth in RPMI. Each annotated gene is represented by a point. There is a strong negative correlation between sense and antisense expression in the Δrho mutant (Pearson correlation coefficient r = -0.73) that is also visible but much weaker in the wild-type (r = -0.30). Indeed, antisense levels tend to increase genome-wide in the Δrho mutant, except for the antisense strand of the most highly expressed genes. The most down-regulated genes (expression level in the Δrho mutant is ≤50% of the wild-type) are highlighted in blue; they face antisense transcripts with particularly elevated levels in the Δrho mutant. Horizontal and vertical lines indicate the medians (global in gray, most down-regulated genes in blue).
Fig 5
Fig 5. Northern blot analysis of a Δrho mutant-specific antisense transcript facing a tri-cistronic transcription unit starting with SAOUHSC_00972.
(A) Transcription profiles of the genomic region assayed. S. aureus wild-type (black lines) and Δrho mutant (colored lines) were grown in RPMI and TSB medium. (B) Northern blot analysis of the same RNA samples (5 μg per lane) using RNA probes (indicated by red bars) directed against SAOUHSC_00975 and the antisense strand of SAOUHSC_00974. The SAOUHSC_00975 probe detected the 0.5-kb mRNA in both strains and the longer read-through transcript in the Δrho mutant. The antisense specific probe detected only the 2.5-kb transcript specific to the mutant samples.

Similar articles

Cited by

References

    1. Lowy FD (1998) Staphylococcus aureus infections. N Engl J Med 339: 520–532. - PubMed
    1. Wertheim HF, Vos MC, Ott A, van Belkum A, Voss A, et al. (2004) Risk and outcome of nosocomial Staphylococcus aureus bacteraemia in nasal carriers versus non-carriers. Lancet 364: 703–705. - PubMed
    1. van Belkum A, Verkaik NJ, de Vogel CP, Boelens HA, Verveer J, et al. (2009) Reclassification of Staphylococcus aureus nasal carriage types. J Infect Dis 199: 1820–1826. 10.1086/599119 - DOI - PubMed
    1. Roy JP, Keefe G (2012) Systematic review: what is the best antibiotic treatment for Staphylococcus aureus intramammary infection of lactating cows in North America? Vet Clin North Am Food Anim Pract 28: 39–50. 10.1016/j.cvfa.2011.12.004 - DOI - PubMed
    1. Kadariya J, Smith TC, Thapaliya D (2014) Staphylococcus aureus and staphylococcal food-borne disease: an ongoing challenge in public health. Biomed Res Int 2014: 827965 10.1155/2014/827965 - DOI - PMC - PubMed

Publication types

Substances