. 2016 Apr 12;113(15):4063-8.
doi: 10.1073/pnas.1507291113. Epub 2016 Mar 28.

Discrete gene replication events drive coupling between the cell cycle and circadian clocks

Affiliations

Discrete gene replication events drive coupling between the cell cycle and circadian clocks

Joris Paijmans et al. Proc Natl Acad Sci U S A. .

Abstract

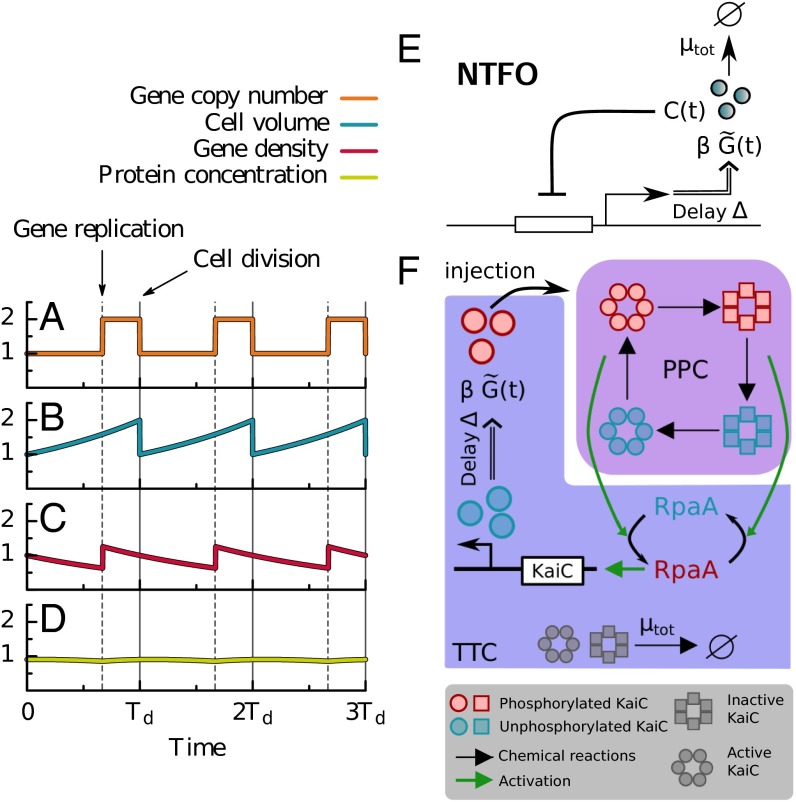
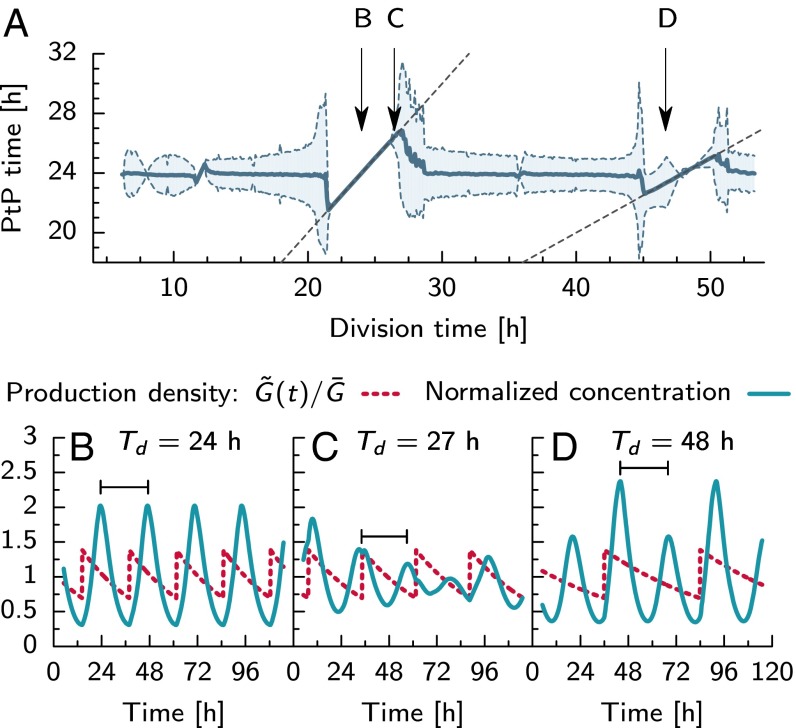
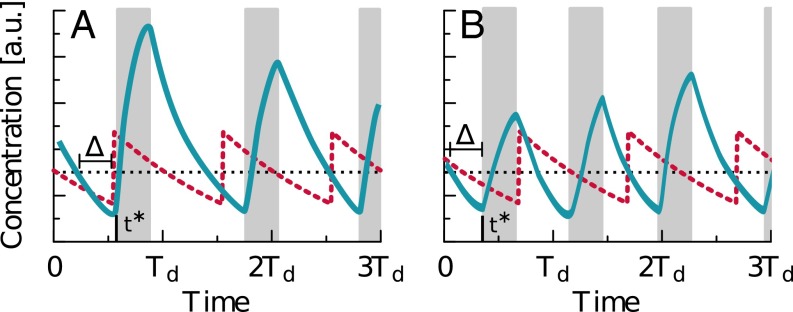
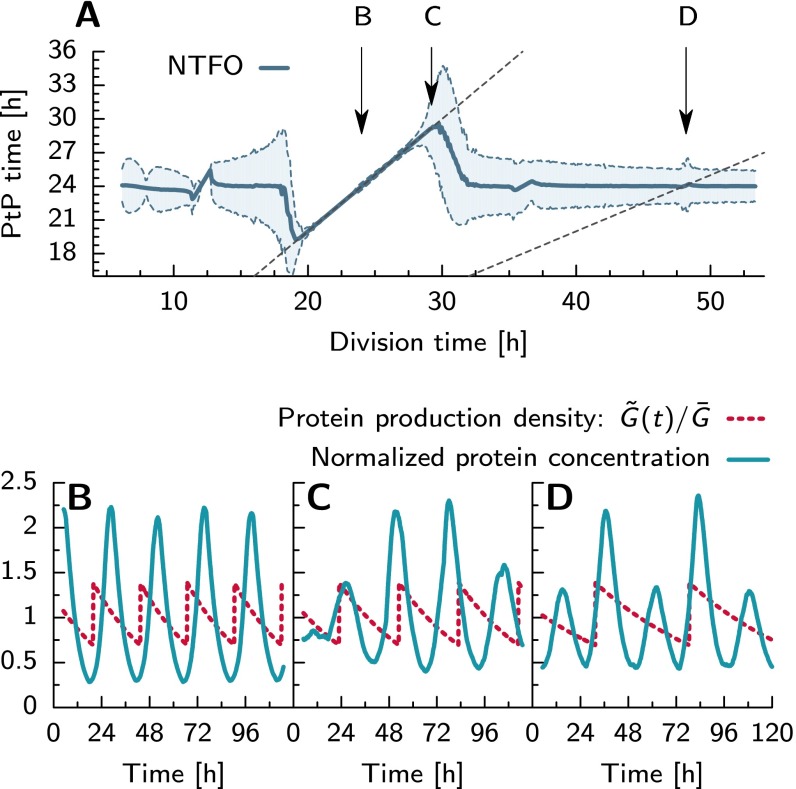
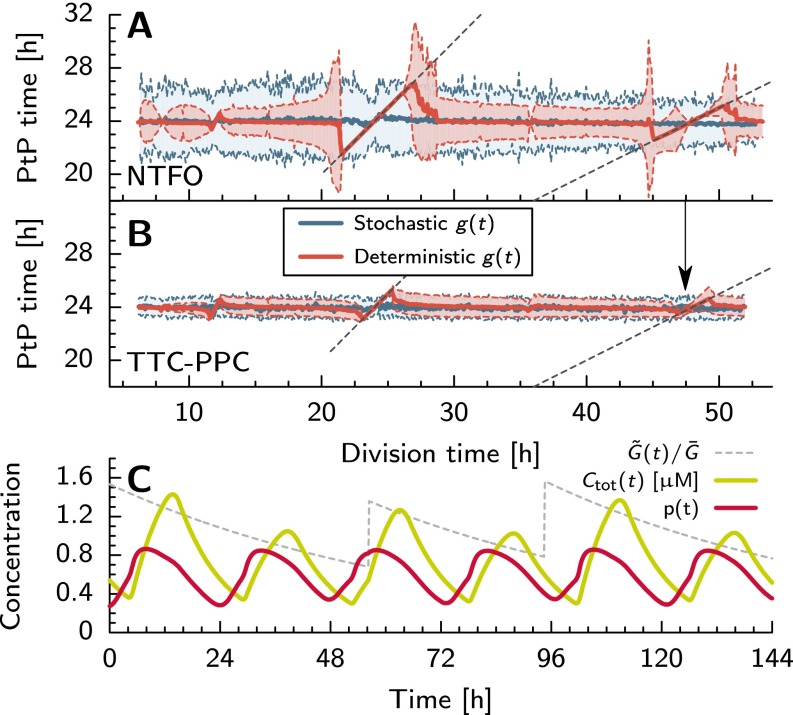
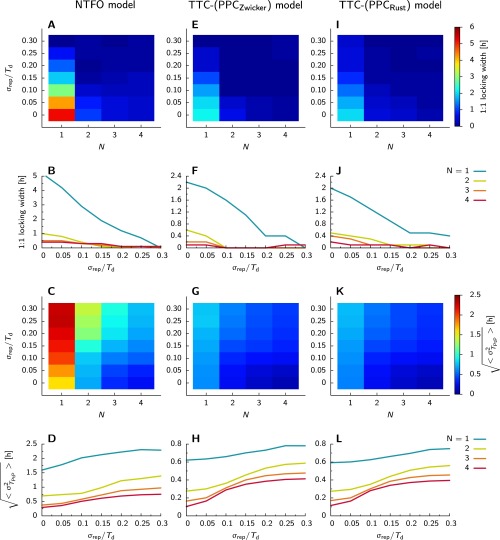
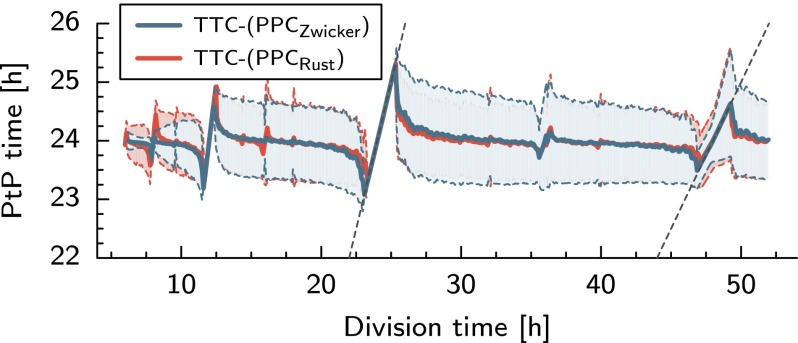
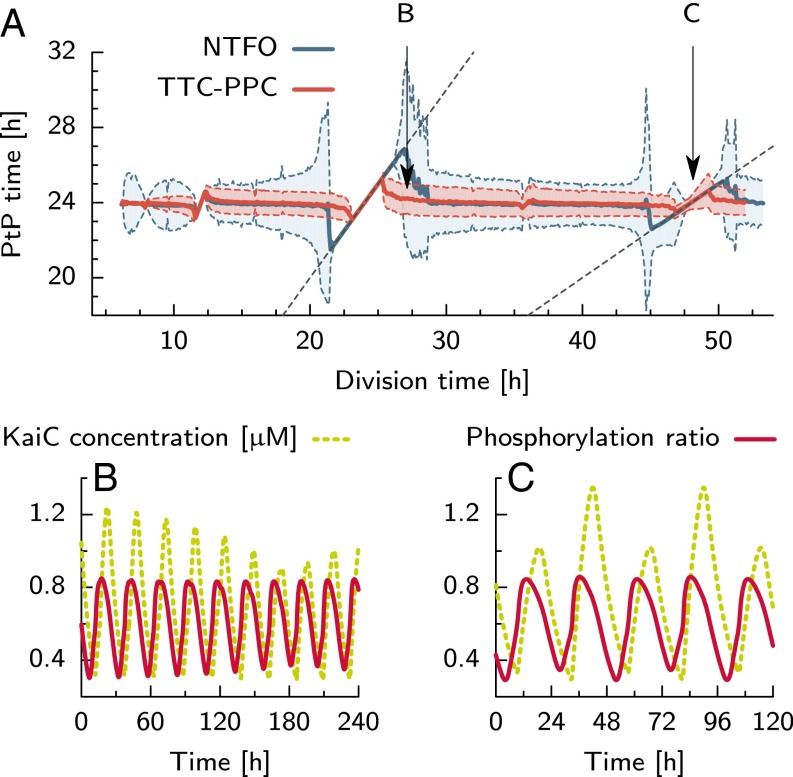
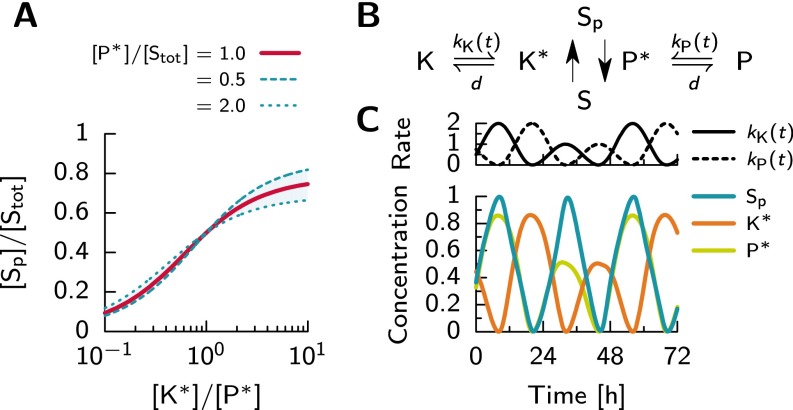
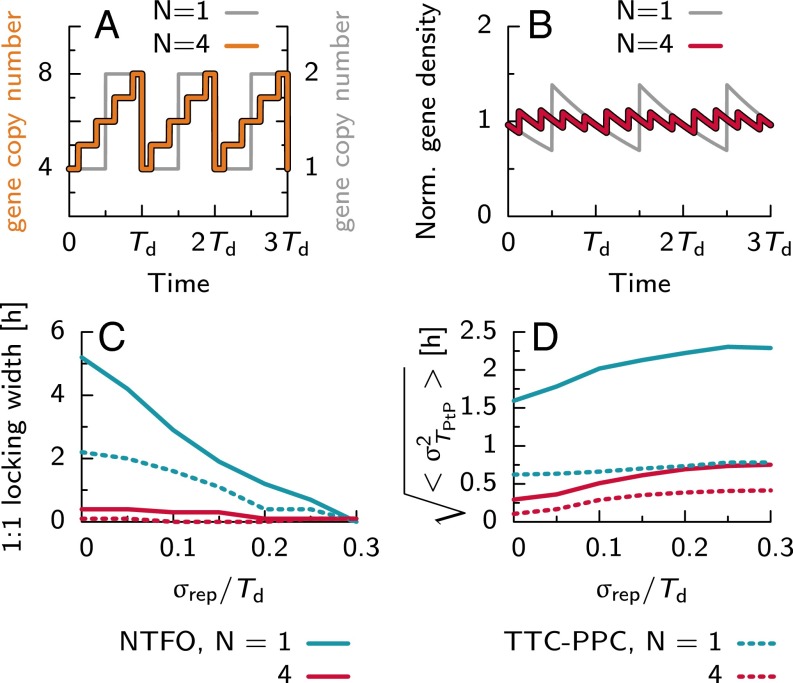
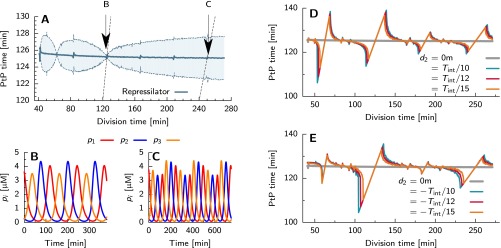
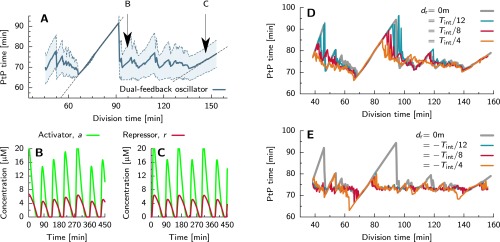
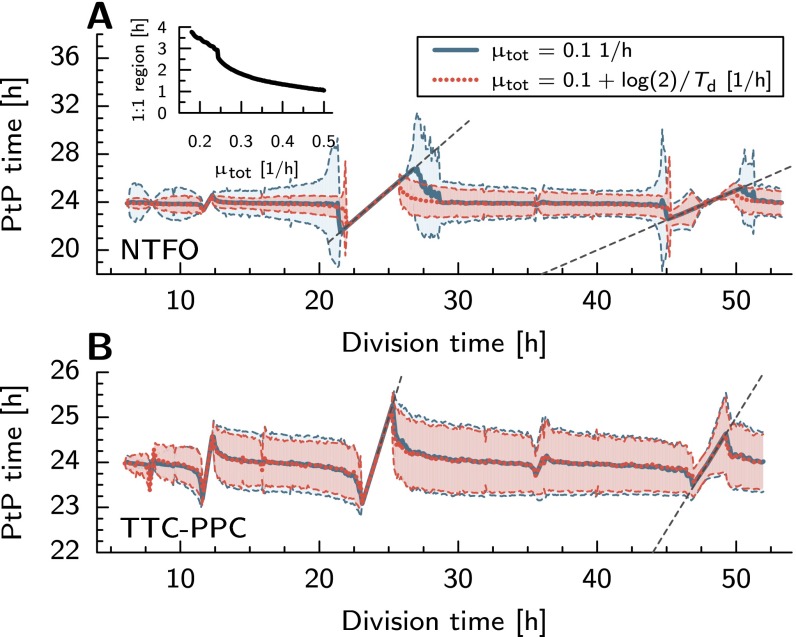
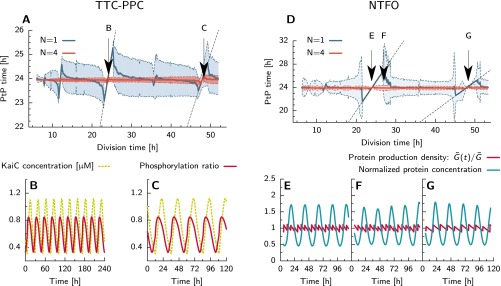
Many organisms possess both a cell cycle to control DNA replication and a circadian clock to anticipate changes between day and night. In some cases, these two rhythmic systems are known to be coupled by specific, cross-regulatory interactions. Here, we use mathematical modeling to show that, additionally, the cell cycle generically influences circadian clocks in a nonspecific fashion: The regular, discrete jumps in gene-copy number arising from DNA replication during the cell cycle cause a periodic driving of the circadian clock, which can dramatically alter its behavior and impair its function. A clock built on negative transcriptional feedback either phase-locks to the cell cycle, so that the clock period tracks the cell division time, or exhibits erratic behavior. We argue that the cyanobacterium Synechococcus elongatus has evolved two features that protect its clock from such disturbances, both of which are needed to fully insulate it from the cell cycle and give it its observed robustness: a phosphorylation-based protein modification oscillator, together with its accompanying push-pull read-out circuit that responds primarily to the ratios of different phosphoform concentrations, makes the clock less susceptible to perturbations in protein synthesis; the presence of multiple, asynchronously replicating copies of the same chromosome diminishes the effect of replicating any single copy of a gene.

Keywords: Kai; cell cycle; circadian rhythms; oscillations; simulation.


Conflict of interest statement

The authors declare no conflict of interest.

Figures

Fig. 1.
Fig. 1.
DNA replication, but not cell division, affects average expression levels; for a protein that is constitutively expressed and decays by dilution only, the effect is small. Schematic time courses of the gene copy number g(t) (A), the cell volume V(t) (B), the gene density, G(t)=g(t)/V(t) (C), and the concentration C(t) of a constitutively expressed protein that decays only by dilution (D). Time in units of the cell division time Td; vertical axes, arbitrary units. The gene density (C) has a discontinuity when the gene is replicated (vertical dotted lines) but not at cell division (vertical solid lines), when both g(t) and V(t) are halved. Even though the protein synthesis rate doubles when the gene is replicated, the maximum deviation of C(t) from its time average is less than 4% (D). (E) The NTFO model: A protein with concentration C(t) represses its own transcription with a delay Δ. (F) Zwicker et al. (36) model for coupled phosphorylation (PPC, purple background) and transcription–translation (TTC, blue background) cycles. KaiC hexamers switch between an active conformational state (circles) in which their phosphorylation level tends to rise and an inactive state (squares) in which it tends to fall. Active KaiC activates RpaA and inactive KaiC inactivates RpaA; active RpaA (red) activates kaiBC expression, leading (after a delay) to the injection of fully phosphorylated KaiC (pink) into the PPC.
Fig. 2.
Fig. 2.
Periodic gene replication dramatically affects an NTFO. (A) The average peak-to-peak time TPtP (solid curve) versus the cell division time Td at fixed μtot and β. The shaded region shows the SD of the peak-to-peak times (Supporting Information). Dashed lines indicate regions where the clock locks to the cell cycle with periods in a 1:1 (left) or 2:1 (right) ratio. (Smaller locking regions around Td=6,12,and36 h are not marked.) (BD) Protein concentration C(t) (blue solid line) and the protein production density G˜(t)=g(tΔ)/V(t) (red dashed line) for the values of Td indicated by the arrows in A; horizontal brackets in BD illustrate the definition of the peak-to-peak time TPtP. At Td=24 h (B), the clock locks firmly to the cell cycle. For Td=27 h (C), the cell-cycle period is just too large for locking; as a result, the cell cycle dramatically disrupts the clock, leading to a large SD of TPtP (see A). At Td=48 h (D), two oscillation cycles of the NTFO fit exactly in one division time. The larger-amplitude oscillation cycle corresponds to cell-cycle phases where G˜(t) is higher and the smaller amplitude to phases where G˜(t) is lower. Similar results are obtained upon varying Td at constant μact (Fig. S8).
Fig. 3.
Fig. 3.
Locking mechanism for the NTFO. Shown are time courses of the production density G˜(t)=g(tΔ)/V(t) (dashed red lines) and the protein concentration C(t) (solid blue lines). For clarity, we consider the limit n, in which the Hill function describing autoregulation (Eq. 2) reduces to a step function with repression threshold Kc, denoted by the dotted horizontal line. Shaded regions indicate times when C(t) is rising. The panels correspond to two different initial phase differences between the NTFO and the cell cycle. In each case, when C(t) drops below Kc at time tΔ, protein production starts, but because of the delay Δ, new molecules are injected into the system only at time t. (A) The gene has replicated just before tΔ, and G˜(t) is hence large, yielding a large amplitude for the next NTFO cycle. Because the rate of protein decay is independent of G˜(t), the period of the NTFO cycle is correspondingly long. The subsequent NTFO cycle thus begins at smaller G˜(t), causing it to have a smaller amplitude and a shorter period. (B) The gene has not yet replicated at time tΔ, and G˜(t) is therefore low; consequently, the amplitude and period of the next NTFO cycle are small. The beginning of the subsequent cycle is then shifted toward higher G˜(t), increasing its period. In both cases, the result is that, after a few cell cycles, the period of the NTFO oscillation approaches that of the cell cycle, yielding stable 1:1 locking where the two oscillators have a well-defined phase relation. The largest amplitude and thus longest possible clock period arise when the protein synthesis phase (gray bar) coincides with the maximal G˜(t); if Td increases beyond this maximal period, locking cannot occur. An analogous loss of locking occurs if Td decreases below the minimal possible clock period. In either case, the clock shows erratic behavior until Td approaches values where 1:2 or 2:1 locking is possible.
Fig. S1.
Fig. S1.
The effect of intrinsic noise on the locking of the NTFO to the cell cycle. (A) Average (solid line) and SD (shaded region) of the peak-to-peak time TPtP as a function of the division time Td for an NTFO with intrinsic noise and initial gene copy number N=1. The region of 1:1 locking with the cell cycle (left dashed line) has widened considerably compared with the deterministic case (Fig. 2A of the main text), and the SD in TPtP outside the locking region has increased. In contrast, the region of 2:1 locking (right dashed line) has shrunk almost to nothing. (BD) Representative time traces for the division times indicated by the arrows in A. Shown are the protein concentration C(t)=NC(t)/V(t) of the NTFO (blue solid line) and the protein production density G˜(t) (red dashed line), both normalized by their time average values. At a division time of Td=24 h (B), the NTFO is locked to the cell cycle. Because of the intrinsic noise, the amplitude varies slightly from one oscillation cycle to the next. At Td=27 h (C), just outside the locking region, the oscillator exhibits irregular behavior. At Td=48 h (D), the NTFO oscillations switch between a small and a large amplitude in successive oscillation cycles, just as in the deterministic case.
Fig. S2.
Fig. S2.
The effect of stochasticity in the timing of gene replication on locking to the cell cycle. (A) The average and variance of TPtP for an NTFO in which the timing of gene replication is deterministic (red) or is drawn from a Gaussian distribution with a width σ that is 30% of the cell-division time Td(blue). The stochasticity in the replication times decreases the width of the locking regions but increases the variance in the peak-to-peak times. (B) Same as A, but for TPtP of the phosphorylation fraction p(t) of the TTC–(PPCZwicker) model (36) (see the supporting information of ref. 36). Again, stochasticity in the timing of replication reduces locking, but in this case the increase in the variance of TPtP outside the locking region is much less marked. We attribute this to the ability of the PPC to insulate the clock from variability in gene expression levels. (C) Representative time traces of the production density G˜(t) (normalized to its time average), the phosphorylation fraction p(t), and the total KaiC concentration Ctot(t) for the Zwicker model for Td= 48 h. As in the deterministic limit, the amplitude of the Ctot(t) oscillations tends to alternate between a high and a low value, due to gene replication occurring every 48 h, on average; in contrast, the amplitude of p(t) is relatively constant. The effect of periodic gene replication on Ctot(t) should thus be observable experimentally.
Fig. S3.
Fig. S3.
Heat plots of the width of the 1:1 locking region (A, E, and I) and the average SD of the peak-to-peak time (C, G, and K) as a function of the initial gene copy number N and the SD in the gene replication time σrep/Td, for the NTFO model (AD), the TTC–(PPCZwicker) model (36) (EH), and the TTC–(PPCRust) model (26, 36) (IL). B, D, F, H, J, and L show the same data as in the heat plots immediately above them, but as a function of σrep/Td, for different values of N; note the difference in scale of the y axes in these panels. The major results of B, D, F, and H are also summarized in Fig. 5 C and D of the main text. The average SD in the peak-to-peak time is the SD in the peak-to-peak time averaged over 6<Td<52; it is a measure for the erratic behavior of the clock outside the locking regions. It is seen that in all models the width of the locking region rapidly decreases with both N and σrep/Td. However, the average SD in the peak-to-peak time decreases with N but increases with σrep/Td. Clearly, although having multiple chromosome copies is a powerful strategy for preventing locking, increasing the stochasticity in the timing of gene replication is not—decreasing locking at the expense of much greater variation in the length of the periodic is unlikely to be functionally advantageous. Comparing the two models with a PPC to the NTFO model shows that adding a PPC to a TTC also decreases both the width of the locking region and the average SD in the peak-to-peak time. Combining both features—a PPC and multiple chromosome copies—gives the strongest reduction in the coupling of the clock to the cell cycle.
Fig. S4.
Fig. S4.
The TTC–(PPCRust) model, which combines the TTC of Zwicker et al. (36) with the PPC of Rust et al. (26), is susceptible to periodic gene replication. The figure shows the average and SD of the peak-to-peak time TPtP of the phosphorylation fraction p(t) for the TTC–(PPCRust) model and the TTC–(PPCZwicker) model (36). Clearly, the two models are similarly affected by the presence of the cell cycle.
Fig. 4.
Fig. 4.
A clock with interlocked phosphorylation and transcriptional cycles is more robust against perturbations from periodic gene replication. (A) The average peak-to-peak times TPtP of the phosphorylation level p(t) of the coupled TTC–PPC model of the Kai system (36) (red solid curve) and of C(t) of the NTFO (solid blue curve, same as Fig. 2A), as a function of the cell division time Td. The shaded regions show the SD of TPtP. Both the widths of the locking regions and the SDs of the peak-to-peak time outside the locking regions are smaller for p(t) of the Kai system than for C(t) of the NTFO. Arrows indicate division times for which we show time traces in B and C. (B) The total KaiC concentration Ctot(t) (dashed line) and p(t) (solid line) at Td=26 h. Although the amplitude of Ctot(t) is strongly affected by gene replication, the amplitude of p(t) is nearly constant. (C) Plots of p(t) and Ctot(t) at Td=48 h, where the amplitude of Ctot(t) alternates between a low and a high value depending on the gene copy number in the cell. In contrast, p(t) is almost unaffected by gene replication.
Fig. S5.
Fig. S5.
A push–pull network can read out the phosphorylation fraction p(t) while remaining insensitive to the total concentration Ctot(t) of KaiC. (A) Steady-state output of the push–pull network, the fraction of phosphorylated substrate [Sp]/[Stot], plotted against the ratio of the active kinase concentration, [K], to the active phosphatase concentration [P]; here, [Sp]/[Stot] mimics the phosphorylation fraction of RpaA. In steady state (but not necessarily in the general, time-varying case; see B) [K] directly reports the concentration of KaiC in the phosphorylation phase of the clock and [P] the concentration of KaiC in the clock’s dephosphorylation phase. For the solid red line, we change [K]/[P] from 0.1 to 10, while keeping [P] equal to [Stot]. The dashed and dotted lines show the result when both the kinase and phosphatase concentrations are halved or doubled, respectively. Because of the push–pull architecture, a change in the total concentration [K]+[P] at fixed [K]/[P] has only a small effect on the steady-state level of phosphorylated substrate [Sp]/[Stot]; the network predominantly responds to the ratio [K]/[P]. (B) Schematic of our model of a simple push–pull network. The amount of active kinase, [K], is controlled by the time-dependent rate kK(t) of conversion from K to K, and similarly for [P] and kP(t); we imagine that these rates are proportional to the amount of KaiC in the phosphorylation and dephosphorylation phases of the clock, respectively. The two enzymes return to their inactive states at constant rates d. The interconversion between S and Sp follows the standard Michaelis–Menten reaction scheme. (C) Reading out time-varying rates kK and kP. (Top) We let kK(t) oscillate with a peak-to-peak time of 24 h, with the amplitude of each consecutive oscillation cycle changing by a factor of two to mimic the variability in the total amount of KaiC when Td=48 h (Fig. 2 of the main text). kP(t) has the same behavior as kK(t), but phase shifted by 12 h. (Bottom) With these time-varying inputs, the active enzyme concentrations [K] and [P] track the conversion rates kK(t) and kP(t), but [Sp] shows an essentially constant amplitude from one cycle to the next. Thus, even with time-varying inputs, the activity of RpaA is sensitive primarily to the ratio kK(t)/kP(t), which plays the role of the phosphoryation ratio p(t), not to each rate individually, or by extention to the absolute concentrations of KaiC phosphoforms. In all calculations, KM=[Stot].
Fig. 5.
Fig. 5.
Multiple chromosome copies strongly reduce the cell cycle’s effect on the circadian clock. (A) Gene copy number g(t) for initial gene copy numbers N=4 (thick curve, left axis) and N=1 (thin curve, right axis) versus time (in units of cell-cycle time Td). The increase in g(t) is more gradual for N=4 than for N=1. (B) The gene density G(t)=g(t)/V(t), normalized to its time average, for N=4 (thick curve) and N=1 (thin curve). At a higher gene copy number, the deviations from the average gene density become smaller. The width of the 1:1 locking region (C) and the square root of the average variance in the peak-to-peak time (D) as a function of the SD in the gene replication time σrep in a model where the times of replication events vary stochastically about their means (Supporting Information), for the NTFO (solid line) and the TTC–PPC (36) (dashed line). Increasing the chromosome copy number N reduces both the width of the locking region (C) and the variance in the peak-to-peak time (D). In contrast, whereas increasing σdup reduces the former, it increases the latter. See also Figs. S3 and S9.
Fig. S6.
Fig. S6.
The repressilator (50) can strongly lock to the cell cycle, and the strength of locking depends sensitively on the temporal order in which the respective genes are replicated during the cell cycle. (A) Average (solid line) and SD (shaded region) of the peak-to-peak time TPtP as a function of the division time Td for a repressilator with initial gene copy number N=1. The repressilator has an intrinsic period of Tint=125 min and the three genes are replicated simultaneously. The locking regions around Tint and 2Tint are almost absent. (B and C) Representative time traces of the concentrations of the three repressilator proteins, p1(t) (red), p2(t) (blue), and p3(t) (orange), for the cell-division times indicated by the arrows in A. (B) When Td=Tint, the oscillations are very regular (almost no variance in the PtP times), but each protein concentration has a different amplitude. (C) At Td=2Tint, all three protein concentrations switch between a small and a large amplitude in successive oscillation cycles. (D and E) The effect of varying the timing of replication of the three genes. For clarity, we only show the average peak-to-peak time as a function of Td, not the standard deivation. We assume that the p1 gene is always replicated halfway through the cell cycle, d1=0, and that the p2 and p3 genes are replicated with delays d2 and d3=d2, respectively. The gray line gives the situation where all genes are replicated simultaneously, d1=d2=d3=0. Other values of d2 are given in the legend and are written as a fraction of the intrinsic period Tint of the oscillator. D shows scenarios for which d3<d1<d2, meaning that the chronological order of replication is p3 before p1 before p2. E shows situations for which d2<d1<d3. Remarkably, for all d2=d30, there is significant locking. For the scenarios in E, however, the width of the 1:1 locking region is the largest; this is because the temporal order the genes’ replication during the cell cycle is the same as that of their expression in the oscillator (i.e., p2,p1,p3) (B and C). Clearly, the timing of gene replication can markedly affect locking, which means that the spatial distribution of the genes over the chromosome can be of critical importance in the interaction between the clock and the cell cycle.
Fig. S7.
Fig. S7.
The dual-feedback oscillator (51) can strongly lock to the cell cycle, and the strength of locking depends on the temporal order in which the genes are replicated during the cell cycle. The intrinsic period of the oscillator Tint=73 min. (A) Average (solid line) and SD (shaded region) of the peak-to-peak time TPtP as a function of the division time Td for a dual-feedback oscillator with initial gene copy number N=1 and all genes replicated simultaneously. The region of 1:1 locking (around Td =73 min) with the cell cycle (left dashed line) has widened considerably compared with the NTFO model (compare with Fig. 2 of the main text). (B and C) Representative time traces for the division times indicated by the arrows in A. Shown are the activator and repressor concentrations a(t) (green line) and r(t) (green line), respectively. At a cell-division time of Td=96 min (B), just outside the region where the oscillator is locked to the cell cycle, the time traces show very irregular behavior resulting in a large variance in the PtP times. At Td=2Tint (C), the oscillations switch between a small and a large amplitude in successive oscillation cycles, just as in the NTFO. (D and E) The effect of the order of gene replication during the cell cycle. For clarity, only the average peak-to-peak time as a function of Td is shown, not the SD. We assume that the activator gene is always replicated halfway through the cell cycle, da=0, and that the repressor gene is replicated with a delay dr. In both figures, the gray line gives the situation where the genes are replicated simultaneously, dr=0. Other values of dr are given in the legend and are written as a fraction of the intrinsic period Tint of the oscillator. (D) Positive dr; the repressor gene is replicated after the activator gene. (E) Negative dr; the repressor gene is replicated before the activator gene. D shows that locking decreases as dr becomes more positive, whereas E shows that the size of the 1:1 locking region depends nonmonotonically on dr for dr<0. Comparing the behavior of the dual-feedback oscillator, which exhibits the strongest entrainment when the genes are replicated simulateneously, with that of the repressilator, which shows the weakest coupling when the genes are replicated together, shows that the influence of the cell cycle on the clock depends in a nontrivial way on the architecture of the clock and on the nature of the driving signal.
Fig. S8.
Fig. S8.
The effect of allowing the total protein decay rate μtot to vary with the cell-division time Td, both for an NTFO (A) and for the TTC–(PPCZwicker) model (36) of a clock, which combines a TTC with a PPC (B; note the vertical scale is different from that in A). The blue lines correspond to the scenario in which the total degradation rate is kept constant at μtot=0.1/h (as in Figs. 2A and 4A of the main text), and the red lines to the scenario in which the total degradation rate depends on the division time as μtot=0.1h1+log(2)/Td[1/h]. When μtot depends on Td, we adjust the KaiC production rate β such that the intrinsic period of the clock remains 24 h. For both clock models and both choices of μtot, the clock tends to lock to the cell cycle. The difference between the results of the two protein-decay scenarios in the case of the NTFO can be understood by noticing that we have chosen our rates so that μtot never drops below 0.1 h1 in either case, but can become larger than this bound when it is allowed to depend on Td. The protein synthesis rate β then becomes higher than when μtot is constant. The higher synthesis and decay rate raises the amplitude of the concentration oscillations, making the clock more stable. As the inset indicates, the width of the locking region decreases with increasing μtot in a similar fashion when μtot does not depend on Td. The TTC–PPC is almost insensitive to the higher degradation and production rates.
Fig. S9.
Fig. S9.
Multiple chromosome copies reduce the effect of periodic gene replications in both the TTC–(PPCZwicker) model (36) (AC) and in the simple NTFO (DG). A shows for the TTC–PPC model the average peak-to-peak time as a function of the cell-division time Td for initial gene copy numbers N=1 (blue) and N=4 (red). Both the SD in the peak-to-peak times (given by the shaded regions) and the regions where the oscillator is locked to the cell cycle are strongly reduced for N=4. (B) The total KaiC concentration Ctot(t) (dashed line) and phosphorylation fraction p(t) (solid line) for the TTC–PPC model at Td=24.5 h, for N=4. (C) Ctot(t) and p(t) at Td=48 h for the same model, again for N=4. Note that, even at Td=24.5 h, immediately outside the locking region where the variance in TPtP is generally largest, the effects of the cell cycle have almost completely disappeared. (D) The average peak-to-peak time and its SD for the NTFO model, for N=1 (blue line) and N=4 (red line). It is seen that as in the Zwicker model, multiple chromosome copies dramatically reduce the strength of locking. (EG) NTFO time traces of the protein-concentration oscillations C(t) (blue lines) and the production density G˜(t) (red lines), both normalized to their time average values, for N=4, and for cell-division times indicated by the arrows in D. With N=4, only at, or very close to, Td=24 h (E) is the NTFO locked to the cell cycle. Even at Td=27 h (F) and Td=48 h (G), where for N=1 the NTFO shows irregular behavior and large amplitude variations, respectively (see Fig. 2 C and D), the time courses are much less perturbed by the cell cycle when N=4. However, albeit greatly reduced, the effect of driving by the cell cycle can nonetheless still be observed, both in the persistence of small regions of locking and in the still appreciable variance in TPtP when the oscillators are not locked (D). A PPC must be added to more fully attenuate the cell cycle’s influence. (Compare D with A, taking into account the difference in scale of the y axis; the SD of TPtP is about three times larger for the NTFO than for the full TTC–PPC model.)

Similar articles

Cited by

References

    1. Salter MG, Franklin KA, Whitelam GC. Gating of the rapid shade-avoidance response by the circadian clock in plants. Nature. 2003;426(6967):680–683. - PubMed
    1. Johnson CH. Circadian clocks and cell division: What’s the pacemaker? Cell Cycle. 2010;9(19):3864–3873. - PMC - PubMed
    1. Soták M, Sumová A, Pácha J. Cross-talk between the circadian clock and the cell cycle in cancer. Ann Med. 2014;46(4):221–232. - PubMed
    1. Mori T, Binder B, Johnson CH. Circadian gating of cell division in cyanobacteria growing with average doubling times of less than 24 hours. Proc Natl Acad Sci USA. 1996;93(19):10183–10188. - PMC - PubMed
    1. Matsuo T, et al. Control mechanism of the circadian clock for timing of cell division in vivo. Science. 2003;302(5643):255–259. - PubMed

Publication types

LinkOut - more resources