. 2016 Apr 12;113(15):4218-23.
doi: 10.1073/pnas.1513093113. Epub 2016 Mar 28.

GOLDEN 2-LIKE transcription factors for chloroplast development affect ozone tolerance through the regulation of stomatal movement

Affiliations

GOLDEN 2-LIKE transcription factors for chloroplast development affect ozone tolerance through the regulation of stomatal movement

Yukari Nagatoshi et al. Proc Natl Acad Sci U S A. .

Abstract

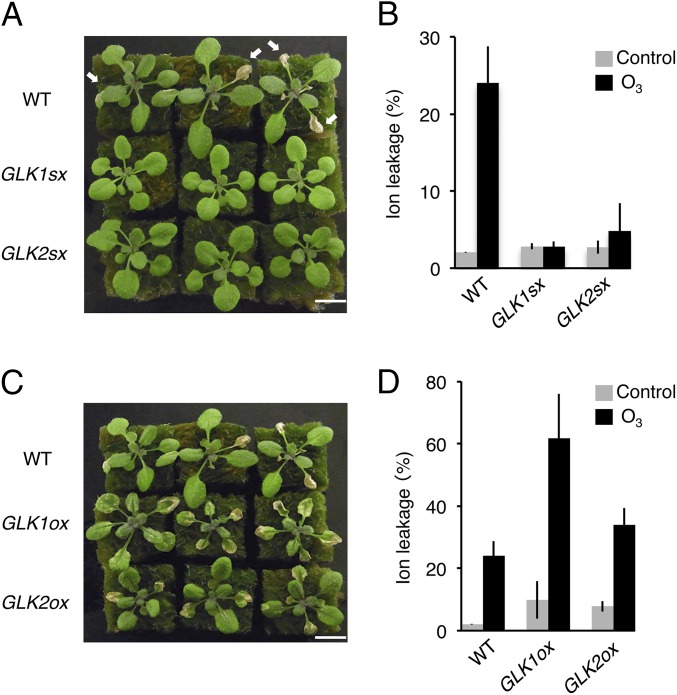
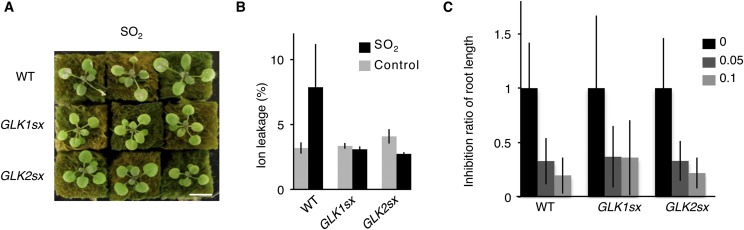
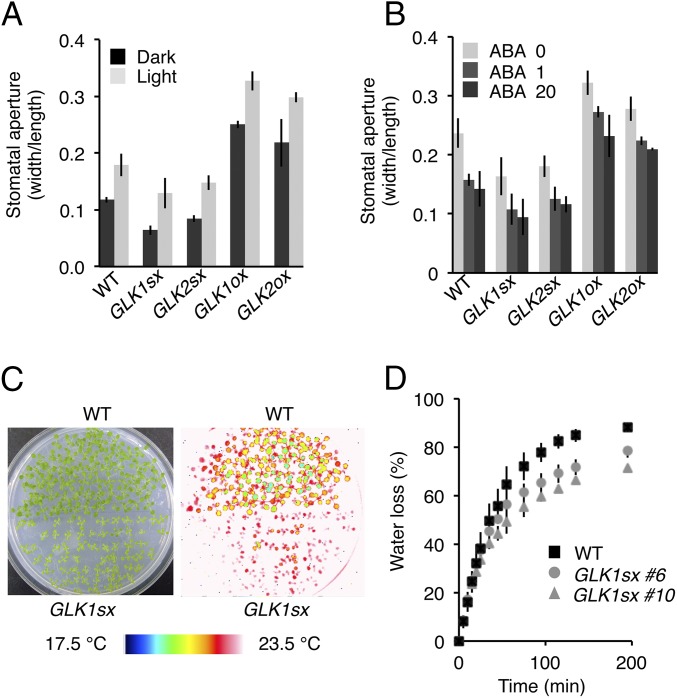
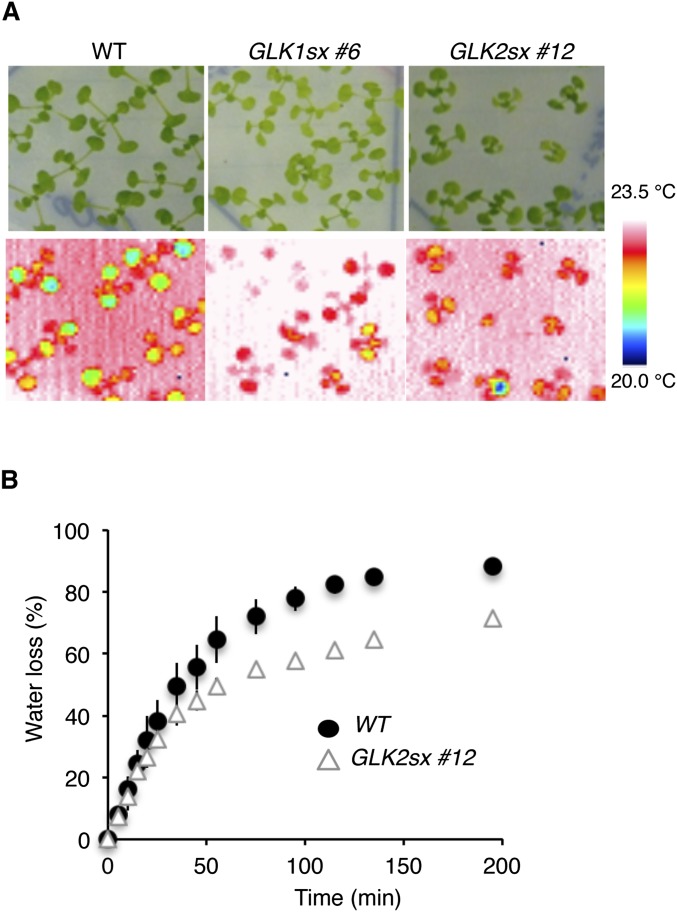
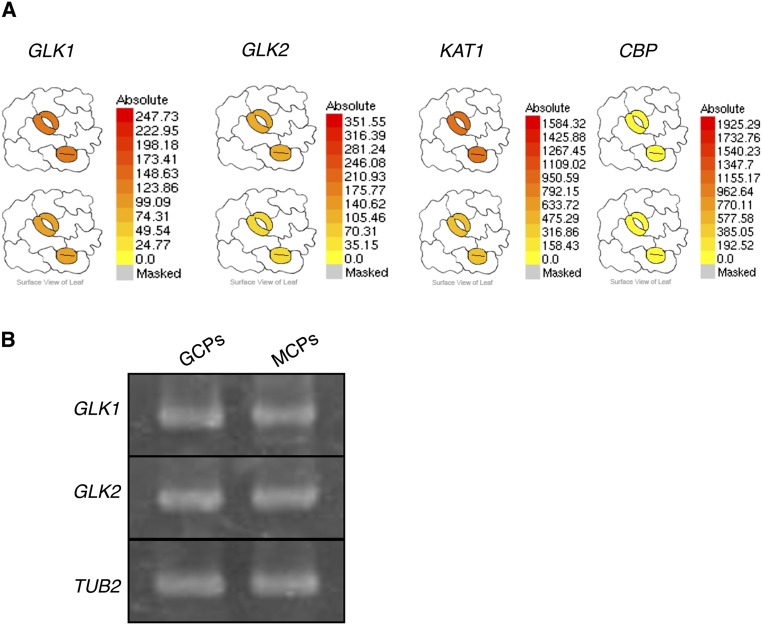
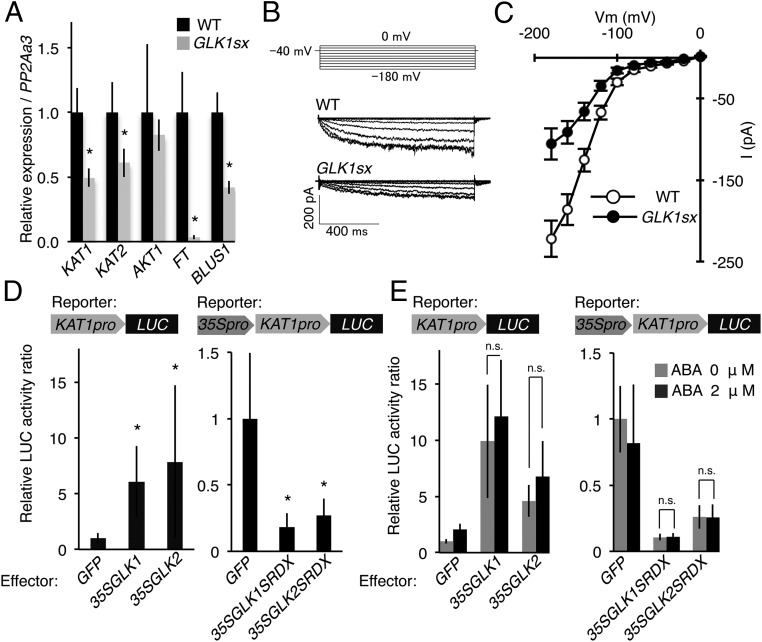
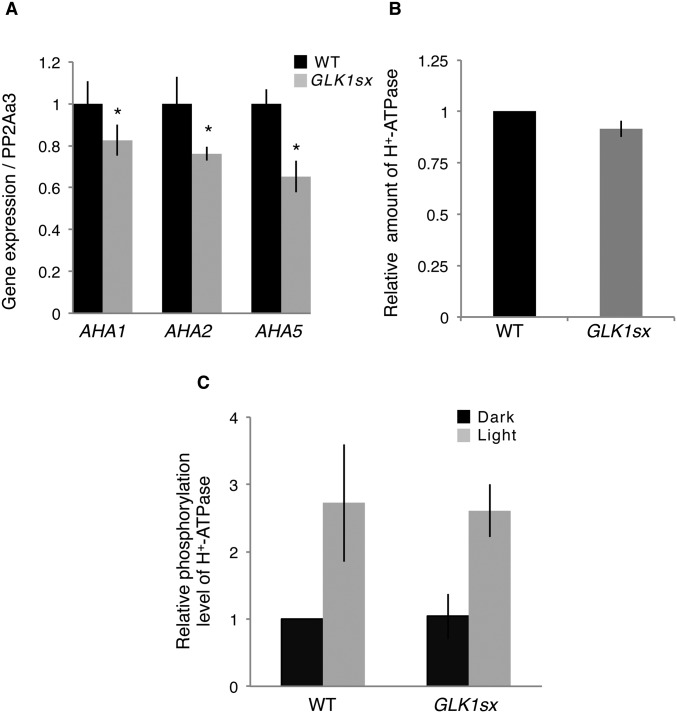
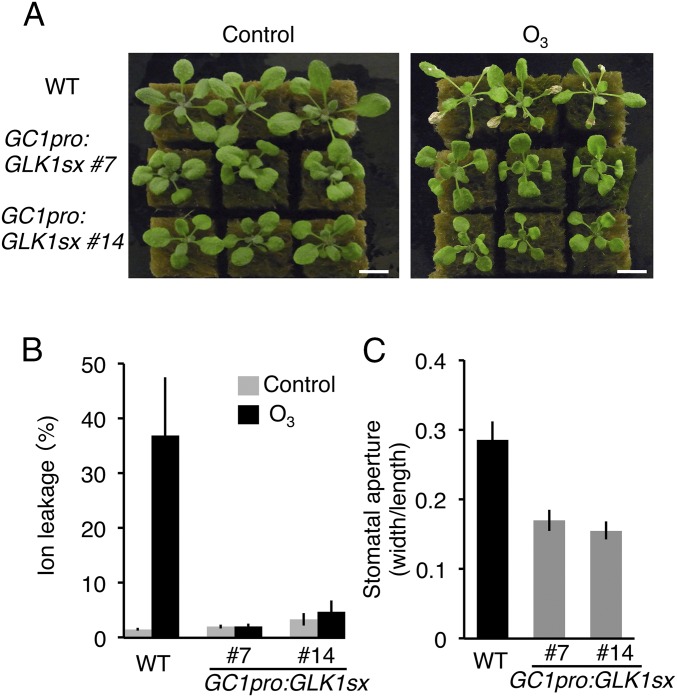
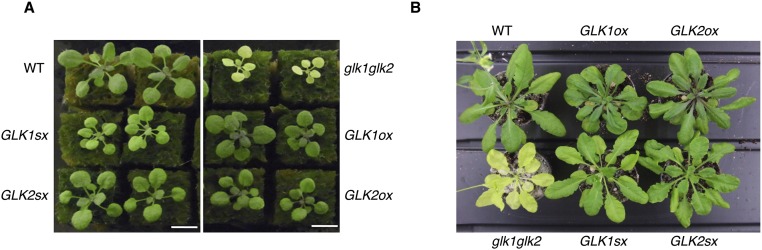
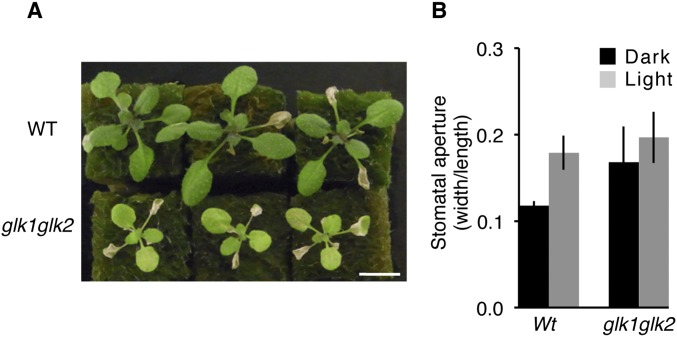
Stomatal movements regulate gas exchange, thus directly affecting the efficiency of photosynthesis and the sensitivity of plants to air pollutants such as ozone. The GARP family transcription factors GOLDEN 2-LIKE1 (GLK1) and GLK2 have known functions in chloroplast development. Here, we show that Arabidopsis thaliana (A. thaliana) plants expressing the chimeric repressors for GLK1 and -2 (GLK1/2-SRDX) exhibited a closed-stomata phenotype and strong tolerance to ozone. By contrast, plants that overexpress GLK1/2 exhibited an open-stomata phenotype and higher sensitivity to ozone. The plants expressing GLK1-SRDX had reduced expression of the genes for inwardly rectifying K(+) (K(+) in) channels and reduced K(+) in channel activity. Abscisic acid treatment did not affect the stomatal phenotype of 35S:GLK1/2-SRDX plants or the transcriptional activity for K(+) in channel gene, indicating that GLK1/2 act independently of abscisic acid signaling. Our results indicate that GLK1/2 positively regulate the expression of genes for K(+) in channels and promote stomatal opening. Because the chimeric GLK1-SRDX repressor driven by a guard cell-specific promoter induced a closed-stomata phenotype without affecting chloroplast development in mesophyll cells, modulating GLK1/2 activity may provide an effective tool to control stomatal movements and thus to confer resistance to air pollutants.

Keywords: K+in channel; ozone; repressor; stomatal movement; transcription factor.


Conflict of interest statement

The authors declare no conflict of interest.

Figures

Fig. 1.
Fig. 1.
Sensitivity to ozone of GLK1/2 transgenic Arabidopsis. (A) Rosette plants of WT and 35S:GLK1/2-SRDX (GLK1sx and GLK2sx) 1 d after exposure to 0.3 ppm O3 for 7 h. Arrows indicate the damaged leaves. (B) Ion leakage of WT and GLK1/2sx plants. The gray and black bars represent plants exposed to fresh air or O3, respectively. The average of three biological replicates (three plants per replicate) is shown. Error bars represent SD. (C) Rosette plants of WT and 35S:GLK1/2 (GLK1ox and GLK2ox) 1 d after exposure to 0.3 ppm O3 for 7 h. (D) Ion leakage of WT and GLK1/2ox plants. The gray and black bars represent plants exposed to fresh air or O3, respectively. The average of three biological replicates (three plants per replicate) is shown. Error bars represent SD.
Fig. S1.
Fig. S1.
Sensitivity to sulfur dioxide (SO2) and paraquat of WT and 35S:GLK1/2-SRDX (GLK1/2sx) plants. (A) Rosette plants of WT and GLK1sx and GLK2sx transgenic Arabidopsis 1 d after 11 h of exposure to 1.0 ppm SO2. (B) Ion leakage of WT and GLK1/2sx transgenic Arabidopsis. The gray and black bars represent plants exposed to fresh air or SO2, respectively. The average of three biological replicates (three plants per replicate) is shown. Error bars represent SD. (C) The inhibition of root elongation of WT and GLK1/2sx plants grown on MS medium containing 0, 0.05, and 0.1 µM paraquat. The average of 35–40 plants is shown. Error bars represent SD.
Fig. S2.
Fig. S2.
WT, glk mutants, and GLK1/2 transgenic plants have similar stomatal density. Stomatal density of WT, glk1 glk2 double mutants (glk1glk2), and 35S:GLK1/2-SRDX (GLK1/2sx) and 35S:GLK1/2 (GLK1/2ox) transgenic plants. The average of five replicates is shown. Error bars represent SD.
Fig. 2.
Fig. 2.
GLK1/2 control stomatal opening. (A) Stomatal aperture of epidermal fragments from the plants under dark conditions, in which plants were incubated 1 d before measurements (dark), and light conditions (light). (B) Stomatal aperture of epidermal fragments incubated with 0, 1, and 20 µM ABA under white light for 2.5 h. The average of three independent experiments is shown. Approximately 150 stomata in total (n = 3 independent experiments, 50 stomata per experiment) were analyzed in each line. Error bars represent SD. (C) Thermal images of WT (Upper) and GLK1sx (Lower) plants grown on MS medium, showing the higher temperature of GLK1sx plants. (D) Water loss in WT and GLK1sx plants for the evaluation of transpiration rate. The average of three biological replicates (five to seven plants per replicate) is shown. Error bars represent SD.
Fig. S3.
Fig. S3.
Transpiration rate of WT and 35S:GLK1/2-SRDX (GLK1/2sx) plants. (A) Thermography images of WT, GLK1sx (no. 6), and GLK2sx (no. 12) transgenic Arabidopsis grown on a same culture plate. (B) Time course of water loss ratio from detached WT and GLK2sx seedlings grown on MS medium. The average of three biological replicates (five to seven plants per replicate) is shown. Error bars represent SD.
Fig. S4.
Fig. S4.
Expression of GLK1 and GLK2 in guard cells. (A) Relative expression of GLK1 and GLK2 in guard cells displayed by Arabidopsis eFP browser (www.bar.utoronto.ca/efp/cgi-bin/efpWeb.cgi). KAT1, At5g46240, leaf guard cell marker gene; CBP, At4g33050, mesophyll cell marker gene. (B) RT-PCR analyses of GLK1 and GLK2 in guard cell protoplasts (GCP) and mesophyll cell protoplasts (MCP) from WT.
Fig. 3.
Fig. 3.
GLK1/2 regulate K+ channel genes. (A) Relative expression of KAT1, KAT2, AKT1, FT, and BLUS1 determined by qRT-PCR, using RNA extracted from guard cell-enriched epidermis. The average of four biological replicates is shown. Error bars represent SD. *P < 0.05. (B) The whole-cell inward K+ currents in response to membrane potentials by voltage protocol (Upper), stepped from a holding potential of −40 mV to pulse potentials from 0 to −180 mV in a 20-mV decrement in guard cell protoplasts of WT and GLK1sx plants. (C) Steady-state current–voltage relationship in guard cells of WT (n = 18 experiments) and GLK1sx (n = 8 experiments) plants. Error bars represent SE. (D) Relative luciferase activities after cobombardment of Arabidopsis leaves with 35S:GLK1/2 effectors and the KAT1pro:LUC reporter construct and 35S:GLK1/2-SRDX effectors and the 35S-KAT1pro:LUC reporter construct, respectively. The luciferase activity is shown as the relative ratio to the value obtained by the combination of 35S:GFP effector (control) and each reporter construct. The average of six replicates is shown. Error bars represent SD. *P < 0.05. (E) Relative luciferase activities after cobombardment of Arabidopsis protoplasts with 35S:GLK1/2 effectors and the KAT1pro:LUC reporter construct and 35S:GLK1/2-SRDX effectors and the 35S-KAT1pro:LUC reporter construct, respectively. The black and gray bars indicate samples treated with or without 2 μM ABA, respectively. All luciferase activities are shown as the relative ratio to the value obtained by the combination of 35S:GFP effector (control) and each reporter construct. The average of five replicates is shown. The relative luciferase activity of individual transient assay is shown in Table S4. Error bars represent SD. n.s., not significant (P > 0.05).
Fig. S5.
Fig. S5.
Gene expression and level of protein amount and phosphorylation of guard cell H+-ATPase. (A) Relative expression of AHA1, AHA2, and AHA5 by real-time RT-PCR, using RNA extracted from guard cell-enriched epidermis. The average of four replicates is shown. Error bars represent SD. *P < 0.05. (B) Relative amount of H+-ATPase by quantification of fluorescence images of stomata in the epidermis using anti–H+-ATPase. The average of three independent experiments is shown (n = 30). Error bars represent SD. (C) Relative phosphorylation level of H+-ATPase by quantification of fluorescence images of stomata in the epidermis using anti-pThr. The average of three independent experiments is shown (n = 30). Error bars represent SD.
Fig. 4.
Fig. 4.
Phenotype of GC1pro:GLK1-SRDX plants. (A) WT and two independent lines of GC1pro:GLK1-SRDX (GC1pro:GLK1sx) 1 d after exposure to fresh air (Left) or 0.3 ppm O3 (Right) for 7 h. (B) Ion leakage of WT and GC1pro:GLK1sx plants exposed to fresh air and 0.3 ppm O3 for 7 h. The gray and black bars represent plants exposed to fresh air or O3, respectively. The average of three biological replicates (three plants per replicate) is shown. Error bars represent SD. (C) Stomatal aperture of WT and GC1pro:GLK1sx plants. The average of three independent experiments is shown. Approximately 150 stomata in total (n = 3 independent experiments, 50 stomata per experiment) were analyzed in each line. Error bars represent SD.
Fig. S6.
Fig. S6.
Morphological phenotype of transgenic Arabidopsis expressing GLKs. Two-week-old (A) and 5-wk-old (B) WT, glk1 glk2, 35S:GLK1/2-SRDX (GLK1/2sx) and 35S:GLK1/2 (GLK1/2ox) transgenic Arabidopsis grown on rock wool (A) or soil (B).
Fig. S7.
Fig. S7.
Sensitivity to ozone of glk1 glk2 plants. (A) Rosette plants of WT and glk1 glk2 double mutants (glk1glk2) 1 d after exposure to 0.3 ppm O3 for 7 h. (B) Stomatal aperture of WT and glk1 glk2 plants grown on solid MS medium. Stomatal aperture of epidermal fragments from the plants under dark conditions, in which plants were incubated 1 d before measurements (dark), and light conditions (light). Approximately 150 stomata in total (n = 3 independent experiments, 50 stomata per experiment) were analyzed in each line. Error bars represent SD.

Similar articles

Cited by

References

    1. Pinto DM, Blande JD, Souza SR, Nerg AM, Holopainen JK. Plant volatile organic compounds (VOCs) in ozone (O3) polluted atmospheres: The ecological effects. J Chem Ecol. 2010;36(1):22–34. - PubMed
    1. Ludwikow A, Sadowski J. Gene networks in plant ozone stress response and tolerance. J Integr Plant Biol. 2008;50(10):1256–1267. - PubMed
    1. Wilkinson S, Mills G, Illidge R, Davies WJ. How is ozone pollution reducing our food supply? J Exp Bot. 2012;63(2):527–536. - PubMed
    1. Kangasjarvi J, et al. Signalling and cell death in ozone-exposed plants. Plant Cell Environ. 2005;28(8):1021–1036.
    1. Ahlfors R, et al. Arabidopsis RADICAL-INDUCED CELL DEATH1 belongs to the WWE protein-protein interaction domain protein family and modulates abscisic acid, ethylene, and methyl jasmonate responses. Plant Cell. 2004;16(7):1925–1937. - PMC - PubMed

MeSH terms