. 2016 Apr 12;113(15):4206-11.
doi: 10.1073/pnas.1514074113. Epub 2016 Mar 25.

Dopamine synapse is a neuroligin-2-mediated contact between dopaminergic presynaptic and GABAergic postsynaptic structures

Affiliations

Dopamine synapse is a neuroligin-2-mediated contact between dopaminergic presynaptic and GABAergic postsynaptic structures

Motokazu Uchigashima et al. Proc Natl Acad Sci U S A. .

Abstract

Midbrain dopamine neurons project densely to the striatum and form so-called dopamine synapses on medium spiny neurons (MSNs), principal neurons in the striatum. Because dopamine receptors are widely expressed away from dopamine synapses, it remains unclear how dopamine synapses are involved in dopaminergic transmission. Here we demonstrate that dopamine synapses are contacts formed between dopaminergic presynaptic and GABAergic postsynaptic structures. The presynaptic structure expressed tyrosine hydroxylase, vesicular monoamine transporter-2, and plasmalemmal dopamine transporter, which are essential for dopamine synthesis, vesicular filling, and recycling, but was below the detection threshold for molecules involving GABA synthesis and vesicular filling or for GABA itself. In contrast, the postsynaptic structure of dopamine synapses expressed GABAergic molecules, including postsynaptic adhesion molecule neuroligin-2, postsynaptic scaffolding molecule gephyrin, and GABAA receptor α1, without any specific clustering of dopamine receptors. Of these, neuroligin-2 promoted presynaptic differentiation in axons of midbrain dopamine neurons and striatal GABAergic neurons in culture. After neuroligin-2 knockdown in the striatum, a significant decrease of dopamine synapses coupled with a reciprocal increase of GABAergic synapses was observed on MSN dendrites. This finding suggests that neuroligin-2 controls striatal synapse formation by giving competitive advantage to heterologous dopamine synapses over conventional GABAergic synapses. Considering that MSN dendrites are preferential targets of dopamine synapses and express high levels of dopamine receptors, dopamine synapse formation may serve to increase the specificity and potency of dopaminergic modulation of striatal outputs by anchoring dopamine release sites to dopamine-sensing targets.

Keywords: dopamine synapse; medium spiny neuron; neuroligin-2; striatum.


Conflict of interest statement

The authors declare no conflict of interest.

Figures

Fig. 1.
Fig. 1.
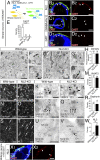
Dopaminergic presynaptic phenotype at striatal dopamine synapses. (A and B) Immunofluorescence labeling for TH (A) and DAT (B) in the striatum. Cx, cortex; NA, nucleus accumbens; St, striatum. (C) Triple immunofluorescence for TH (red), DAT (green), and VMAT2 (blue) in ultrathin (100 nm) cryosections showing their extensive overlap (arrows). (D and E) Double-label postembedding immunoelectron microscopy for GABA [Ø (diameter) = 10-nm colloidal gold particles] and VIAAT (D, Ø = 15 nm) or TH (E, Ø = 15 nm). GABA (arrows) is concentrated on VIAAT+ GABAergic terminals forming symmetric synapses (NT-GABA, red terminal), but not detected in VIAAT glutamatergic terminals forming asymmetric synapses (NT-Glu, blue) or TH+ dopaminergic terminals (NT-DA, green) forming symmetric synapses. Arrowhead pairs indicate the synaptic membrane. Dn, dendrite; NT, nerve terminal; Sp, spine. (F) The density of immunogold labeling for GABA (particles per 1 μm2) in dopaminergic (DA), GABAergic (GABA), and glutamatergic (Glu) terminals. (G and I) Double-label postembedding immunogold microscopy for TH (Ø = 15 nm) and CAST (G, Ø = 10 nm) or Nrxn (I, Ø = 10 nm). Immunogold labeling (arrows) for CAST and Nrxn is observed beneath the presynaptic membrane of TH+ dopaminergic terminals. (H and J) The mean density of immunogold particles per 1 μm of synaptic membrane for CAST (H) and Nrxn (J) at dopaminergic, GABAergic, and glutamatergic synapses in wild-type (H and J, open columns) and CAST-KO (H, filled columns) mice. In F, H, and J, numbers of terminals analyzed are indicated above each column, and error bars on columns represent SEM. *P < 0.05 (unpaired t test). [Scale bars: 1 mm (A and B), 2 μm (C), and 100 nm (D, E, G, and I).]
Fig. S1.
Fig. S1.
Presynaptic phenotype at striatal dopamine synapses is neither glutamatergic nor GABAergic. (A–F) Double immunofluorescence for DAT (green) and terminal markers (red), including VGluT1 (A), VGluT2 (B), VGluT3 (C), GAD (D), VIAAT (E), or GAT1 (F). Ultrathin (100 nm) sections were used to increase the spatial resolution of fluorescent signals. Note the lack of glutamatergic and GABAergic molecular expression in DAT+ dopaminergic terminals, except for weak immunoreactivity for GAT1 (arrows in F). (G) Triple immunofluorescence for DAT (green), GAT1 (red), and VIAAT (blue) showing much stronger expression of GAT1 in VIAAT-labeled GABAergic terminals (arrowheads) than in DAT-labeled dopaminergic terminals (arrows). (H) Superresolution immunofluorescence images for CAST (red) and DAT (green). Tiny CAST+ puncta are detected in some portions of large DAT+ dopaminergic terminals (arrows). (I–L) Double-label postembedding immunoelectron microscopy for VIAAT [Ø (diameter) = 15-nm colloidal gold particles] and CAST (I and J, Ø = 10 nm) or Nrxn (K and L, Ø = 10 nm). Immunogold labeling for CAST and Nrxn is observed beneath the presynaptic membrane at VIAAT+ symmetric or GABAergic synapses (NT-GABA, I and K) and VIAAT asymmetric or glutamatergic synapses (NT-Glu, J and L). Pairs of open and filled arrowheads indicate the synaptic membrane of symmetric and asymmetric synapses, respectively. Dn, dendrite; Sp, spine. [Scale bars: 2 μm (A–H) and 100 nm (I–L).]
Fig. 2.
Fig. 2.
Expression profiles of dopamine receptors in the striatum. (A and B) Pre-embedding immunoelectron microscopy for D1R (A) and D2R (B). D1R- and D2R-labeled spiny dendrites are colored red and green, respectively. (C) Labeling densities for D1R (Left) and D2R (Right) per 1 μm of the plasma membrane in somata (So), dendritic shafts (Dn), dendritic spines (Sp), and nerve terminals forming asymmetric (NT-asy) or symmetric (NT-sym) synapses. (D and E) Double-label pre-embedding immunoelectron microscopy for TH (DAB) and D1R (D, particles) or D2R (E, particles). Arrowhead pairs indicate dopamine synapses formed by TH-labeled dopaminergic terminals (NT-DA). (F) The synaptic (black), perisynaptic (dark gray), and extrasynaptic (light gray) membranes of dendrites around dopamine synapses. (G) Densities for D1R (Left, 18 synapses) and D2R (Right, 16 synapses) labelings per 1 µm of the synaptic, perisynaptic, and extrasynaptic membranes. The length of the plasma membrane (μm) and the number of metal particles analyzed are indicated in parentheses or above each column, respectively. Error bars represent SEM. *P < 0.05 and **P < 0.01 (unpaired t test). (Scale bars, 200 nm.)
Fig. S2.
Fig. S2.
Expression of D1R and D2R in striatal MSNs. (A) Fluorescent in situ hybridization for D1R (red) and D2R (green) mRNAs and nuclear counterstaining with TOTO-3 (blue). (B) Double immunofluorescence for D1R (red) and D2R (green). Cell bodies and neuropils are labeled for D1R (D1) and D2R (D2) in a segregated manner. (C–F) Quadruple immunofluorescence for D1R (red), D2R (green), MAP2 (white), and neuronal markers (blue), including DARPP32 (C), PV (D), nNOS (E), and CHT (F). In MAP2-labeled dendrites (arrowheads), DARPP32+ MSNs express either D1R or D2R at high levels (C), whereas various interneurons are low or negative in expression of dopamine receptors (D–F). (G) Triple immunofluorescence for D1R (red), tau (white), and DARPP32 (blue) showing weak expression of D1R in tau-labeled axons of DARPP32+ MSNs (arrowheads). (H and I) Triple immunofluorescence for D2R (green), tau (white), and CHT (H, blue) or DAT (I, blue) showing moderate expression of D2R in tau-labeled axons of CHT+ cholinergic (H, arrowheads) and DAT+ dopaminergic axons (I, arrowheads). (J and K) Double-label postembedding immunoelectron microscopy for TH [Ø (diameter) = 15-nm colloidal gold particles] and D1R (J, Ø = 10 nm) or D2R (K, Ø = 10 nm) showing predominant extrasynaptic and perisynaptic labeling (arrows) of dendrites (Dn) forming symmetric synapses (open arrowhead pairs) with TH+ dopaminergic terminals (NT-DA). Tissue specimens were mildly fixed with 0.2% picric acid/2% paraformaldehyde to increase the sensitivity of dopamine receptor detection. (L and M) Densities (mean ± SEM; n =3 mice for each) for D1R (L, 55 synapses) and D2R (M, 60 synapses) labelings per 1 µm of the synaptic, perisynaptic, and extrasynaptic membranes. The length of the plasma membrane (μm, in parentheses) and the number of metal particles analyzed are indicated above each column. *P < 0.05 (unpaired t test). [Scale bars: 20 μm (A and B), 2 μm (C–I), and 100 nm (J and K).]
Fig. 3.
Fig. 3.
GABAergic postsynaptic phenotype at striatal dopamine synapses. (A–C) Triple immunofluorescence for DAT (green) and VIAAT (blue), and for GABAARα1 (A, red), gephyrin (B, red), or NL2 (C, red). Note close apposition of GABAARα1, gephyrin, and NL2 clusters to both VIAAT+ GABAergic terminals (arrowheads) and DAT+ dopaminergic terminals (arrows). (D–F) Double-label postembedding immunoelectron microscopy for TH [Ø (diameter) = 15 nm] and for GABAARα1 (D, Ø = 10-nm colloidal gold particles), gephyrin (E, Ø = 10 nm), or NL2 (F, Ø = 10 nm). Immunogold particles (arrows) are concentrated at symmetric synapses formed by TH-labeled dopaminergic terminals (NT-DA, arrowhead pairs). (G–I) The density of immunogold labeling for GABAARα1 (G), gephyrin (H), or NL2 (I) per 1 μm of synaptic membrane at dopamine (DA), GABAergic (GABA), and glutamatergic (Glu) synapses. The specificity of NL2 labeling is confirmed by almost blank labeling in NL2-KO mice (I). Representative images of GABAergic synapses are shown in Fig. S3. Numbers of synapses analyzed are indicated above each column. Error bars represent SEM. *P < 0.05 and ***P < 0.001 (unpaired t test). [Scale bars: 2 μm (A–C) and 100 nm (D–F).]
Fig. S3.
Fig. S3.
Expression of GABAergic, but not glutamatergic, postsynaptic proteins at dopamine synapses. (A–C) Double-label postembedding immunoelectron microscopy for GABAARα1 [A, Ø (diameter) = 10-nm colloidal gold particles], gephyrin (B, Ø = 10 nm), or NL2 (C, Ø = 10 nm), and for VIAAT (Ø = 15 nm). Immunogold particles for GABAARα1, gephyrin, or NL2 (arrows) are concentrated at symmetric synapses formed by VIAAT-labeled GABAergic terminals (NT-GABA, open arrowhead pairs). (D and E) Double-label postembedding immunoelectron microscopy for TH (Ø = 15-nm colloidal gold particles) and PSD-95 (D, Ø = 10 nm), or AMPA receptor (AMPAR; E, Ø = 10 nm) in the striatum. Immunogold particles for PSD-95 and AMPAR (arrows) are found on the postsynaptic membrane at TH asymmetric synapses on dendritic spines (glutamatergic, filled arrowhead pairs), but not at TH+ symmetric synapses (dopamine, open arrowhead pairs). Dn, dendrite; NT-DA, dopaminergic nerve terminal; NT-Glu, glutamatergic nerve terminal; Sp, spine. (F and G) The density (mean ± SEM; 3 mice for each) of immunogold labeling for PSD-95 (F) or AMPAR (G) per 1 µm of the synaptic membrane at dopamine (DA), GABAergic (GABA), and glutamatergic (Glu) synapses. The numbers of total synapses analyzed are indicated above each column. *P < 0.05, ***P < 0.001 (unpaired t test). (Scale bars, 100 nm.)
Fig. 4.
Fig. 4.
Dopamine synapses are preferentially formed on to dendrites of two types of MSNs. (A) Schematic to distinguish NL2-clustered dopamine and non-dopamine synapses on GFP-labeled dendrites of striatal neurons. (B and C) Quadruple immunofluorescence for NL2 (red), GFP (green), and TH (blue), and for D1R (B, white) or A2AR (C, white). NL2-clustered dopamine synapses (arrows) are preferentially distributed on dendrites of D1R-labeled d-MSNs (B) and A2AR-labeled i-MSNs (C). (D and E) The density of NL2-clustered dopamine (D) and non-dopamine (E) synapses per 10 μm of dendritic shafts (Dn) and spines (Sp) in d-MSNs and i-MSNs, and dendrites of striatal interneurons. Immunofluorescence images for striatal interneurons are shown in Fig. S4. The number of dendrites analyzed is indicated above each column. Error bars represent SEM. *P < 0.05 and ***P < 0.001 (one-way ANOVA with Tukey’s post hoc test). (Scale bars, 2 μm.)
Fig. S4.
Fig. S4.
Dopamine synapses are sparse on dendrites of striatal interneurons. (A and B) Lentiviral GFP labeling of striatal neurons at low (A) and high magnifications (B, single striatal neuron). Cx, cortex; NA, nucleus accumbens; St, striatum. (C–E) Quadruple immunofluorescence for NL2 (red), GFP (green), TH (blue), and interneuron markers (white), including PV (C), nNOS (D), and CHT (E). Note that NL2 clusters on GFP-labeled interneuron dendrites (white arrowheads) rarely appose TH+ dopaminergic terminals. [Scale bars: 100 μm (A), 10 μm (B), and 2 µm (C–E).]
Fig. 5.
Fig. 5.
NL2-mediated presynaptic differentiation of dopaminergic axons in vitro. (A) Schematic of coculture assay of midbrain neurons with HEK293T cells expressing NL2, GABAARα1, or GFP. Axons of midbrain dopamine neurons were identified by DAT immunofluorescence. (B–D) Triple immunofluorescence for CAST (red) and DAT (green), and for NL2 (B, blue), GABAARα1 (C, blue) or GFP (D, blue). CAST clusters are recruited to contact sites of dopaminergic axons with HEK293T cells expressing NL2 (B, arrowheads), but not GABAARα1 (C) or GFP (D). (E) The density of CAST clusters per 100 μm of dopaminergic axon in contact with HEK293T cells. The number of HEK293T cells contacted by DAT-labeled dopaminergic axons is indicated above each column. Error bars represent SEM. ***P < 0.001 (Mann–Whitney u test). (F and G) Triple immunofluorescence for VMAT2 (F, red) or Nrxn (G, red), DAT (green), and NL2 (blue) in cocultures of midbrain dopamine neurons and HEK293T cells expressing NL2. (Scale bars, 2 μm.)
Fig. S5.
Fig. S5.
NL2-mediated presynaptic differentiation of GABAergic axons in vitro (A–E), unaffected dopamine synapse formation and compensatory NL3 up-regulation in the striatum of NL2-KO mice (F–W), and NL3-mediated presynaptic differentiation of dopaminergic axons in vitro (X). (A) A schematic illustration of coculture assay of striatal neurons with HEK293T cells transiently expressing NL2, GABAARα1, or GFP. Because striatal neurons are exclusively GABAergic, tau+ axons were discerned as GABAergic axons in this experiment. (B–D) Triple immunofluorescence for CAST (red) and DAT (green), and for NL2 (B, blue), GABAARα1 (C, blue) or GFP (D, blue). CAST clusters are recruited to contact sites (arrowheads) of striatal GABAergic axons with HEK293T cells expressing NL2 (B), but not GABAARα1 (C) or GFP (D). (E) The density of CAST clusters per 100 µm of striatal GABAergic axons in contact with HEK293T cells. The number of HEK293T cells contacted by tau-labeled striatal GABAergic axons analyzed is indicated above each column. ***P < 0.001 (one-way ANOVA with Tukey's post hoc test). (F and G) Pre-embedding immunoelectron microscopy for DAT in wild-type (F) and NL2-KO (G) mice. DAT+ dopamine synapses in the boxed areas of F or G are enlarged in F′ and F′′ or G′ and G′′, respectively. Open arrowhead pairs indicate symmetric contacts at DAT+ dopamine synapses. (H) Nearest-neighbor distances (µm) between dopamine synapses in wild-type (open column) and NL2-KO (filled column) mice. (IW) Immunofluorescence and immunogold labeling for VMAT2 (IM), gephyrin (NR), and NL3 (SW) in the striatum of wild-type (I, K, N, P, S, and U) and NL2-KO (J, L, O, Q, T, and V) mice. Pre-embedding immunoelectron microscopy was applied for VMAT2 (K and L), whereas double-label postembedding immunoelectron microscopy was used for TH [Ø (diameter) = 15-nm colloidal gold particles; P, Q, U, and V] and gephyrin (Ø = 10 nm; P and Q) or NL3 (Ø = 10 nm; U and V). Bar graphs show the densities (mean ± SEM; n = 3 mice for each) of VMAT2 labeling (M) per 1 µm2 of dopaminergic terminals and of gephyrin (R) or NL3 (W) labeling per 1 µm of dopamine synapses in wild-type (open columns) and NL2-KO (filled columns) mice. Note that immunofluorescence intensity of NL3 in wild-type mice is low to moderate (S), whereas that in NL2-KO mice is elevated in some clusters (T, arrows). Open arrowhead pairs indicate symmetric contacts at dopamine synapses. Dn, dendrite; NT-DA, dopaminergic nerve terminal. The numbers of total synapses analyzed are indicated above each column (H, M, R, and W). *P < 0.05 (unpaired t test). Error bars represent SEM. (X) Triple immunofluorescence for CAST (red), DAT (green), and NL3 (blue) in cocultures of midbrain dopamine neurons with HEK293T cells expressing NL3. Note NL3 expressed in HEK293T cells induces CAST clustering at contact sites with DAT-labeled dopaminergic axons (arrowheads). [Scale bars: 2 µm (B–D, I, J, N, O, S, T, and X), 1 µm (F and G), 200 nm (F′, F′′, G′, and G′′), and 100 nm (K, L, P, Q, U, and V).]
Fig. S6.
Fig. S6.
Lentivirus-mediated sparse knockdown of NL2 in the striatum in vivo. (A) Immunoblot for NL2- KD efficiency and specificity in HEK293T cells expressing NL1, NL2, and NL3. (B) Lentiviral vectors (LV) were injected into the striatum at birth, and analysis was conducted at 2 mo of age. (C) Double immunofluorescence for GFP and DARPP32 in the adult striatum. Most of GFP-labeled neurons are DARPP32+ MSNs (arrows). (D–F and J–L) Triple immunofluorescence for NL2 (D–F, gray) or NL3 (J–L, gray), gephyrin (red), and GFP (green) in spiny dendrites of control (D and J), NL2-KD#1 (E and K), or NL2-KD#2 (F and L) neurons. White and yellow arrowheads indicate gephyrin clusters on infected (GFP-labeled) and noninfected (GFP-unlabeled) dendrites, respectively. (G–I and M) The density of gephyrin clusters per 10 µm of control and KD dendrites (G), and fluorescence intensity (arbitrary units) of gephyrin (H), NL2 (I), and NL3 (M) clusters. Total numbers of dendrites (G) or gephyrin clusters (H, I, and M) analyzed are indicated above each column. Error bars represent SEM. ***P < 0.001 (Mann–Whitney u test). [Scale bars: 20 μm (C) and 2 µm (D–F and J–L).]
Fig. 6.
Fig. 6.
Decrease of dopamine synapses and reciprocal increase of GABAergic synapses after sparse NL2 knockdown in striatal MSNs. (AC) Quadruple immunofluorescence for gephyrin (red), GFP (green), TH (blue), and VIAAT (gray) in spiny dendrites of control (A), NL2-KD#1 (B), or NL2-KD#2 (C) neurons. Arrows and arrowheads indicate dopamine and GABAergic synapses, respectively, on GFP-labeled dendrites. (D and E) The density of dopamine (D) and GABAergic (E) synapses per 10 µm of control and KD dendrites. The total number of dendrites analyzed is indicated above each column. Error bars represent SEM. *P < 0.05, **P < 0.01, and ***P < 0.001 (Mann–Whitney u test). (Scale bars, 2 μm.)
Fig. S7.
Fig. S7.
Specificity of primary antibodies used in the present study. (A–C) VMAT2, GAD, and VIAAT antibodies. Patterns of immunofluorescence labeling for VMAT2 (A), GAD (B), and VIAAT (C) are shown in coronal sections through the striatum. (D–F) CAST antibody. Specific detection of CAST band at 130 kDa in immunoblot (D) and specific immunofluorescence-labeling of CAST (red) in synaptophysin-labeled nerve terminals (green) (E and F) are shown in brain tissues from wild-type mice, but not CAST-KO mice. (G and H) Nrxn1α antibody. Because of high sequence homology in the C terminus of Nrxn1α–3α (G), immunoblot detects 120- to 150-kDa bands in brain homogenates and HEK293T cell lysates transfected with Nrxn1α, -2α, and -3α (H). (I–L) D1R and D2R antibodies. Note the lack of immunofluorescence signals for D1R and D2R in brains of D1R-KO and D2R-KO mice, respectively. (M–Q) DARPP32 antibody. Immunoblot detects a 32-kDa band in both brain homogenates and HEK293T cell lysates expressing DARPP32 (M). Note similar patterns of labeling by fluorescent in situ hybridization for DARPP32 mRNA (N) and immunohistochemistry for DARPP32 (O) in parasagittal brain sections. Double immunofluorescence for DARPP32 (P and Q, red) and PV (P, green) or CHT (Q, green) shows the lack of DARPP32 labeling in PV- and CHT-expressing interneurons (asterisks). (RT) NL1, NL2, and NL3 antibodies. Immunoblot with NL1 (Upper), NL2 (Middle), and NL3 (Bottom) antibodies selectively detects 100–150-kDa protein bands in brain homogenates and HEK293T cell lysates expressing NL1–4 (R). Double immunofluorescence shows that NL2 (green) overlaps well with gephyrin (red) in the striatum (S). Triple immunofluorescence for NL2 (green), NL3 (red), and DAT (blue) shows that NL3 is expressed at both NL2+/DAT- synapses (yellow arrows) and NL2+/DAT+ dopamine synapses (white arrows) (T). Cb, cerebellum; Cx, cortex; Hi, hippocampus; MO, medulla oblongata; NA, nucleus accumbens; St, striatum; Th, thalamus. [Scale bars: 1 mm (A–C, I–L, N, and O), 20 μm (P and Q), and 2 μm (E, F, S, and T).]

Similar articles

Cited by

References

    1. Gray EG. Axo-somatic and axo-dendritic synapses of the cerebral cortex: An electron microscope study. J Anat. 1959;93:420–433. - PMC - PubMed
    1. Kuzirian MS, Paradis S. Emerging themes in GABAergic synapse development. Prog Neurobiol. 2011;95(1):68–87. - PMC - PubMed
    1. Lardi-Studler B, Fritschy JM. Matching of pre- and postsynaptic specializations during synaptogenesis. Neuroscientist. 2007;13(2):115–126. - PubMed
    1. Spitzer NC, Borodinsky LN. Implications of activity-dependent neurotransmitter-receptor matching. Philos Trans R Soc Lond B Biol Sci. 2008;363(1495):1393–1399. - PMC - PubMed
    1. Williams ME, de Wit J, Ghosh A. Molecular mechanisms of synaptic specificity in developing neural circuits. Neuron. 2010;68(1):9–18. - PMC - PubMed

Publication types