. 2016 Apr 19;113(16):4488-93.
doi: 10.1073/pnas.1518587113. Epub 2016 Mar 28.

Transmission dynamics of Ebola virus disease and intervention effectiveness in Sierra Leone

Affiliations

Transmission dynamics of Ebola virus disease and intervention effectiveness in Sierra Leone

Li-Qun Fang et al. Proc Natl Acad Sci U S A. .

Abstract

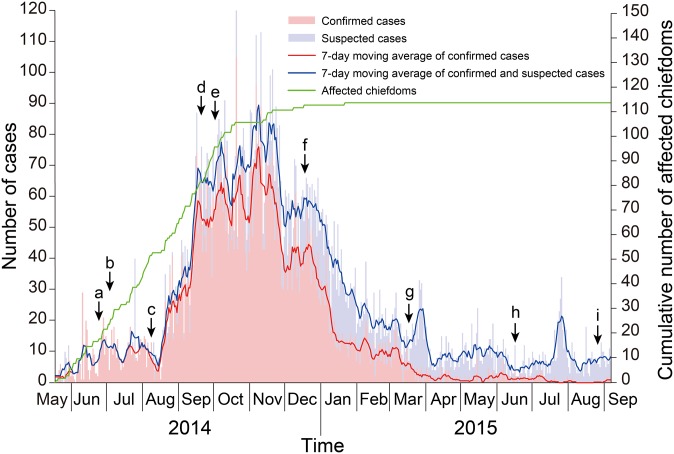
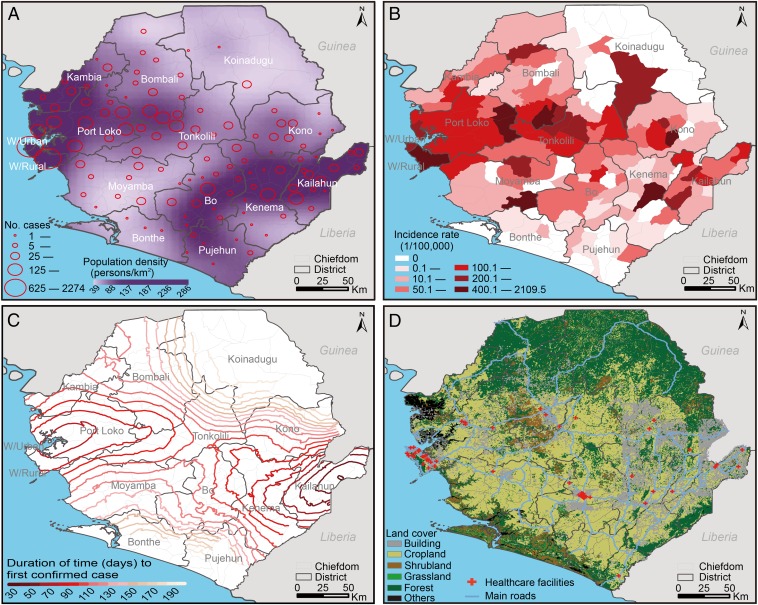
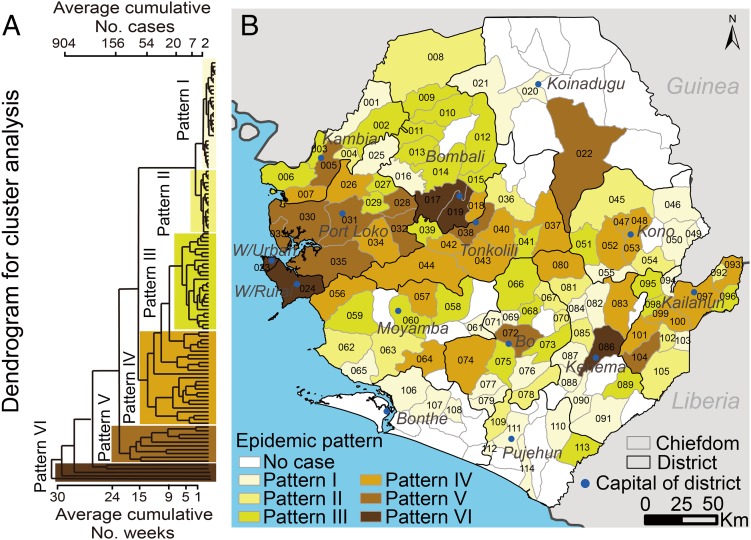
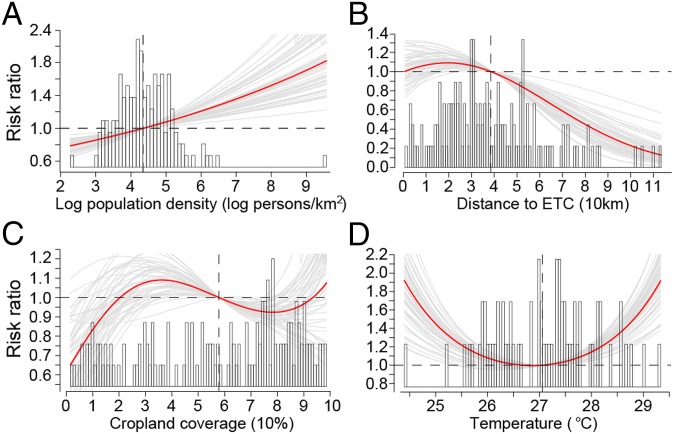
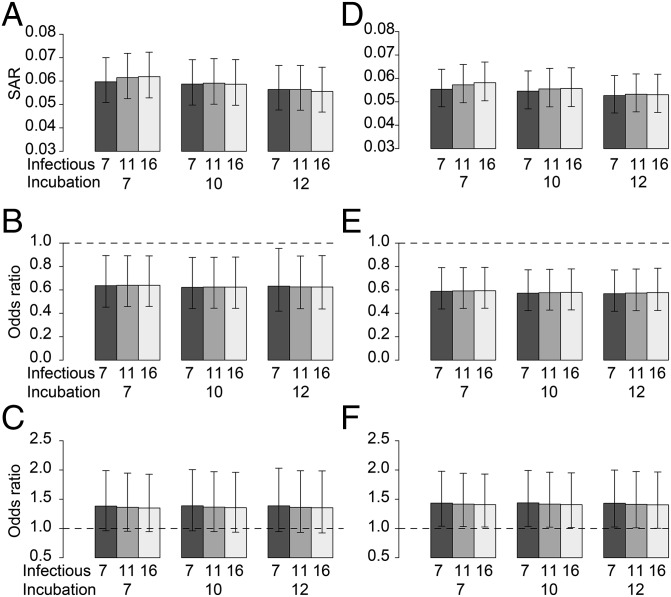
Sierra Leone is the most severely affected country by an unprecedented outbreak of Ebola virus disease (EVD) in West Africa. Although successfully contained, the transmission dynamics of EVD and the impact of interventions in the country remain unclear. We established a database of confirmed and suspected EVD cases from May 2014 to September 2015 in Sierra Leone and mapped the spatiotemporal distribution of cases at the chiefdom level. A Poisson transmission model revealed that the transmissibility at the chiefdom level, estimated as the average number of secondary infections caused by a patient per week, was reduced by 43% [95% confidence interval (CI): 30%, 52%] after October 2014, when the strategic plan of the United Nations Mission for Emergency Ebola Response was initiated, and by 65% (95% CI: 57%, 71%) after the end of December 2014, when 100% case isolation and safe burials were essentially achieved, both compared with before October 2014. Population density, proximity to Ebola treatment centers, cropland coverage, and atmospheric temperature were associated with EVD transmission. The household secondary attack rate (SAR) was estimated to be 0.059 (95% CI: 0.050, 0.070) for the overall outbreak. The household SAR was reduced by 82%, from 0.093 to 0.017, after the nationwide campaign to achieve 100% case isolation and safe burials had been conducted. This study provides a complete overview of the transmission dynamics of the 2014-2015 EVD outbreak in Sierra Leone at both chiefdom and household levels. The interventions implemented in Sierra Leone seem effective in containing the epidemic, particularly in interrupting household transmission.

Keywords: Ebola virus disease; household transmission; intervention effectiveness; secondary attack rate; spatiotemporal modeling.


Conflict of interest statement

The authors declare no conflict of interest.

Figures

Fig. 1.
Fig. 1.
The epidemic curves of Ebola virus disease (EVD) based on the dates of symptom onset for confirmed and suspected cases in Sierra Leone from May 2014 to September 2015. The dates of key events in relation to interventions of EVD in Sierra Leone are indicated by black arrows: (arrow a) Opening of the first Ebola treatment center in Kenema District on 24 June 2014; (arrow b) establishment of the first diagnostic laboratory in Kenema District on 2 July 2014; (arrow c) declaration of the national state of emergency on 6 August 2014; (arrow d) a 3-d nationwide quarantine from 19 to 21 September 2014; (arrow e) initiation of the United Nations Mission for Emergency Ebola Response strategic plan on 1 October 2014; (arrow f) operation of “Western Area Surge” on 17 December 2014; (arrow g) initiation of a 1-mo “Zero-Ebola” campaign in mid-March of 2015; (arrow h) beginning of “Operation Northern Push” on 16 June 2015; and (arrow i) initiation of ring vaccination in late August of 2015.
Fig. 2.
Fig. 2.
The spatial distribution and spread trend of Ebola virus disease (EVD) in Sierra Leone from May 2014 to September 2015. (A) Total number of confirmed cases in each chiefdom with the background of population density. (B) Cumulative incidence rate of confirmed cases in each chiefdom. (C) The spatial trend contour of EVD spread in Sierra Leone. The EVD spread from areas in dark red to areas in light red, and a wider gap between contours indicates a quicker diffusion velocity. (D) A land cover map of Sierra Leone overlapped with the major transportation network and healthcare facilities.
Fig. 3.
Fig. 3.
Chiefdom-level epidemic patterns of Ebola virus disease in Sierra Leone. (A) Dendrogram based on the clustering analysis, classifying chiefdom-level epidemics into six patterns. (B) Map showing the spatial distribution of the epidemic pattern of each affected chiefdom. The identification number of each affected chiefdom is indicated in the map. The identification number of each chiefdom is listed in SI Appendix, Table S11.
Fig. 4.
Fig. 4.
Association between estimated risk ratios (RRs) and socioenvironmental factors. The RRs are estimated based on the Poisson transmission model and are plotted as a function of (A) population density, (B) distance to the nearest Ebola treatment center (ETC), (C) cropland coverage, and (D) weekly average atmospheric temperature. Estimated RR curves are in red. Uncertainty is shown by estimated curves (in gray) based on 50 (randomly selected from 1,000) bootstrap samples of the dataset. The histograms represent the distribution of the socioenvironmental factors. The cross points of horizontal and vertical dash lines indicate the mean values of the socioenvironmental factors at which the RR is 1.
Fig. 5.
Fig. 5.
Estimates for household secondary attack rate (A and D) and effects of gender (B and E, odds ratio between males and females) and age group (C and F, odds ratio between children and adults) on susceptibility, stratified by mean durations of the incubation and infectious periods. The estimation was also stratified by either confirmed cases (A–C) or clinical cases (with symptoms but not necessarily confirmed) (D–F). Presented in A and D are estimates for the overall secondary attack rate without adjusting for age, gender, or epidemic phase.

References

    1. World Health Organization 2015 Ebola Situation Reports. Available at www.who.int/csr/disease/ebola/situation-reports/archive/en. Accessed 30 January 2016.
    1. Gire SK, et al. Genomic surveillance elucidates Ebola virus origin and transmission during the 2014 outbreak. Science. 2014;345(6202):1369–1372. - PMC - PubMed
    1. Schieffelin JS, et al. KGH Lassa Fever Program Viral Hemorrhagic Fever Consortium WHO Clinical Response Team Clinical illness and outcomes in patients with Ebola in Sierra Leone. N Engl J Med. 2014;371(22):2092–2100. - PMC - PubMed
    1. Sierra Leone to impose three-day quarantine in effort to contain Ebola outbreak. Available at www.opposingviews.com/i/health/sierra-leone-impose-three-day-quarantine-.... Accessed 30 January 2016.
    1. Ban K. 2015 Letter dated 12 January 2015 from the Secretary-General addressed to the President of the General Assembly (A/69/720). Available at reliefweb.int/sites/reliefweb.int/files/resources/N1501016.pdf. Accessed 30 January 2016.

Publication types

LinkOut - more resources