. 2016 Apr 12;113(15):4194-9.
doi: 10.1073/pnas.1522459113. Epub 2016 Mar 28.

Heterodimerization within the TREK channel subfamily produces a diverse family of highly regulated potassium channels

Affiliations

Heterodimerization within the TREK channel subfamily produces a diverse family of highly regulated potassium channels

Joshua Levitz et al. Proc Natl Acad Sci U S A. .

Abstract

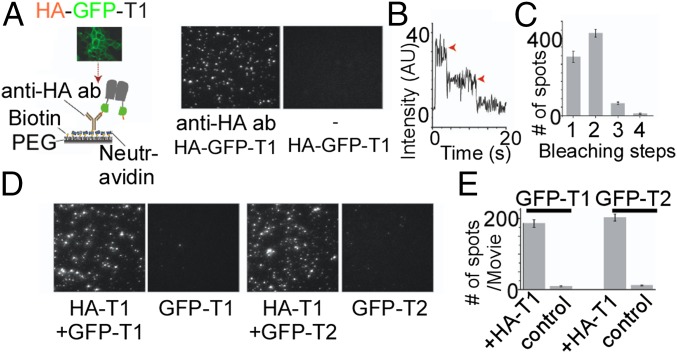
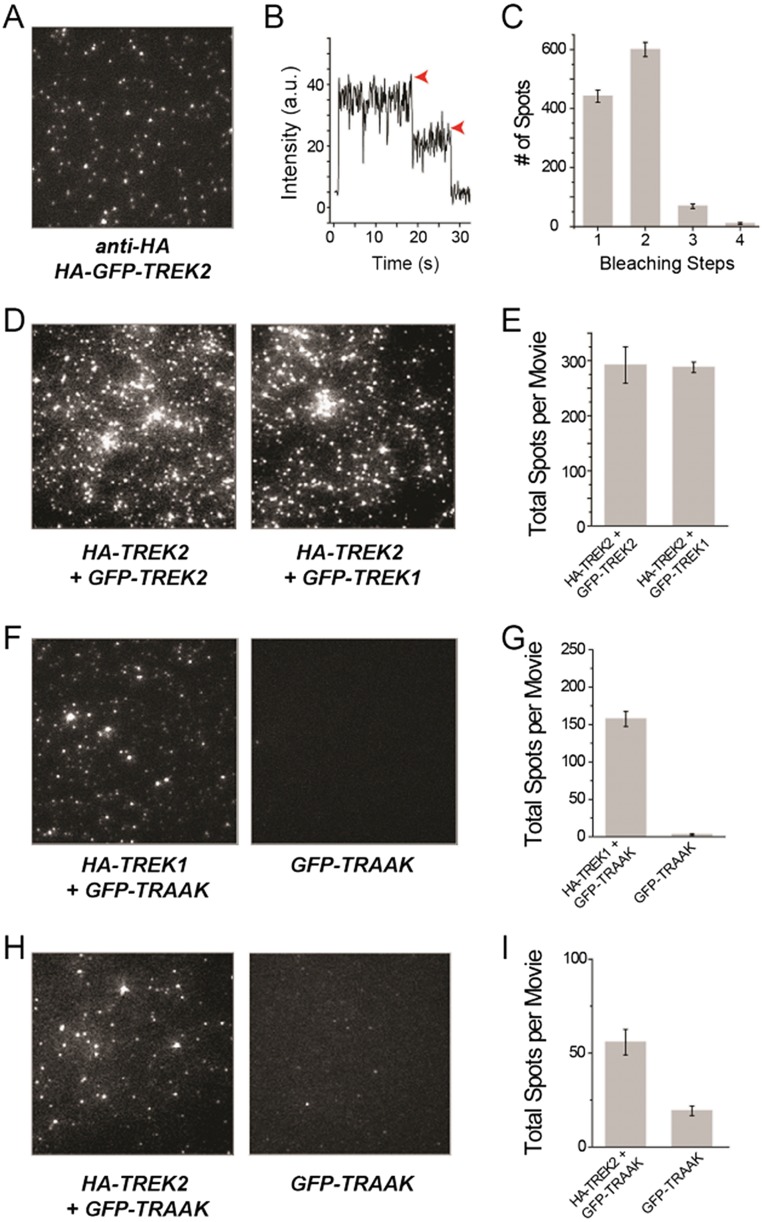
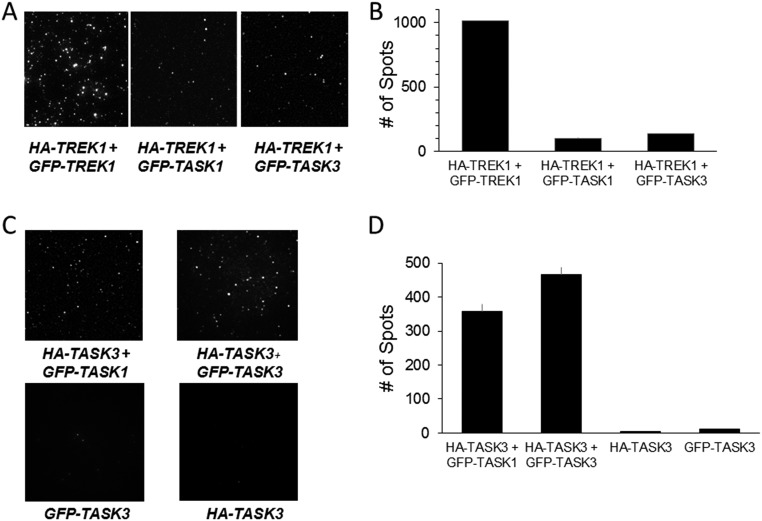
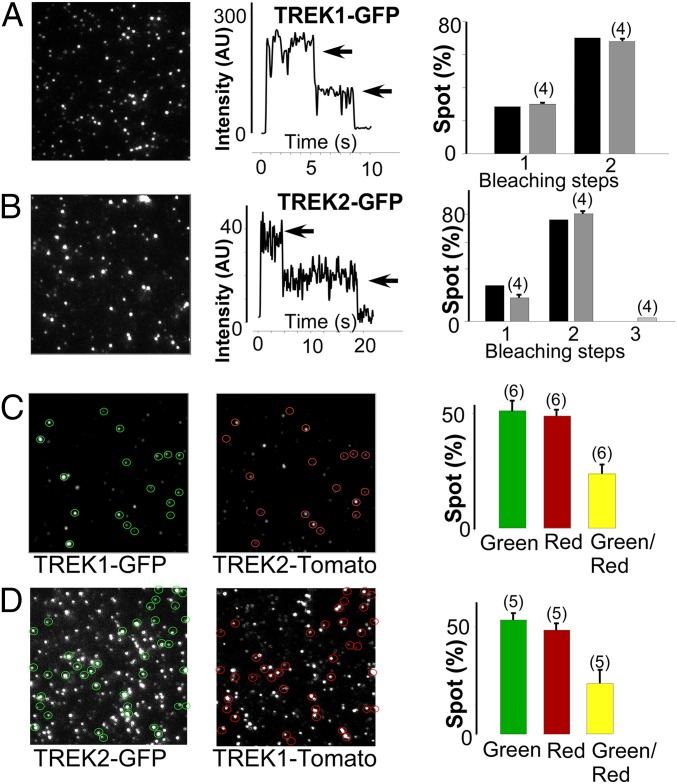
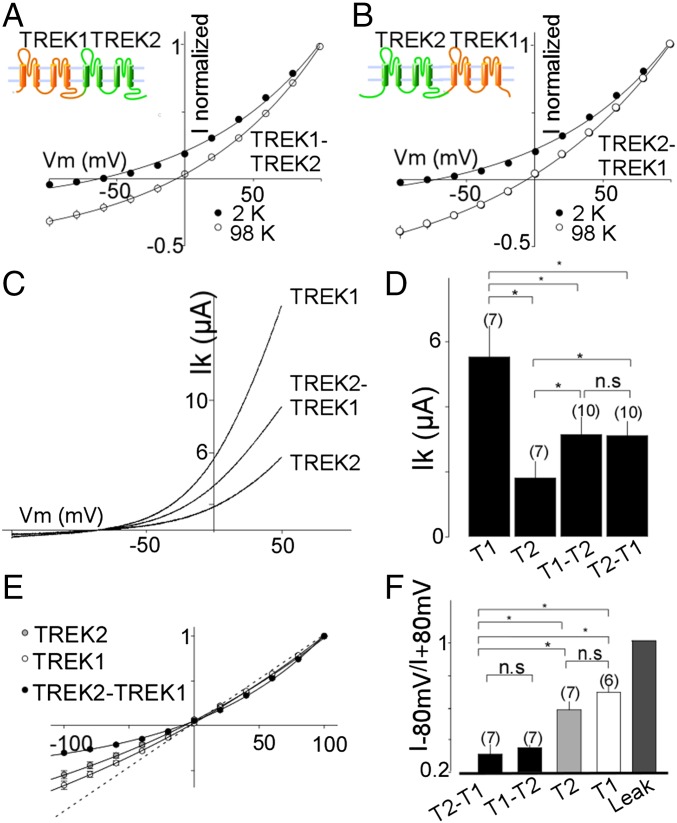
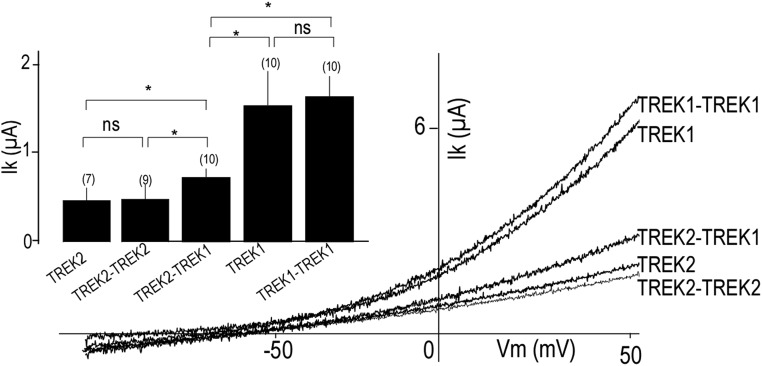
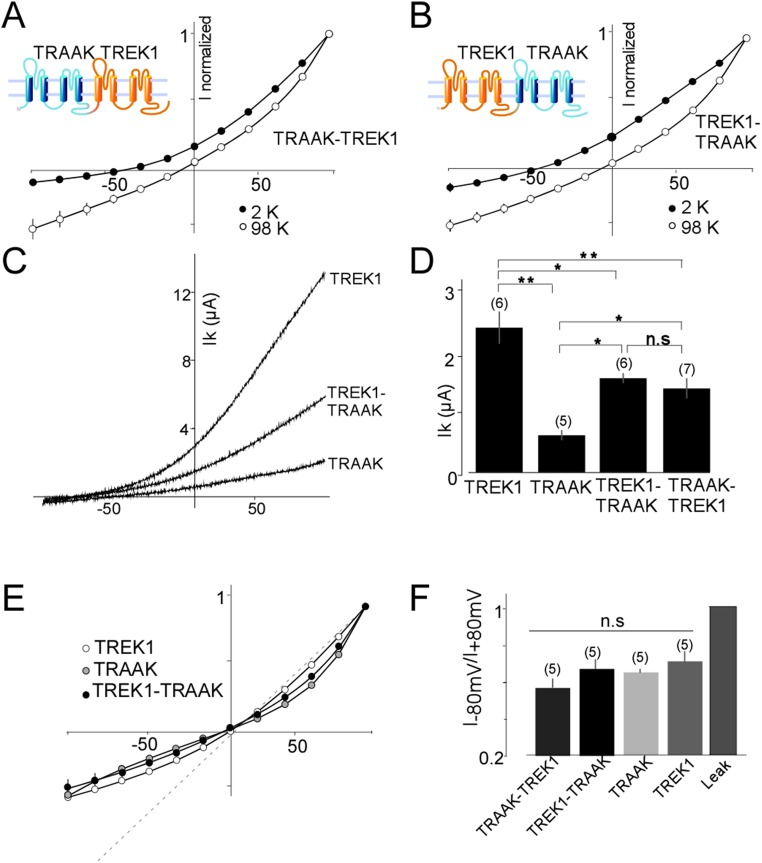
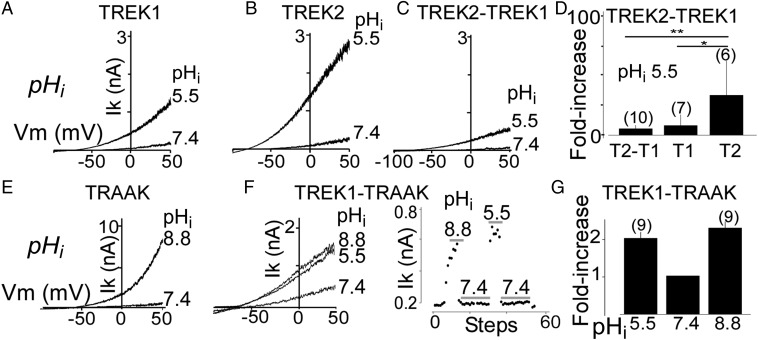
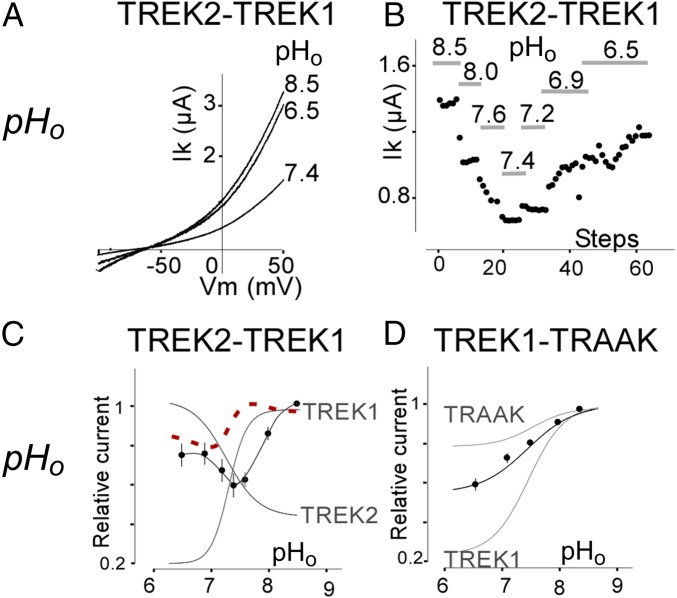
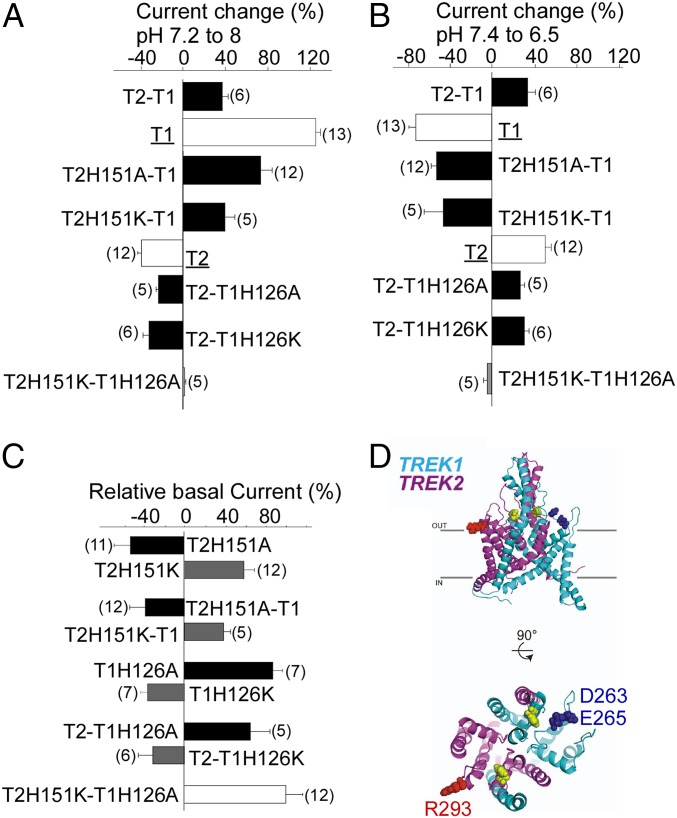
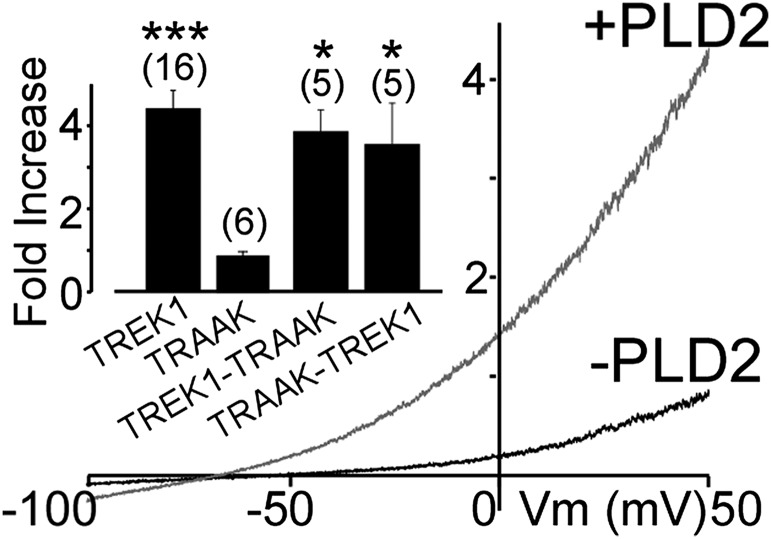
Twik-related K(+) channel 1 (TREK1), TREK2, and Twik-related arachidonic-acid stimulated K(+) channel (TRAAK) form the TREK subfamily of two-pore-domain K(+) (K2P) channels. Despite sharing up to 78% sequence homology and overlapping expression profiles in the nervous system, these channels show major differences in their regulation by physiological stimuli. For instance, TREK1 is inhibited by external acidification, whereas TREK2 is activated. Here, we investigated the ability of the members of the TREK subfamily to assemble to form functional heteromeric channels with novel properties. Using single-molecule pull-down (SiMPull) from HEK cell lysate and subunit counting in the plasma membrane of living cells, we show that TREK1, TREK2, and TRAAK readily coassemble. TREK1 and TREK2 can each heterodimerize with TRAAK, but do so less efficiently than with each other. We functionally characterized the heterodimers and found that all combinations form outwardly rectifying potassium-selective channels but with variable voltage sensitivity and pH regulation. TREK1-TREK2 heterodimers show low levels of activity at physiological external pH but, unlike their corresponding homodimers, are activated by both acidic and alkaline conditions. Modeling based on recent crystal structures, along with mutational analysis, suggests that each subunit within a TREK1-TREK2 channel is regulated independently via titratable His. Finally, TREK1/TRAAK heterodimers differ in function from TRAAK homodimers in two critical ways: they are activated by both intracellular acidification and alkalinization and are regulated by the enzyme phospholipase D2. Thus, heterodimerization provides a means for diversifying functionality through an expansion of the channel types within the K2P channels.

Keywords: combinatorial diversity; heteromerization; leak current; potassium channels; single-molecule fluorescence.


Conflict of interest statement

The authors declare no conflict of interest.

Figures

Fig. 1.
Fig. 1.
SiMPull of TREK1 from HEK 293T cells reveals TREK1 homodimers and TREK1-TREK2 heteromers. (A, Left) Schematic of SiMPull of TREK1. HEK 293T cells expressing HA-GFP-TREK1 (HA-GFP-T1) are lysed and then immobilized on a passivated coverslip conjugated to a biotinylated anti-HA Ab. (A, Right) TIRF images of single molecules showing that HA-GFP-TREK1 immobilization is dependent on the anti-HA Ab. (B) Representative trace showing two-step photobleaching (red arrows) of HA-GFP-TREK1. AU, arbitrary units. (C) Summary of photobleaching step distribution for HA-GFP-TREK1. (D) Representative images showing that HA-TREK1 (HA-T1) can pull down GFP-TREK1 (GFP-T1) or GFP-TREK2 (GFP-T2) with comparable efficiency. Controls without HA-TREK1 confirm specificity. (E) Summary of HA-TREK1 pull-down of GFP-TREK1 and GFP-TREK2.
Fig. S1.
Fig. S1.
SiMPull from HEK 293T cells reveals TREK2 homodimers and TREK1/TRAAK and TREK2/TRAAK heteromers. (A) TIRF images of immobilized single molecules of HA-GFP-TREK2. (B) Representative trace showing two-step photobleaching (red arrows) of TREK2. a.u., arbitrary unit. (C) Summary of photobleaching step distribution for HA-GFP-TREK2. (D) Representative images showing that HA-TREK2 is able to pull down GFP-TREK1 or GFP-TREK2 with comparable efficiency. (E) Summary of HA-TREK2 pull-down of GFP-TREK1 and GFP-TREK2. Representative images and summary graphs showing that HA-TREK1 (F and G) or HA-TREK2 (H and I) is able to pull down GFP-TRAAK above background levels, as measured by GFP-TRAAK alone.
Fig. S2.
Fig. S2.
SiMPull reveals a lack of heteromerization between TREK1 and TASK1 or TASK3, but clear heteromerization between TASK1 and TASK3. (A) TIRF images of immobilized single molecules of HA-TREK1–mediated pull-down of GFP-TREK1 (Left), GFP-TASK1 (Middle), or GFP-TASK3 (Right). (B) Summary of HA-TREK1 pull-down showing much more efficient pull-down of TREK1 compared with TASK1 or TASK3. Dilution factors describe how much lysate was diluted before application onto a coverslip. (C) Representative images showing that HA-TASK3 is able to pull down GFP-TASK1 or GFP-TASK3 with comparable efficiency. (D) Summary of HA-TASK1 pull-down of GFP-TASK1 and GFP-TASK3 compared with controls with GFP-TASK1 or HA-TASK1 alone.
Fig. 2.
Fig. 2.
TREK1 and TREK2 form heterodimers on the plasma membrane of Xenopus oocytes. Single-molecule subunit counting of TREK1 (A) and TREK2 (B) confirms strict dimerization. (Left) Images showing the first frame of a movie obtained for TREK1-GFP or TREK2-GFP. (Middle) Representative examples showing the time course of fluorescence photobleaching (gray arrows) from a single spot. (Right) Summary of photobleaching step distribution (gray bars) compared with the predicted distribution for a dimer based on 80% GFP maturation (black bars). (C) Representative TIRF images in the GFP (green) and tdTomato (red) channels for oocytes expressing similar levels of TREK1-GFP and TREK2-tdTomato. A bar graph summarizes the total number of red, green, and colocalized spots (yellow). (D) Similar data to C with TREK2-GFP and TREK1-tdTomato. The numbers of cells tested are indicated in parentheses.
Fig. 3.
Fig. 3.
Functional characterization of TREK1-TREK2 heterodimers. Normalized current–voltage (I–V) curves for TREK1-TREK2 (T1-T2) (A) or TREK2-TREK1 (T2-T1) (B) tandem dimers in the presence of two concentrations of external potassium (2 mM and 98 mM). (C) Representative traces showing TREK1 (T1), TREK2 (T2), and TREK2-TREK1 currents elicited by voltage ramps (from −100 to 50 mV, 1-s duration). (D) Summary of average current amplitudes. (E) Normalized I–V curves for TREK1, TREK2, and TREK2-TREK1 obtained in symmetrical potassium conditions (98 mM). (F) Bar graph representing the ratio (absolute values) of mean current recorded at −80 and +80 mV. The numbers of cells tested are indicated in parentheses. Student’s t test (*P < 0.05). Ik, potassium current; n.s., not significant; Vm, membrane potential.
Fig. S3.
Fig. S3.
TREK1-TREK1 and TREK2-TREK2 tandem homodimers show the same amplitude as WT TREK1 and TREK2, respectively. Representative traces showing TREK1, TREK1-TREK1, TREK2, TREK2-TREK2, and TREK2-TREK1 currents. Currents were elicited by voltage-ramps (from −100 to 50 mV, 1 s in duration). (Inset) Bar graph showing average TREK1, TREK1-TREK1, TREK2, TREK2-TREK2, and TREK2-TREK1. The numbers of cells tested are indicated in parentheses. Student’s t test (*P < 0.05). Ik, potassium current; n.s., not significant; Vm, membrane potential.
Fig. S4.
Fig. S4.
Basic characterization of TREK1-TASK tandem heterodimers. Normalized current–voltage (I–V) curves for TRAAK-TREK1 (A) or TREK1-TRAAK (B) tandem dimers obtained in the presence of two concentrations of external potassium (2 mM and 98 mM). (C) Representative traces showing TREK1, TRAAK, and TREK1-TRAAK currents. Currents were elicited by voltage ramps (from −100 to 50 mV, 1 s in duration). (D) Bar graph showing average TREK1, TREK2, TREK1-TRAAK, and TRAAK-TREK1 current amplitudes. (E) Normalized I–V curves for TREK1, TRAAK, and TREK1-TRAAK obtained in symmetrical potassium conditions (98 mM). (F) Bar graph representing the ratio (absolute values) of mean current recorded at −80 and +80 mV. The numbers of cells tested are indicated in parentheses. Student’s t test (*P < 0.05; **P < 0.01).
Fig. 4.
Fig. 4.
Regulation of TREK family heterodimers by intracellular pH (pHi). Representative traces showing the effect of intracellular acidification on TREK1 (T1) (A), TREK2 (T2) (B), and TREK2-TREK1 tandem heterodimers (T2-T1) (C). (D) Bar graph summarizing the current fold increases induced by a pHi shift from 7.4 to 5.5. Representative traces showing the effect of changes in pHi on TRAAK homodimers (E) and TREK1-TRAAK tandem heterodimers (F). An example of the response to dynamic changes in pHi for TREK1-TRAAK is shown in F. Currents were elicited by voltage ramps (from −100 to 50 mV, 1-s duration, 1 step per 5 s). (G) Bar graph summarizing the increase in current induced by pHi shift from 7.4 to either 5.5 or 8.8 for TREK1-TRAAK. The numbers of cells tested are indicated in parentheses. Student’s t test (*P < 0.05; **P < 0.01).
Fig. 5.
Fig. 5.
Regulation of TREK family heterodimers by extracellular pH. (A) Representative traces showing the effect of changes in extracellular pH (pHo) on TREK2-TREK1 tandem heterodimers. Currents were elicited by voltage ramps (from −10 to 50 mV, 1-s in duration). (B) Representative example of dynamic regulation of TREK2-TREK1 tandem heterodimers by changes in pHo. (C) pHo dependence of TREK2-TREK1 tandem (black) compared with TREK2 and TREK1 (gray) homodimers. The linear sum of the pHo dependence of the TREK1 and TREK2 homodimers is shown as a dotted red line. (D) pHo dependence of TREK1-TRAAK tandem homodimers (black) compared with TREK1 and TRAAK homodimers (gray).
Fig. 6.
Fig. 6.
Mechanism of Pho sensitivity of TREK2-TREK1 heterodimers. (A) Bar graph showing the percentage of current at pH 8 relative to pH 7.2 for TREK1 (T1), TREK2 (T2), TREK2-TREK1 (T2-T1), and TREK2-TREK1 (T2-T1) mutants. (B) Bar graph showing the percentage of current at pH 7.4 relative to pH 6.5. (C) Bar graph showing the current amplitude of TREK2 (T2) mutants relative to TREK2, TREK1 (T1) mutants relative to TREK1, and TREK2-TREK1 (T2-T1) mutants relative to TREK2-TREK1. (D) Structural model of TREK1-TREK2 heterodimers showing His pH sensors (yellow). The proposed negatively charged interacting residues of TREK1 (cyan) are shown in blue, and the proposed positively charged interacting residues of TREK2 (magenta) are shown in red.
Fig. 7.
Fig. 7.
Potentiation of TREK1-TRAAK heterodimers by PLD2. Representative traces showing effects of PLD2 coexpression on TREK1-TRAAK. (Inset) Summary of current potentiation by coexpression of PLD2. The numbers of cells tested are indicated in parentheses. Student’s t test (*P < 0.05; ***P < 0.001).

Similar articles

Cited by

References

    1. Patel AJ, et al. A mammalian two pore domain mechano-gated S-like K+ channel. EMBO J. 1998;17(15):4283–4290. - PMC - PubMed
    1. Maingret F, et al. TREK-1 is a heat-activated background K(+) channel. EMBO J. 2000;19(11):2483–2491. - PMC - PubMed
    1. Kang D, Choe C, Kim D. Thermosensitivity of the two-pore domain K+ channels TREK-2 and TRAAK. J Physiol. 2005;564(Pt 1):103–116. - PMC - PubMed
    1. Maingret F, Patel AJ, Lesage F, Lazdunski M, Honoré E. Lysophospholipids open the two-pore domain mechano-gated K(+) channels TREK-1 and TRAAK. J Biol Chem. 2000;275(14):10128–10133. - PubMed
    1. Comoglio Y, et al. Phospholipase D2 specifically regulates TREK potassium channels via direct interaction and local production of phosphatidic acid. Proc Natl Acad Sci USA. 2014;111(37):13547–13552. - PMC - PubMed

Publication types

MeSH terms

Substances