. 2016 Apr 12;113(15):E2134-41.
doi: 10.1073/pnas.1522656113. Epub 2016 Mar 29.

Modeling and analysis of collective cell migration in an in vivo three-dimensional environment

Affiliations

Modeling and analysis of collective cell migration in an in vivo three-dimensional environment

Danfeng Cai et al. Proc Natl Acad Sci U S A. .

Abstract

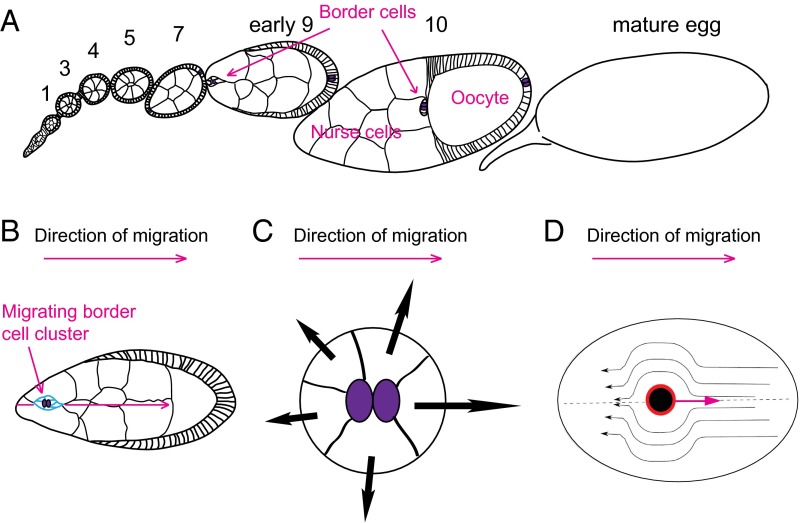
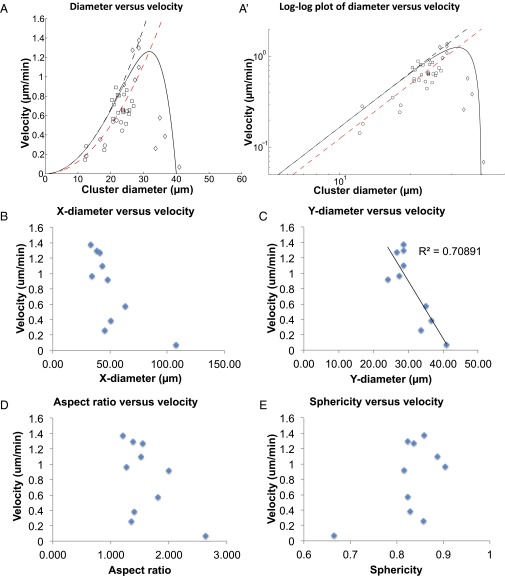
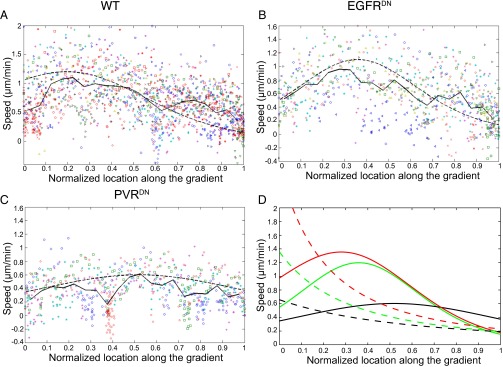
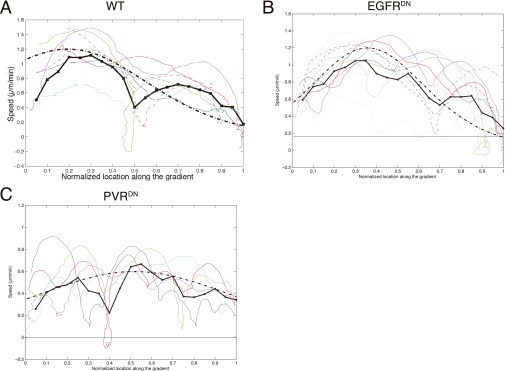
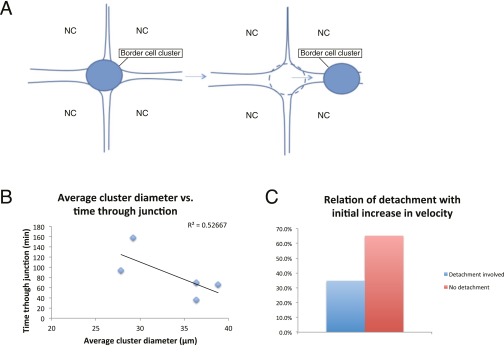
A long-standing question in collective cell migration has been what might be the relative advantage of forming a cluster over migrating individually. Does an increase in the size of a collectively migrating group of cells enable them to sample the chemical gradient over a greater distance because the difference between front and rear of a cluster would be greater than for single cells? We combined theoretical modeling with experiments to study collective migration of the border cells in-between nurse cells in the Drosophila egg chamber. We discovered that cluster size is positively correlated with migration speed, up to a particular point above which speed plummets. This may be due to the effect of viscous drag from surrounding nurse cells together with confinement of all of the cells within a stiff extracellular matrix. The model predicts no relationship between cluster size and velocity for cells moving on a flat surface, in contrast to movement within a 3D environment. Our analyses also suggest that the overall chemoattractant profile in the egg chamber is likely to be exponential, with the highest concentration in the oocyte. These findings provide insights into collective chemotaxis by combining theoretical modeling with experimentation.

Keywords: cell migration; chemotaxis; theoretical modeling; three-dimensional.


Conflict of interest statement

The authors declare no conflict of interest.

Figures

Fig. 1.
Fig. 1.
Drosophila ovary and border cell migration simulations. (A) Drosophila ovariole containing egg chambers of increasing maturity. (B) Stage 9 egg chamber showing border cells at onset of migration. Border cells are in blue. (C) Schematic illustration of our model of chemotaxis of cellular clusters: due to the chemoattractant gradient, the cells at the cluster surface protrude and induce a force that is directed at the local outward normal, and is increasing with the local concentration of the chemical signal (black arrows). (A–C) Polar cells are in purple. (D) Schematic illustration of the drag sources on the border cell cluster (black circle) as it moves along the axis of the egg. One mechanism of drag is due to direct molecular binding with the surrounding cells (red rim of the cluster), and the second mechanism comes from the cytoplasmic flow around the cluster (streamlines with arrows).
Fig. S1.
Fig. S1.
Behavior of the resultant force (Eq. 4) for a linear chemical profile. The y axes are force in log scale. (A) As a function of the maximal concentration cm. We find a linear increase of the force for shallow gradients, and a saturation-driven slowing down for steep gradients [calculated at a fixed position (x0=L/2)]. (B) Force as a function of the position along the gradient (x0) for three values of the gradient (cmc0) (blue, purple, and yellow indicate increasing values of cm). (C) FxR3 behavior.
Fig. S2.
Fig. S2.
(A) Calculated velocity (purple line, from Eq. S9) of a cluster moving up an exponential chemical gradient (blue line). The response function S(x) is shown by the yellow line, and we see that the peak in the cluster velocity corresponds to the steepest part of the response (using: c0 = 0, cm = 10, ϵ = 1, ξ = 15, R = 5, L = 100). The values are normalized for comparison. (B) The total force (proportional to cluster velocity) of the cluster up the exponential gradient, from Eq. S9 (using c0 = 0, cm = 10, ϵ = 1, R = 5, L = 100), for different values of ξ = 25, 15, 10 (Left to Right). (C) As in B (using: c0 = 0, cm = 10, ξ = 10, R = 5, L = 100), for different values of ϵ = 1, 10, 100 (Right to Left). In B and C, the approximate locations of the peak in the cluster velocity, according to xpeak (Eq. S10), are denoted by the vertical dashed lines.
Fig. 2.
Fig. 2.
Dependence of mean cluster velocity on the cluster radius. (A) Symbols show data points averaged from different experiments: Circles, E-cadherin k.d. (UpdGal4, UAS-EcadRNAi); squares, WT; diamonds, mutant extralarge clusters. Solid black line gives the fit to Eq. 16, using α=0, i = 6, Regg = 20 μm, β = 150 (μm⋅min). Dashed black line, Regg, such that the effects of the confining shell are ignored. The red dashed line denotes the fit to the WT and E-cadherin k.d. data using these parameters: Regg = 26 μm, β = 200 (μm⋅min). A′ shows a log–log plot to highlight the power-law behavior of small clusters, vR2, which indicates the dominant role of viscous drag. (B–E) Plotting x-axis diameter (B), y-axis diameter (C), aspect ratio (D), and sphericity (E) against velocity. Lines of linear regression were shown and R2 were indicated in C.
Fig. S3.
Fig. S3.
(A) Dependence of mean cluster velocity on cluster radius, with SD shown. (B) Cluster velocity in relation to cluster position along the migration path. (C) Variance in the y-direction velocity vy2 as a function of the cluster diameter. Symbols are data points averaged from individual experiments.
Fig. 3.
Fig. 3.
Migration profiles of WT and receptor-deficient clusters. Migration speeds at different positions along migration path in WT (A), slboGal4; EGFRDN (B), and slboGal4; PVRDN (C) egg chambers. Symbols of same color and shape indicate data points from the same movie. Solid lines give the average of all of the experiments. Dashed line gives the fit to Eq. 17. (D) Theoretical fits to WT (red), EGFRDN (green), and PVRDN (black) migration speed using exponential (solid lines) and linear (dashed lines) chemoattractant concentration profile.
Fig. S4.
Fig. S4.
Velocity up the gradient, for several experiments. Colored lines are individual WT (A), EGFRDN (B), and PVRDN (C) experiments, averaged every five time points for smoothening. The thick black line gives the average of all of the experiments, and the thick dashed-dot black line gives the fit to Eq. 17. The peak value of the theoretical expression is normalized to velocity of 1.2 µm/min.
Fig. S5.
Fig. S5.
Nurse cell influence on border cell migration. (A) Illustration of border cell cluster untrapping from a nurse cell–nurse cell junction. NC, nurse cell. (B) Time spent untrapping from a junction in relation to cluster size. Linear regression was done and linear plot was shown in the graph. (C) Percentage of border cell migration movies that show an initial increase in speed that have detachment (blue bar) and no detachment (red bar) involved.

Similar articles

Cited by

References

    1. Parent CA, Devreotes PN. A cell’s sense of direction. Science. 1999;284(5415):765–770. - PubMed
    1. Devreotes PN, Zigmond SH. Chemotaxis in eukaryotic cells: A focus on leukocytes and Dictyostelium. Annu Rev Cell Biol. 1988;4:649–686. - PubMed
    1. Yu SR, et al. Fgf8 morphogen gradient forms by a source-sink mechanism with freely diffusing molecules. Nature. 2009;461(7263):533–536. - PubMed
    1. Crick F. Diffusion in embryogenesis. Nature. 1970;225(5231):420–422. - PubMed
    1. Moissoglu K, Majumdar R, Parent CA. Cell migration: Sinking in a gradient. Curr Biol. 2014;24(1):R23–R25. - PubMed

Publication types

Substances