. 2016 Apr 12;113(15):4182-7.
doi: 10.1073/pnas.1522958113. Epub 2016 Mar 30.

Comprehensive mutagenesis of the fimS promoter regulatory switch reveals novel regulation of type 1 pili in uropathogenic Escherichia coli

Affiliations

Comprehensive mutagenesis of the fimS promoter regulatory switch reveals novel regulation of type 1 pili in uropathogenic Escherichia coli

Huibin Zhang et al. Proc Natl Acad Sci U S A. .

Abstract

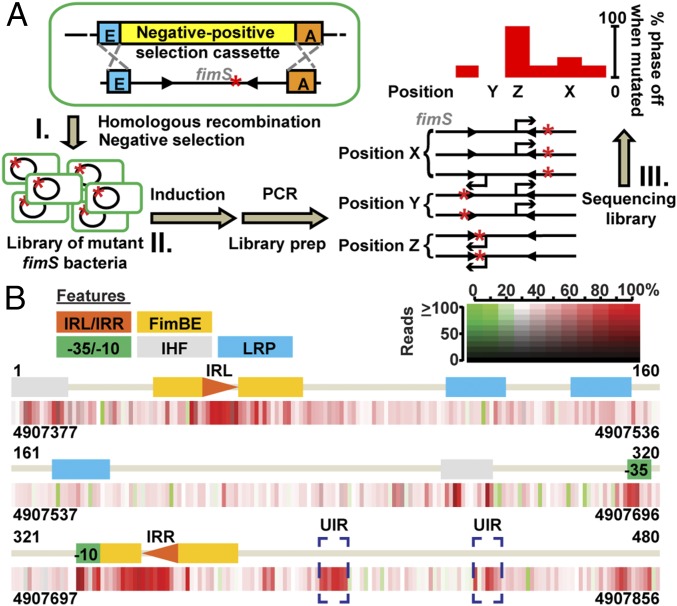
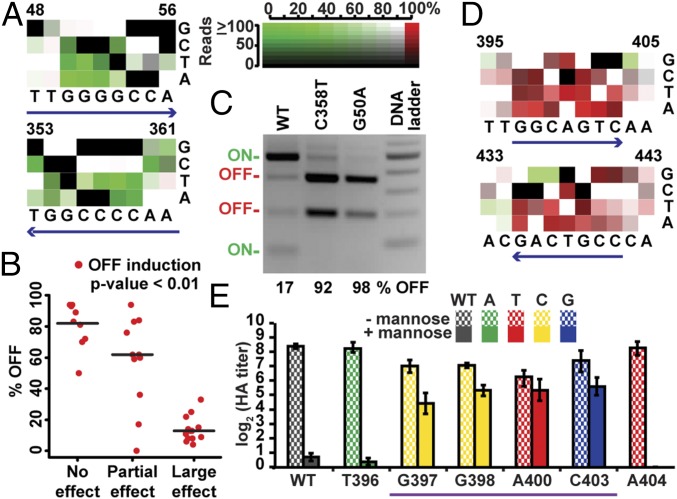
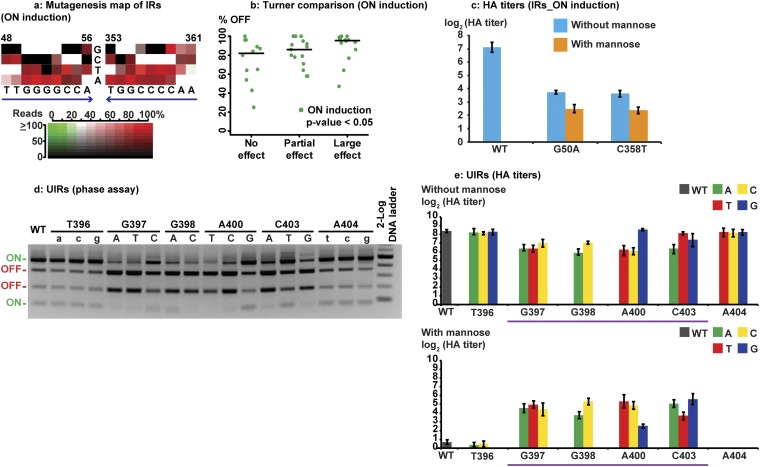
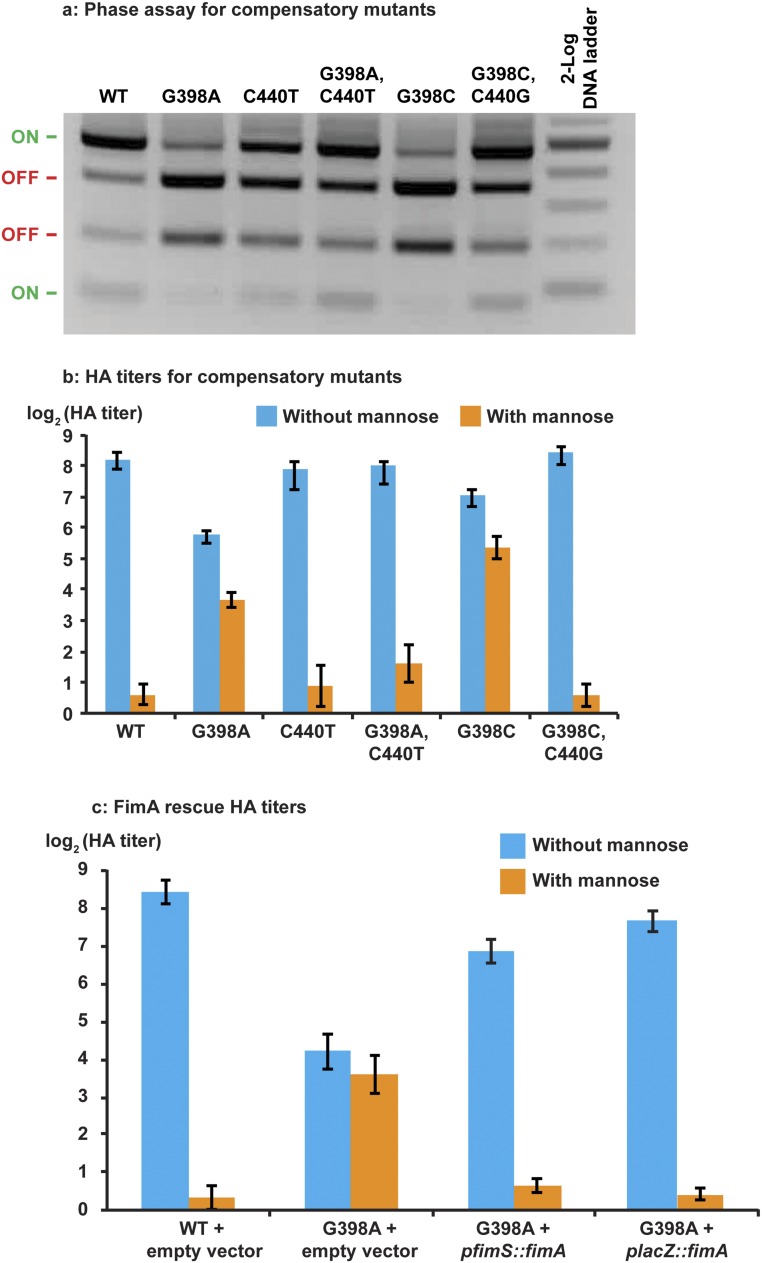
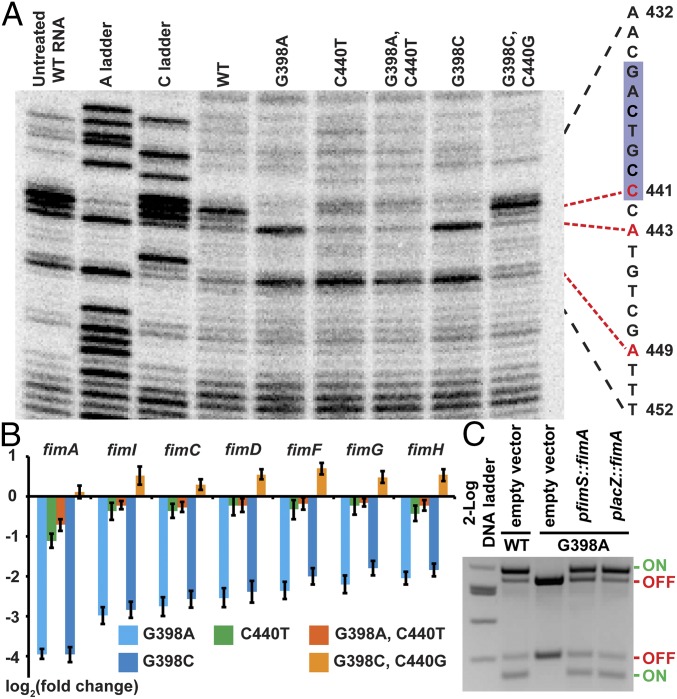
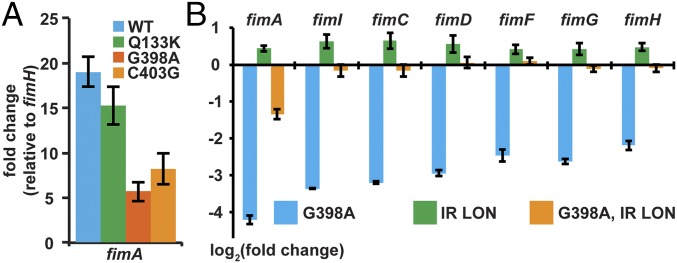
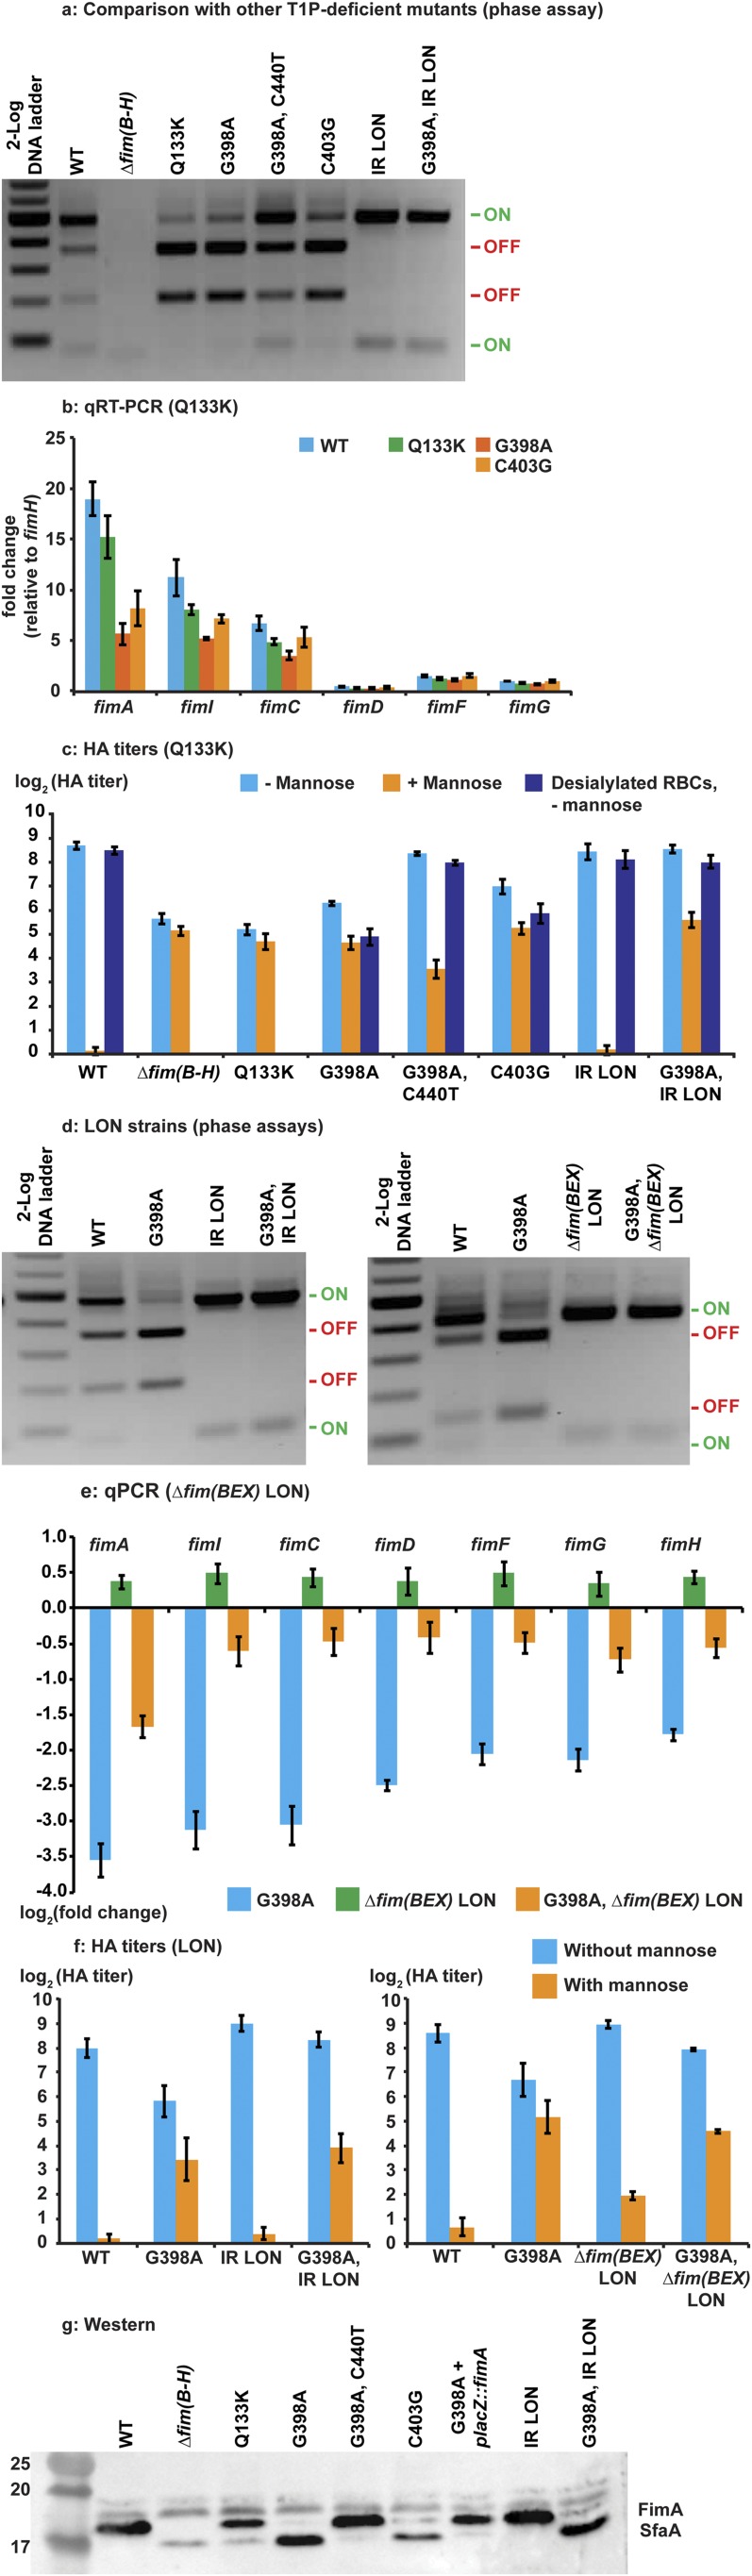
Type 1 pili (T1P) are major virulence factors for uropathogenic Escherichia coli (UPEC), which cause both acute and recurrent urinary tract infections. T1P expression therefore is of direct relevance for disease. T1P are phase variable (both piliated and nonpiliated bacteria exist in a clonal population) and are controlled by an invertible DNA switch (fimS), which contains the promoter for the fim operon encoding T1P. Inversion of fimS is stochastic but may be biased by environmental conditions and other signals that ultimately converge at fimS itself. Previous studies of fimS sequences important for T1P phase variation have focused on laboratory-adapted E coli strains and have been limited in the number of mutations or by alteration of the fimS genomic context. We surmounted these limitations by using saturating genomic mutagenesis of fimS coupled with accurate sequencing to detect both mutations and phase status simultaneously. In addition to the sequences known to be important for biasing fimS inversion, our method also identifies a previously unknown pair of 5' UTR inverted repeats that act by altering the relative fimA levels to control phase variation. Thus we have uncovered an additional layer of T1P regulation potentially impacting virulence and the coordinate expression of multiple pilus systems.

Keywords: fimS; phase variation; saturating chromosomal mutagenesis; type 1 pili; urinary tract infection.


Conflict of interest statement

The authors declare no conflict of interest.

Figures

Fig. 1.
Fig. 1.
Mapping the effects of fimS mutations on phase variation. (A) Schematic diagram of the approach. Asterisks indicate mutations in fimS, “E” refers to fimE, and “A” refers to fimA. (I) A strain carrying a dual-positive/negative selection cassette in the chromosomal fimS locus is used to make a library of randomly generated fimS mutants. (II) After growth under phase ON- or OFF-inducing conditions, the fimS locus is amplified by PCR and made into sequencing libraries. (III) Sequence analysis provides a map of phase variation (quantified as % OFF) associated with individual fimS mutations. (B) Phase variation map of fimS mutations under ON induction. Numbers correspond to nucleotide positions within fimS (position 1 maps to genomic coordinate 4907377 in UTI89). A genetic map of fimS is depicted as a gray line with selected features indicated by labeled colored bars and triangles (12, 26, 42, 52, 64); “FimBE,” “LRP,” and “IHF” indicate binding sites for the respective proteins; “−10” and “−35” indicate fimA promoter elements; and “IRL” and “IRR” indicate the fimS IRs. Below the genetic map, each position in fimS is represented by a rectangle whose brightness and color indicate the number of mutant sequencing reads observed and the percentage of reads that are phase OFF (based on the scale at top right), respectively; data are averaged for all mutations at that position. The % OFF for WT is shown in white, lower % OFF in green, and higher % OFF in red. The UIRs are indicated by purple dashed boxes.
Fig. S1.
Fig. S1.
Mapping the effect of fimS mutations on phase variation. (A) Comparison of mutation distributions of sequencing libraries sequenced with different platforms. The percentage of sequenced reads mutated (y axis) at each fimS position (x axis) is plotted. (Top) Unmutagenized library (PacBio versus Illumina). Note the different scale for PacBio. (Middle) PacBio sequencing (unmutagenized versus mutagenized libraries). (Bottom) Illumina sequencing (unmutagenized versus mutagenized libraries). (B) Frequency graphs of mutations per sequenced read. The number of reads × 103 (y axis) is plotted against the number of mutations per read (x axis) under ON induction (Upper) and under OFF induction (Lower). (C) Mutation distributions across fimS. The percentage of sequenced reads mutated (y axis) at each position (x axis) is plotted under ON induction (Upper) and OFF induction (Lower).
Fig. S2.
Fig. S2.
Detailed phase variation map with significance. Each position in fimS is represented by four rectangles (representing all four possible nucleotides) whose brightness and color indicate the number of mutant sequencing reads observed and the percentage of reads that are phase OFF (based on the scale at bottom right), respectively. WT levels of OFF frequencies are shown in white, lower values are shown in green, and higher values are shown in red. The nucleotide position within fimS is shown below the map (position 1 maps to genomic coordinate 4907377 in UTI89), and the WT fimS sequence is shown above the map. Selected features are indicated by labeled colored bars (12, 26, 42, 52, 64). “FimBE”, “LRP,” and “IHF” indicate the binding sites the respective proteins; “−10” and “−35” indicate the relative positions of the transcriptional start site, and “IRL” and “IRR” indicate the pair of IRs. Yellow asterisks denote P values less than 0.01. (A) Under ON induction. (B) Under OFF induction.
Fig. S3.
Fig. S3.
Analysis of fimS conservation and correlation with phase variation. (A) Phase variation map (under OFF induction) of fimS mutations with conservation. Numbers correspond to nucleotide positions within fimS (position 1 maps to genomic coordinate 4907377 in UTI89). A genetic map of fimS is depicted as a gray line with selected features indicated by labeled colored bars and triangles (12, 26, 42, 52, 64). “FimBE,” “LRP,” and “IHF” indicate the binding sites for the respective proteins; “−10” and “−35” indicate the relative positions of the transcriptional start site, and “IRL” and “IRR” indicate the pair of IRs. Below this genetic map, each position in fimS is represented by a rectangle whose brightness and color indicate the number of mutant sequencing reads observed and the percentage of reads that are phase OFF (based on the scale at top right), respectively; data are averaged for all mutations at that position. WT levels of OFF frequencies are shown in white, lower values are shown in green, and higher values are shown in red. The black bars below the phase variation map represent percentage similarity (y axis) of fimS sequences from 302 E. coli strains to UTI89. (Upper) Conservation (identity to the UTI89 fimS sequence) is scaled from 90 to 100%. (Lower) Conservation is scaled from 0 to 100%. (B) Percentage of conservation with UTI89 (y axis) is plotted against percentage of phase OFF reads (x axis). Each point represents each fimS position (480 total), with its corresponding percentage similarity and phase OFF percentage when mutated. The vertical green line denotes the phase OFF percentage observed for WT fimS, and the red box denotes data points that are either <0.5-fold (OFF induction) or more than twofold (ON induction) of that value. These two sets of data points were used to determine significance using the Mann–Whitney–Wilcoxon test in R (68). (Left) Under OFF induction. (Right) Under ON induction.
Fig. 2.
Fig. 2.
Identification of loci involved in phase regulation. (A) Detailed phase variation map for the fimS IRs (purple arrows) under OFF induction. Numbers correspond to nucleotide positions within fimS as in Fig. 1; the WT IR sequence is indicated below. Each position is represented by four rectangles (representing all four possible nucleotides) whose brightness and color indicate the number of mutant sequencing reads observed and the percentage of reads that are phase OFF, respectively (based on the scale at the right). (B) Comparison of phase variation effects with those found by McCusker et al. (43) under OFF induction. Each point represents the % phase OFF for a single IR mutation, with the x-axis categories taken from ref. . The solid black lines indicate the median. Only IR mutations with at least 10 sequencing reads were plotted (n = 34). (C) T1P phase assay of IR mutants. Mutations are indicated at the top. Bands corresponding to phase ON and OFF orientation are indicated on the left. The % phase OFF based on band intensities is shown below. (D) Phase variation map for UIRs (purple solid arrows) under ON induction. Notation is as in A. (E) HA assay for T1P function. Average log2 (HA titer), with SEs (y axis), for each mutant (x axis) are plotted using data from at least three independent experiments. Colors represent different mutations; solid bars represent HA titers with mannose added. Only one transversion per position is shown; other mutations are shown in Fig. S4E. Purple solid lines denote mutations within the UIR.
Fig. S4.
Fig. S4.
Accurate sequencing-based analysis of fimS phase identifies known and previously unknown loci involved in phase regulation. (A) Detailed phase variation map for the fimS IRs (purple arrows) under ON induction. Numbers correspond to nucleotide positions within fimS. Each position in the IRs is represented by four rectangles (representing all four possible nucleotides) whose brightness and color indicate the number of mutant sequencing reads observed and the percentage of reads that are phase OFF (based on the scale below the maps), respectively. WT levels of OFF frequencies are shown in white, lower values are shown in green, and higher values are shown in red. The WT IR sequence is depicted below the map. (B) Comparison of phase variation effects with those reported by McCusker et al. (43) under ON induction. Each point represents the % phase OFF for a single IR mutation, with the x-axis categories taken from ref. . The median for each x-axis category is indicated by a black solid line. Only IR mutations with at least 10 sequencing reads were plotted (n = 41). (C) HA assay of the IR mutants G50A and C358T under ON induction. Average log2 (HA titers), with SEs (y axis), for each mutant (x axis) are plotted using data from at least three independent experiments. Blue and orange bars represent HA titers performed without mannose and with 4% mannose added, respectively. (D) Type 1 pilus phase assay of UIR mutants under ON induction. Mutations are shown above the blots; capitalized letters represent mutations in UIRs. “WT” refers to the parental UTI89 strain band; sizes corresponding to the phase ON or OFF orientation are indicated on the left. (E) HA assay. Average log2 (HA titer), with SEs (y axis), for each mutant (x axis) are plotted using data from at least three independent experiments. Colors represent different mutations, as indicated in the keys. The purple solid lines denote mutations within UIRs. (Upper) Without mannose. (Lower) With mannose.
Fig. S5.
Fig. S5.
The UIRs likely form a base-paired RNA structure to affect fimA transcript levels. “WT” refers to WT UTI89 strain. Assays were performed after phase ON induction. (A) Type 1 pilus phase assay. Mutations are shown above the blots. WT band sizes corresponding to the phase ON or OFF orientation are indicated on the left. (B) HA assay. Average log2 (HA titers) with SEs (y axis) for each mutant (x axis) are plotted using data from at least three independent experiments. Blue and orange bars represent HA titers performed without mannose and with 4% mannose added, respectively. (C) HA of strains overexpressing fimA in trans. Average log2 (HA titers) with SEs (y axis) for each strain (x axis) are plotted using data from at least three independent experiments. Blue and orange bars represent HA titers performed without mannose and with 4% mannose added, respectively.
Fig. 3.
Fig. 3.
The UIRs likely form a base-paired RNA structure to affect fimA transcript levels. (A) Structure-probing gel analysis using NAI on in vitro-transcribed fimA RNA. Mutations are indicated at the top. Untreated RNA and the A and C ladders are derived from a WT fimA allele. The WT sequence is shown on the right. Numbers indicate fimS positions; the UIR is indicated by a purple box. Red nucleotides represent specific positions at which structural differences are observed. (B) qRT-PCR of fim transcripts under ON induction. Colors indicate different mutants, as indicated in the key. Average log2 (fold change, normalized to UTI89) and SE (y axis) for each fim transcript (x axis) are plotted using data from at least three independent experiments. (C) Type 1 pilus phase assay of the G398A mutant overexpressing fimA in trans. The strains and plasmids are indicated above. Band sizes corresponding to the phase ON or OFF orientation are indicated on the right.
Fig. 4.
Fig. 4.
UIR mutants regulate phase variation through a previously unknown mechanism. (A) qRT-PCR of fimA transcripts under ON induction. Colors represent different mutants as indicated in the key. Average fold change (normalized to fimH) and SE (y axis) are plotted using data from at least three independent experiments. (B) qRT-PCR of fim transcripts in mutant IR LON strain carrying a G398A mutation under ON induction. Colors represent different mutants as indicated in the key. Average log2 (fold change, normalized to WT) and SE (y axis) for each fim transcript (x axis) are plotted using data from at least three independent experiments.
Fig. S6.
Fig. S6.
UIR mutants regulate phase variation through a previously unknown mechanism. “WT” refers to the WT UTI89 strain. All assays were performed after growth in ON-inducing conditions. (A) Type 1 pilus phase assay of T1P-deficient strains. Mutations are shown above the blots. Band sizes corresponding to the phase ON or OFF orientation are indicated on the right. (B) qRT-PCR of fim transcripts of T1P-deficient strains. Colors represent different mutations as indicated in the key. Average fold change (normalized to fimH) and SE are plotted (y axis) using data from at least three independent experiments. (C) HA assay of T1P-deficient strains. Average log2 (HA titers), with SEs (y axis), for each strain (x axis) are plotted using data from at least three independent experiments. Blue and orange bars represent HA titers performed without mannose and with 4% mannose added, respectively; the darker blue bars represent HA titers performed using desialylated erythrocytes. Data for desialylated erythrocytes with 4% mannose were 20 ± 0 for all samples and were not plotted. (D) Type 1 pilus phase assay of phase LON strains with fimS (G398) mutation. Mutations are shown above the blots. Band sizes corresponding to the phase ON or OFF orientation are indicated on the right. (Left) Mutant IR LON. (Right) Δfim(BEX) LON. (E) qRT-PCR of fim transcripts for Δfim(BEX) LON strains. Colors represent different mutations as indicated in the key. Average fold change and SE (y axis, normalized to WT) for each fim transcript (x axis) are plotted using data from at least three independent experiments. (F) HA assay of phase LON strains with the fimS (G398) mutation. Average log2 (HA titers), with SEs (y axis), for each mutant (x axis) are plotted using data from at least three independent experiments. Blue and orange bars represent HA titers performed without mannose and with 4% mannose added, respectively. (Left) Mutant IR LON. (Right) Δfim(BEX) LON. (G) Western blot using an antibody that detects both FimA and SfaA. The different mutant strains are shown above the blots. Protein ladder sizes are on the left, and positions of bands corresponding to FimA and SfaA are identified on the right.

Comment in

Similar articles

Cited by

References

    1. Foxman B, Brown P. Epidemiology of urinary tract infections: Transmission and risk factors, incidence, and costs. Infect Dis Clin North Am. 2003;17(2):227–241. - PubMed
    1. Flores-Mireles AL, Walker JN, Caparon M, Hultgren SJ. Urinary tract infections: Epidemiology, mechanisms of infection and treatment options. Nat Rev Microbiol. 2015;13(5):269–284. - PMC - PubMed
    1. Mulvey MA, et al. Induction and evasion of host defenses by type 1-piliated uropathogenic Escherichia coli. Science. 1998;282(5393):1494–1497. - PubMed
    1. Wu XR, Sun TT, Medina JJ. In vitro binding of type 1-fimbriated Escherichia coli to uroplakins Ia and Ib: Relation to urinary tract infections. Proc Natl Acad Sci USA. 1996;93(18):9630–9635. - PMC - PubMed
    1. Eto DS, Jones TA, Sundsbak JL, Mulvey MA. Integrin-mediated host cell invasion by type 1-piliated uropathogenic Escherichia coli. PLoS Pathog. 2007;3(7):e100. - PMC - PubMed

Publication types

MeSH terms