. 2016 Apr 12;113(15):4039-44.
doi: 10.1073/pnas.1523926113. Epub 2016 Mar 30.

Phosphorylation of OPTN by TBK1 enhances its binding to Ub chains and promotes selective autophagy of damaged mitochondria

Affiliations

Phosphorylation of OPTN by TBK1 enhances its binding to Ub chains and promotes selective autophagy of damaged mitochondria

Benjamin Richter et al. Proc Natl Acad Sci U S A. .

Abstract

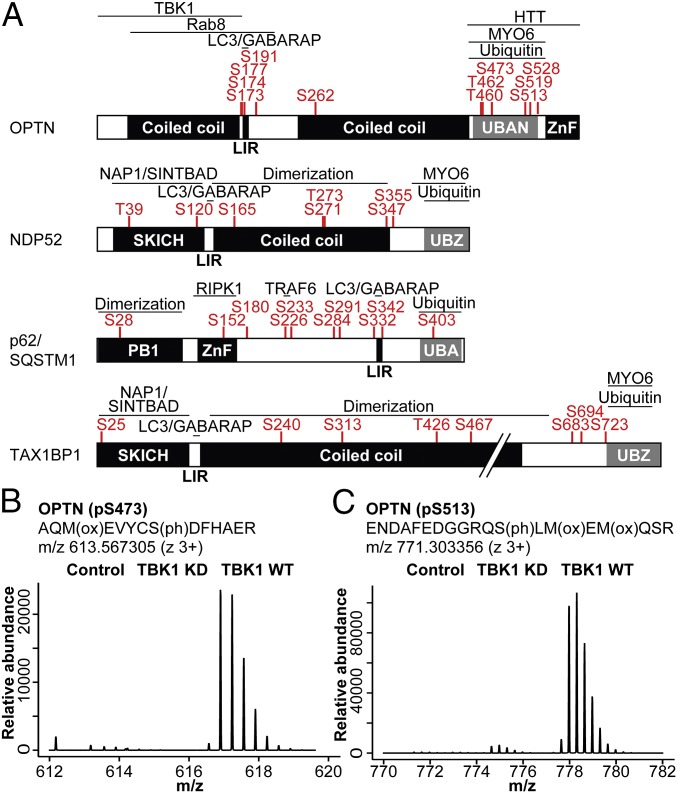
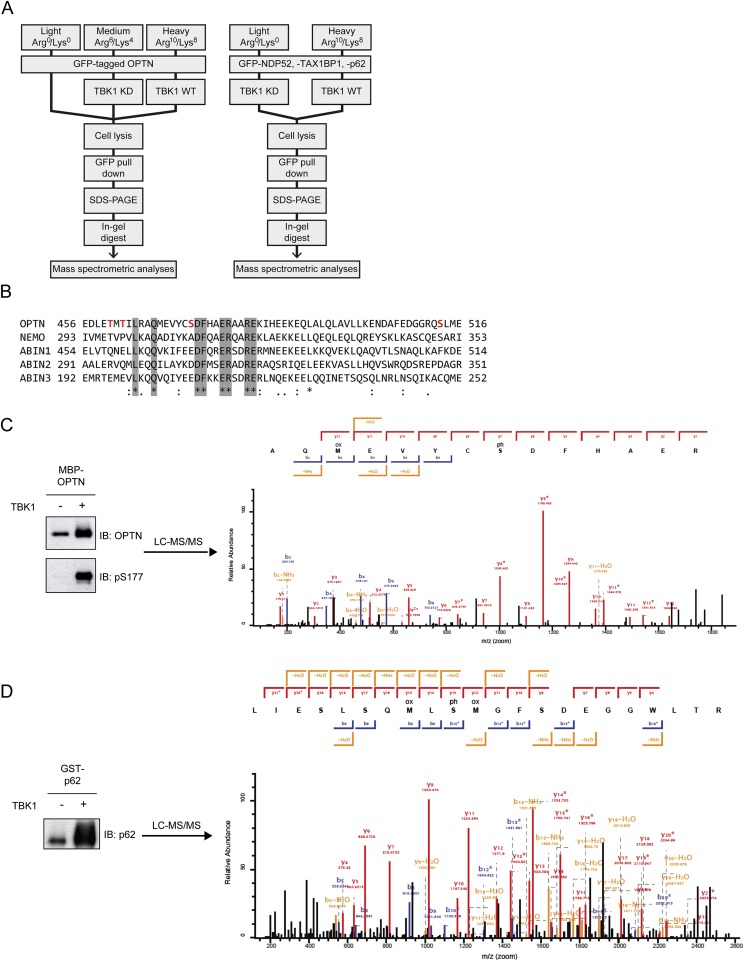
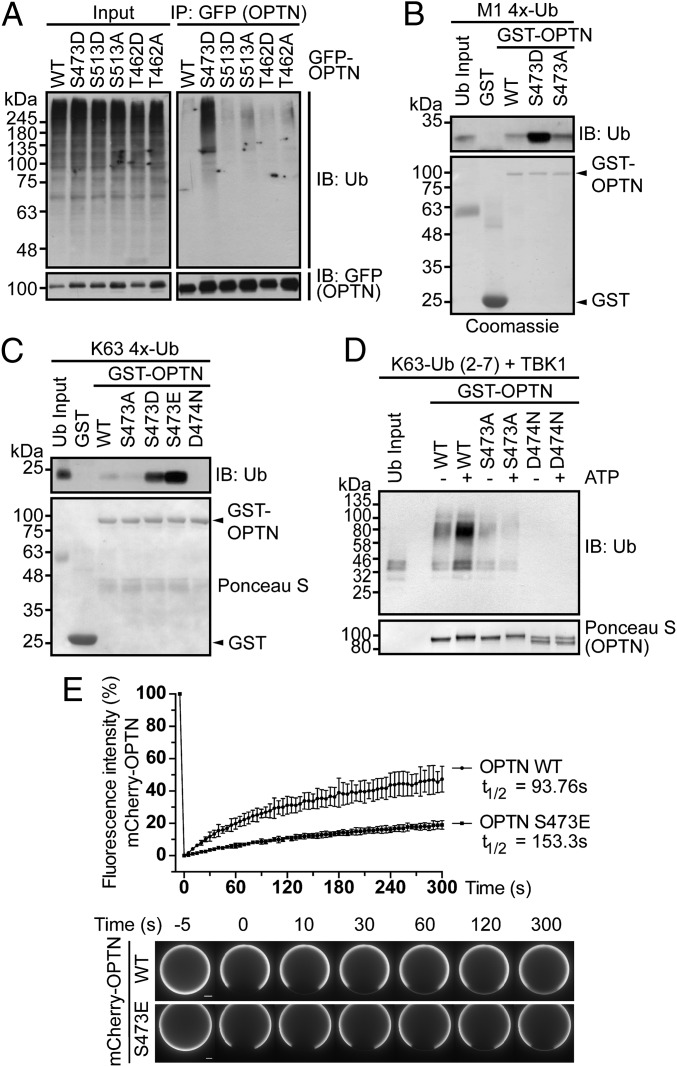
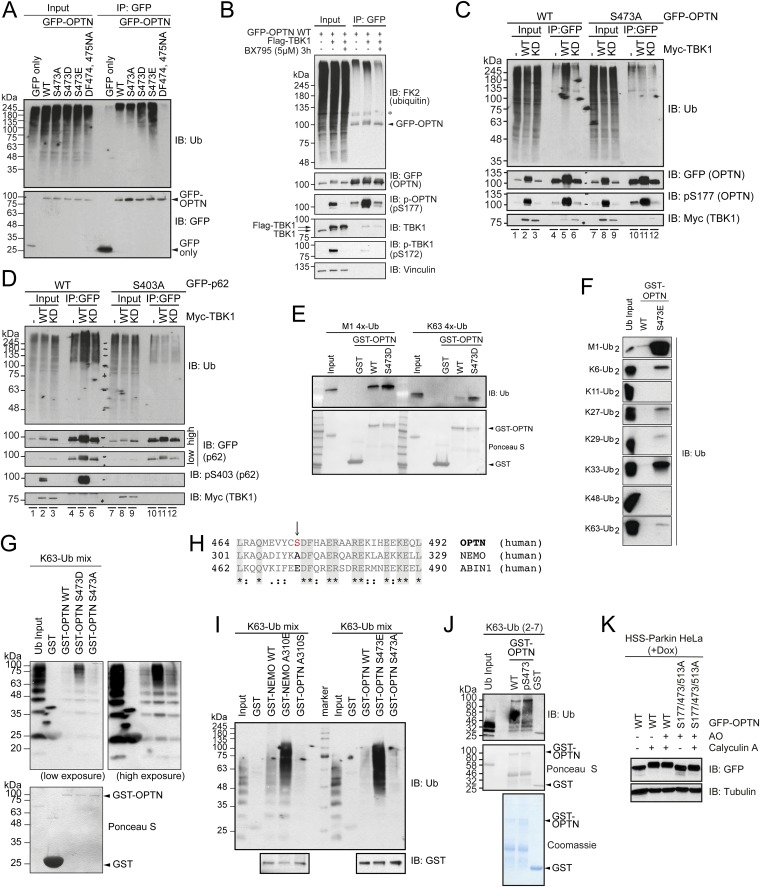
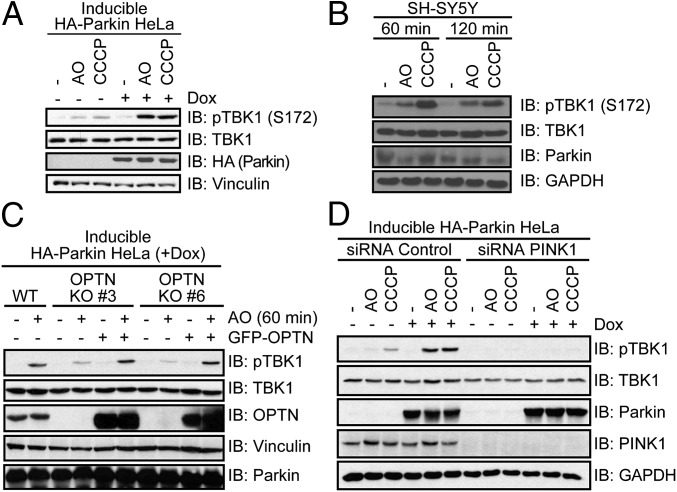
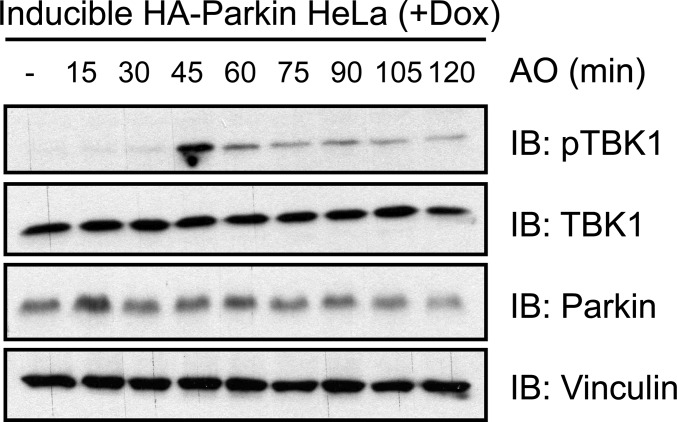
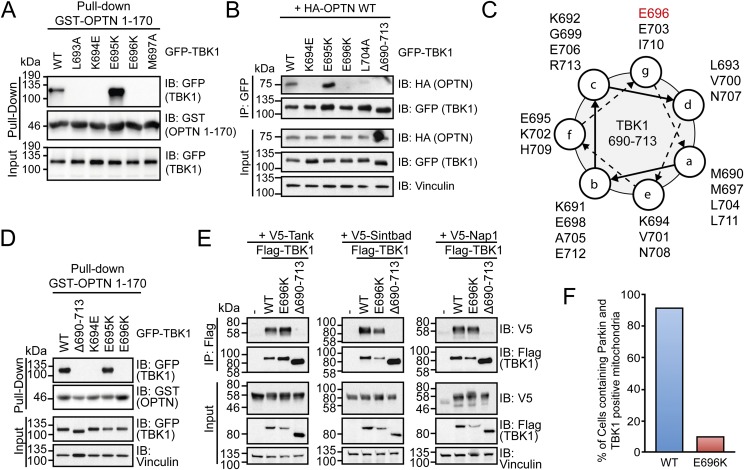
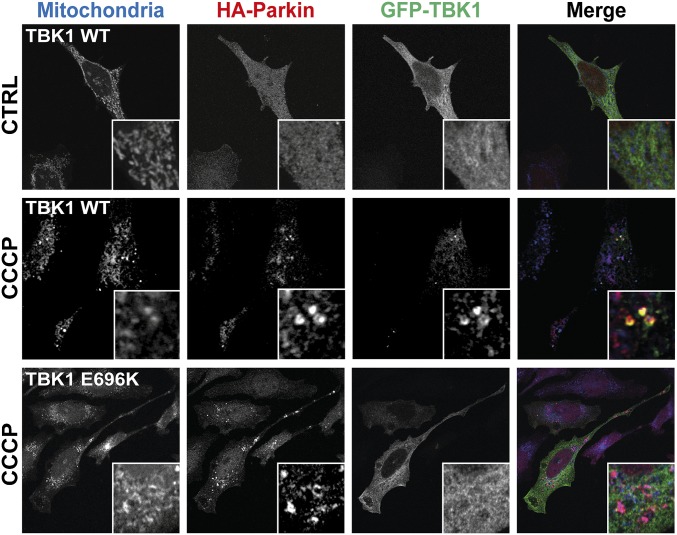
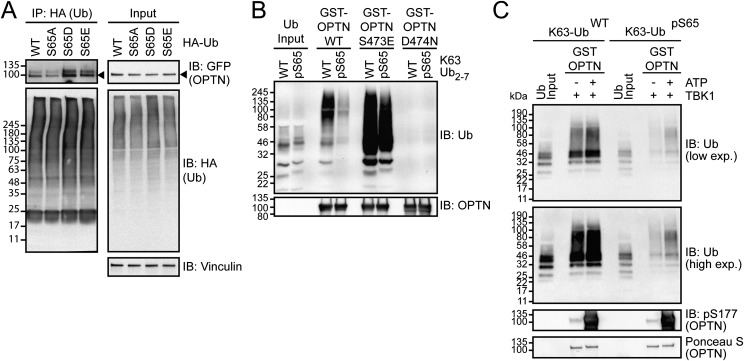
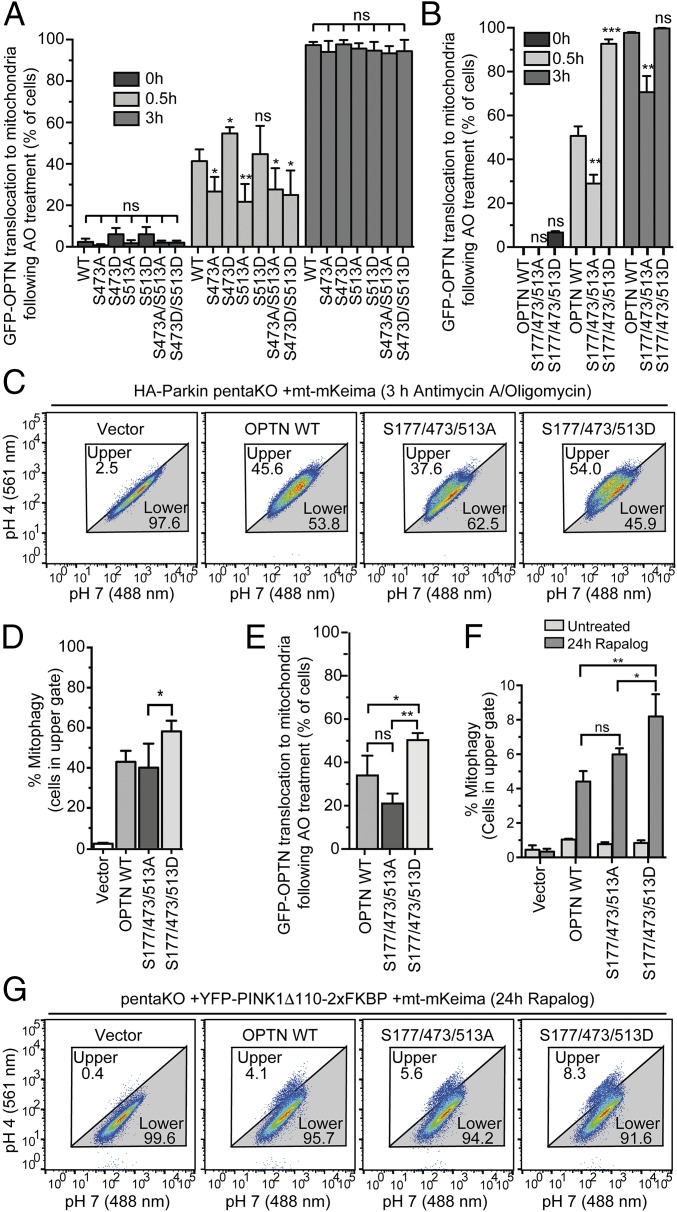
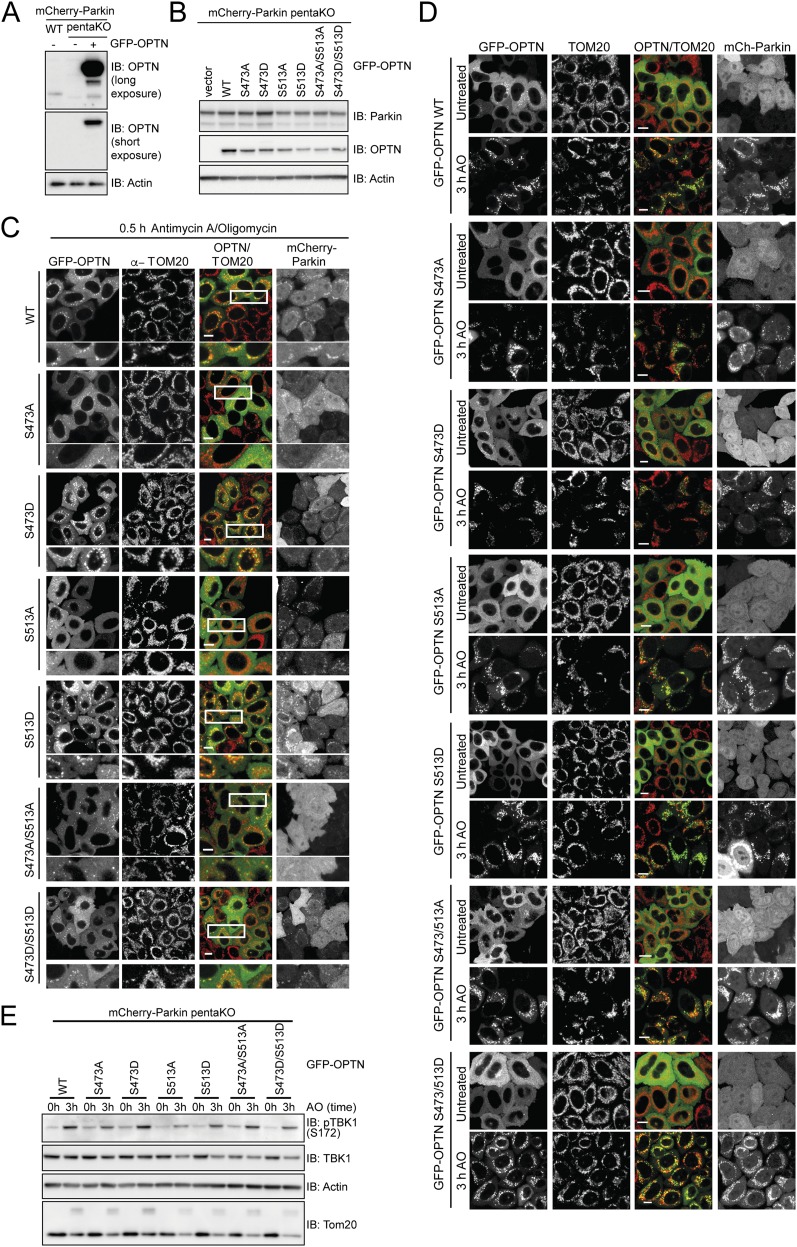
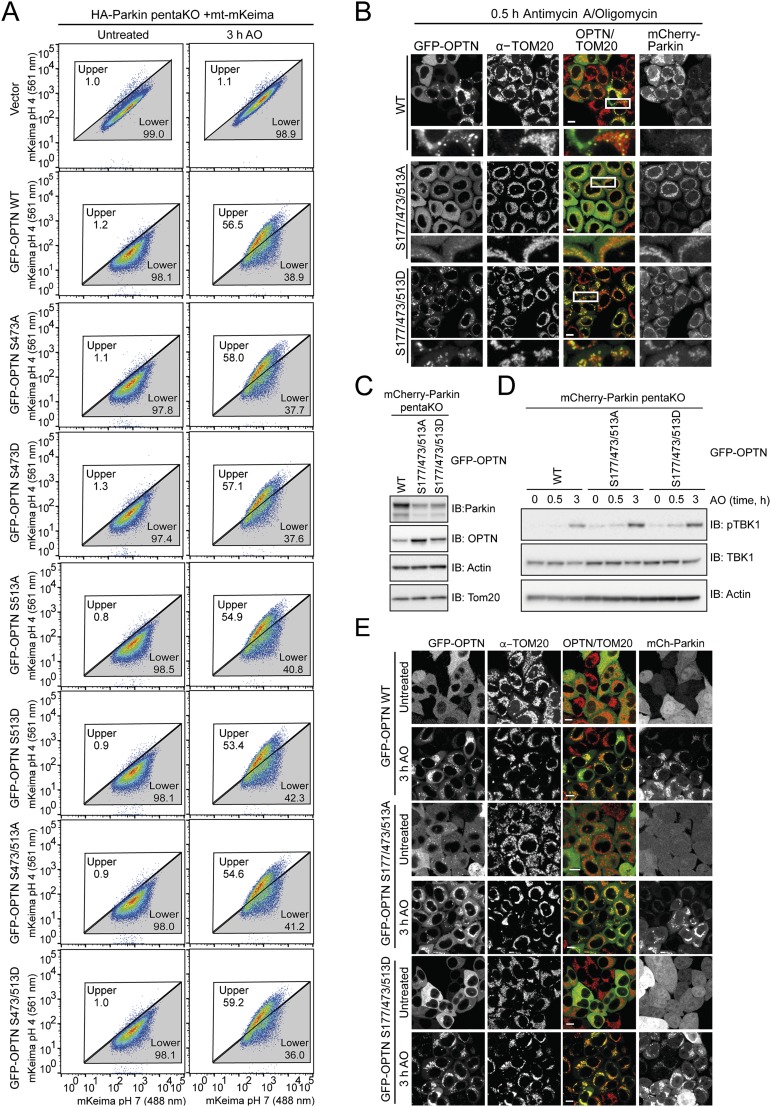
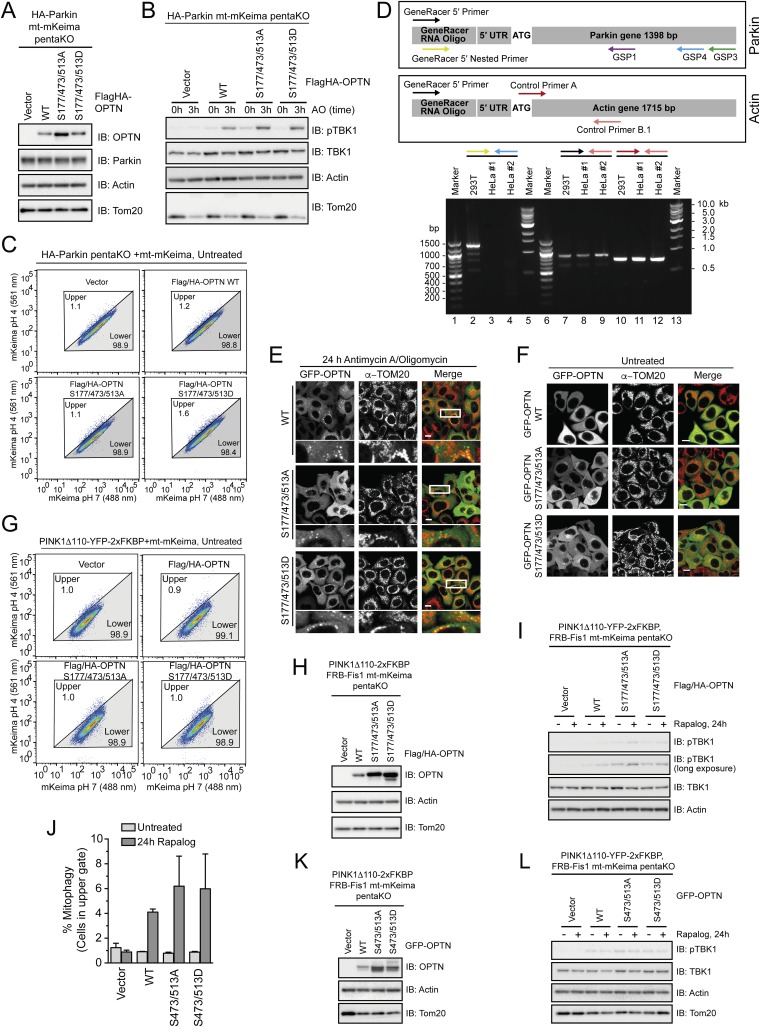
Selective autophagy of damaged mitochondria requires autophagy receptors optineurin (OPTN), NDP52 (CALCOCO2), TAX1BP1, and p62 (SQSTM1) linking ubiquitinated cargo to autophagic membranes. By using quantitative proteomics, we show that Tank-binding kinase 1 (TBK1) phosphorylates all four receptors on several autophagy-relevant sites, including the ubiquitin- and LC3-binding domains of OPTN and p62/SQSTM1 as well as the SKICH domains of NDP52 and TAX1BP1. Constitutive interaction of TBK1 with OPTN and the ability of OPTN to bind to ubiquitin chains are essential for TBK1 recruitment and kinase activation on mitochondria. TBK1 in turn phosphorylates OPTN's UBAN domain at S473, thereby expanding the binding capacity of OPTN to diverse Ub chains. In combination with phosphorylation of S177 and S513, this posttranslational modification promotes recruitment and retention of OPTN/TBK1 on ubiquitinated, damaged mitochondria. Moreover, phosphorylation of OPTN on S473 enables binding to pS65 Ub chains and is also implicated in PINK1-driven and Parkin-independent mitophagy. Thus, TBK1-mediated phosphorylation of autophagy receptors creates a signal amplification loop operating in selective autophagy of damaged mitochondria.

Keywords: OPTN; TBK1; mitophagy; phosphorylation; ubiquitin.


Conflict of interest statement

The authors declare no conflict of interest.

Figures

Fig. 1.
Fig. 1.
TBK1 phosphorylates autophagy receptors on multiple, autophagy-relevant sites. (A) Domain structure and TBK1-dependent phosphorylation sites (log2TBK1 KD/TBK1 WT ≥ 1) of individual autophagy receptors. (B and C) Mass spectrometric parent ion scans of the peptides corresponding to pS473 and pS513 on OPTN with increased relative abundance of phosphorylated peptides in cells expressing WT TBK1.
Fig. S1.
Fig. S1.
TBK1 directly mediates phosphorylation of UBDs. (A) Schematic representation of the experimental workflow for quantitative analysis of TBK1-dependent phosphorylation sites on autophagy receptors. (Left) Triple-SILAC workflow as for OPTN. (Right) Double-SILAC workflow as for NDP52, p62/SQSTM1, and TAX1BP1. (B) Alignment of OPTN, NEMO, and ABIN1-3 UBAN domains with conserved residues (light gray) and detected phosphosites (red letters, only for OPTN) highlighted. Consensus symbols: asterisk (*), identical residues, colon (:), conserved substitution, and period (.), semiconserved substitution. (C and D) In vitro kinase assay followed by mass spectrometric analysis: bacterially purified MBP–OPTN (C) or GST–p62/SQSTM1 (D) was incubated with 50 ng of recombinant TBK1 for 30 min at 30 °C. A sample (5%) of each reaction volume was used for immunoblotting (Left). (Right) Mass spectrometric fragment ion scan of the OPTN pS473 (C) and SQSTM1 pS403 (D) peptides. Identified b and y ions are labeled in blue and red, respectively.
Fig. 2.
Fig. 2.
Phosphorylated OPTN UBAN domain enhances binding to ubiquitin chains. (A) GFP immunoprecipitation of GFP–OPTN WT and indicated mutants from HEK293T cell lysates. (B and C) Indicated GST proteins were incubated with purified M1-linked (B) or K63-linked (C) tetra-Ub chains. (D) GST–OPTN WT and mutants were phosphorylated in vitro by TBK1 and subsequently incubated with purified Ub chains. Efficient phosphorylation of OPTN is indicated through an electrophoretic mobility shift. (A–D) Samples were subjected to immunoblot. Coomassie or Ponceau S staining show equal GST protein levels. (E) FRAP assay of recombinant mCherry–OPTN WT (●) or S473E (▪) on the surface of diUb-conjugated beads (Upper). Images were taken before and after photobleaching at indicated time points (Lower). (Scale bar, 10 µm.)
Fig. S2.
Fig. S2.
Phosphorylated OPTN UBAN domain enhances binding to ubiquitin chains. (A) GFP IP of GFP–OPTN WT and indicated UBAN mutants from HEK293T cell lysates. Coprecipitated, endogenous polyUb proteins were analyzed by immunoblotting. (B) HEK293T cells transiently expressing GFP–OPTN alone or GFP–OPTN and Myc–TBK1 WT were either left untreated or treated with a TBK1 inhibitor (BX795) for 3 h prior lysis, followed by GFP IP. Samples were analyzed by immunoblotting with the indicated antibodies. (C) GFP–OPTN WT or S473A or (D) GFP–p62/SQSTM1 WT or S403A were expressed alone or together with Myc–TBK1 WT or K38A (KM) in HEK293T cells, followed by GFP IP and immunoblotting. (E–G) GST pull-down: recombinant, immobilized GST–OPTN WT or GST–OPTN UBAN mutants were incubated with the indicated tetraUb (E), diUb (F), or polyUb (G) chains. Coprecipitated proteins were resolved by SDS/PAGE and immunoblotted with the indicated antibodies. (H) Multiple sequence alignment of OPTN, NEMO, and ABIN1 UBAN domains highlighting the position of OPTN S473, NEMO A310, and ABIN1 E471 close to the DFxxERxxRE UBAN core motif. (I) GST pull-down: recombinant, immobilized GST–NEMO and GST–OPTN WT or GST–NEMO and GST–OPTN UBAN mutants were incubated with K63 polyUb chains. Coprecipitated proteins were resolved by SDS/PAGE and immunoblotted with the indicated antibodies. (J) Phosphorylated GST–OPTN S473 was generated using an orthogonal phosphoserine translation system (27). Immobilized GST–OPTN WT and pS473 were incubated with purified K63-linked Ub chains. Coprecipitated Ub was analyzed by immunoblotting (IB: Ub). Equal GST protein levels were confirmed by Ponceau S and Coomassie staining. (K) HeLa cells stably expressing HA-Strep-Strep (HSS)-Parkin under a tetracycline inducible promoter (HeLa Flp-In T-REx HSS-Parkin cells) were preincubated with doxycyline for 48 h and transfected with GFP–OPTN WT or GFP–OPTN S177/473/513A. Cells were treated with AO and 100 nM calyculin A for 30 min. Extracts were resolved by SDS/PAGE and immunoblotted with the indicated antibodies.
Fig. 3.
Fig. 3.
TBK1 activation through mitophagy induction. (A, C, and D) Doxycycline (Dox)-inducible HA-Parkin HeLa cells were preincubated with Dox for 48 h before AO/CCCP treatment for (A and D) 80 min or (C) 60 min. (B) SH-SY5Y cells were treated with AO or CCCP for the indicated time. (C) WT or OPTN KO HeLa cells (nos. 3 and 6) stably expressing HA-Parkin were reconstituted with empty vector or GFP–OPTN for 30 h. (D) Cells were transfected with PINK1 or control siRNA for 48 h before treatment and lysis. (A–D) Cell lysates were subjected to immunoblot analysis with indicated antibodies. Active TBK1 was detected with a phosphospecific antibody (pTBK1 = pS172).
Fig. S3.
Fig. S3.
TBK1 activation through mitophagy induction. HeLa cells stably expressing HSS-Parkin under a tetracycline-inducible promoter (HeLa Flp-In T-REx HSS-Parkin cells) were preincubated with doxycyline for 48 h and cells were treated with AO for the indicated time points. Extracts were resolved by SDS/PAGE and immunoblotted with the indicated antibodies.
Fig. S4.
Fig. S4.
OPTN–TBK1 complex formation is blocked in ALS-associated human mutations. (A) HEK293T cells expressing GFP–TBK1 WT and indicated mutants were incubated with immobilized GST–OPTN 1–170. Binding of TBK1 variants was analyzed via immunoblot (IB). (B) Coimmunoprecipitation (co-IP) of GFP–TBK1 (WT and indicated mutants) and HA–OPTN WT from HEK293T cell lysates. (C) Helical wheel projection of the C-terminal coiled-coil and adapter-binding domain (amino acids 690–713) of TBK1 (using MARCOIL: toolkit.tuebingen.mpg.de/marcoil). (D) GST–OPTN 1–170 pull-down as in A, including TBK1 mutant delta690-713. (E) Co-IP of Flag–TBK1 (WT and indicated mutants) and V5-tagged Tank, Sintbad, and Nap1 from HEK293T cell lysates. Coprecipitated proteins were analyzed by immunoblotting with the indicated antibodies. (F) HeLa cells stably expressing HA-Parkin were transfected with TBK1 WT or E696K for 48 hours and treated with CCCP for 105 min. Quantification of cells containing Parkin- and TBK1-positive mitochondria from each condition. For representative images see Fig. 4.
Fig. 4.
Fig. 4.
OPTN–TBK1 complex formation is blocked by ALS-associated human mutations. Immunofluorescence of HeLa cells stably expressing HA-Parkin. Cells were transfected with GFP–TBK1 WT or E696K for 48 h and treated with CCCP for 105 min. Individual and merged images show mitochondria (blue), Parkin (red), and TBK1 (green).
Fig. S5.
Fig. S5.
Phosphorylation of Ub on Ser65 affects OPTN binding. (A) HEK293 cells were cotransfected with GFP–OPTN and HA–Ub WT or S65A, S65D, and S65E 30 h before lysis. After IP, with HA antibodies, samples were subjected to immunoblot (IB). (B and C) Pull-down of unphosphorylated or TcPINK1-phosphorylated recombinant K63-linked Ub chains and GST–OPTN variants. (C) GST–OPTN was preincubated with recombinant TBK1 for 30 min. Phosphorylation of OPTN S177 was confirmed by IB.
Fig. 5.
Fig. 5.
OPTN translocation to mitochondria and mitophagy are enhanced by OPTN phosphomimetic mutations. (A and B) mCherry–Parkin pentaKO cells expressing GFP–OPTN WT or mutants were treated with AO for 0.5 or 3 h and immunostained for TOM20. Quantification of cells with GFP–OPTN colocalized with TOM20. For representative images, see Figs. S6 C and D and S7 B and E. (C and D) HA-Parkin pentaKO cells expressing mt-mKeima and vector, Flag/HA–OPTN WT or mutants, as indicated, were treated with AO for 3 h and analyzed by FACS for lysosomal-positive mt-mKeima. (D) Graph depicting the average percent of cells in the upper gate from FACS analysis in C (n = 3). (E) PentaKO cells expressing GFP–OPTN WT or mutants were treated with AO for 24 h. For representative images, see Fig. S8 E and F. (F) Graph depicting the average percent of cells in the upper gate from FACS analysis of pentaKO cells expressing PINK1Δ110-YFP-2xFKBP, mt-mKeima and vector, Flag/HA–OPTN WT, or mutants, following treatment with rapalog for 24 h (n = 3). (G) Representative FACS data from rapalog-treated conditions from F are shown. For A, B, and E, 100 cells per condition were counted for n = 3 experiments. For A, B, D, E, and F, data are presented as mean ± SD, *P < 0.05, **P < 0.01, ***P < 0.005; ns, not significant. For the untreated conditions from C and G, see Fig. S8 C and G, respectively.
Fig. S6.
Fig. S6.
OPTN single- and double-Ser mutations have limited effect on translocation and mitophagy. (A) Western blot of WT or PentaKO HeLa cells with or without stable expression of GFP–OPTN for OPTN expression levels. (B) Western blot of mCherry–Parkin-expressing pentaKO cells reconstituted with GFP–OPTN WT and indicated mutants as used in C and D and Fig. 5A. Western blot shows equal expression levels. (C and D) Representative images of mCherry–Parkin pentaKO cells expressing OPTN WT or OPTN mutants as indicated were untreated or treated with antimycin A or oligomycin (AO) for 0.5 h (C) and 3 h (D) and immunostained for TOM20. (E) Cells from B–D were treated with AO for the indicated times and lysates immunoblotted for pTBK1.
Fig. S7.
Fig. S7.
Parkin-dependent OPTN translocation and mitophagy. (A) Representative FACS data from pentaKO cells stably expressing HA-Parkin, mt-mKeima, and GFP–OPTN WT or GFP–OPTN mutants as indicated were untreated or treated with AO for 3 h (n = 3 experiments). (B and E) Representative images of pentaKO cells expressing mCherry–Parkin and GFP–OPTN WT or mutants were untreated or treated with AO for 0.5 h (B) and 3 h (E) and immunostained with TOM20. (C) Western blot of mCherry–Parkin-expressing pentaKO cells reconstituted with GFP–OPTN WT and indicated mutants as used in B and E. (D) Cells as used in B, C, and E were treated with AO for times indicated then immunoblotted for pTBK1.
Fig. S8.
Fig. S8.
Parkin-dependent and -independent OPTN translocation and mitophagy. (A) Western blot of PentaKO cells expressing HA–Parkin, mt-mKeima, and vector or Flag/HA–OPTN WT or mutants for OPTN expression levels. (B) Cells as in A were treated with AO for times indicated, then immunoblotted for pTBK1. (C) Representative FACS data from untreated pentaKO cells expressing HA–Parkin, mt-mKeima, and vector or Flag/HA–OPTN WT or mutants. (D) Identification of 5′ cDNA ends of the Parkin gene by RLM-RACE using random hexamer primers and total RNA from both 293T (as positive control for Parkin expression; lanes 2, 7, and 10) and HeLa #1 [used in this study and authenticated by Johns Hopkins Genetic Resources Core Facility (GRCF) fragment analysis facility using short tandem repeat (STR) profiling; lanes 3, 8, and 11] and HeLa #2 cells (independent source; lanes 4, 9, and 12). Specific 5′ RACE PCR product using GeneRacer 5′ primer and Actin control primer B.1 (lanes 7–9 and Lower box) or internal primers for Actin (control primers A and B.1; lanes 10–12 and Lower box). GeneRacer 5′ primer and Parkin gene-specific primers (GSP1 or GSP3; Upper box) produce only faint smears without specific PCR products (data not shown). Specific 5′ RACE PCR product using GeneRacer 5′ nested primer and nested Parkin gene specific primer (GSP4; Upper box) from 293T (lane 2) but not HeLa cells (lanes 3 and 4). Multiple bands from 293T cells (lane 2) reflect splicing variants of Parkin. (E and F) Representative images from PentaKO cells expressing GFP-OPTN WT or mutants as indicated were (E) treated with AO for 24 h or (F) left untreated. Lower panels indicate an amplification of the regions contained within the white box. Scale bars, 10 μm. (G) Representative FACS data from untreated pentaKO cells expressing PINK1Δ110-YFP-2xFKBP, mt-mKeima, and vector or Flag/HA-OPTN WT or mutants as indicated. (H) Western blot of PentaKO cells expressing PINK1Δ110-YFP-2xFKBP, mt-mKeima, and vector or Flag/HA-OPTN WT or mutants for OPTN expression levels. (I) Cells as in G and Fig. 5 F and G were treated with Rapalog for 24 h then immunoblotted for pTBK1. (J) Graph depicting the average percent of cells in the upper gate from FACS analysis of pentaKO cells expressing PINK1Δ110-YFP-2xFKBP, mt mKeima, and vector, GFP-OPTN WT or mutants, following treatment with Rapalog for 24 h for n = 2 experiments. (K) Western blot of cells from J for OPTN expression levels. (L) Cells as in J and K were treated with Rapalog for 24 h then immunoblotted for pTBK1.

Comment in

Similar articles

Cited by

References

    1. Ohsumi Y. Historical landmarks of autophagy research. Cell Res. 2014;24(1):9–23. - PMC - PubMed
    1. Levine B, Mizushima N, Virgin HW. Autophagy in immunity and inflammation. Nature. 2011;469(7330):323–335. - PMC - PubMed
    1. Kirkin V, McEwan DG, Novak I, Dikic I. A role for ubiquitin in selective autophagy. Mol Cell. 2009;34(3):259–269. - PubMed
    1. Stolz A, Ernst A, Dikic I. Cargo recognition and trafficking in selective autophagy. Nat Cell Biol. 2014;16(6):495–501. - PubMed
    1. Herhaus L, Dikic I. Expanding the ubiquitin code through post-translational modification. EMBO Rep. 2015;16(9):1071–1083. - PMC - PubMed

Publication types