. 2016 Apr 19;113(16):4252-9.
doi: 10.1073/pnas.1603023113. Epub 2016 Mar 28.

Individual variability in human blood metabolites identifies age-related differences

Affiliations

Individual variability in human blood metabolites identifies age-related differences

Romanas Chaleckis et al. Proc Natl Acad Sci U S A. .

Abstract

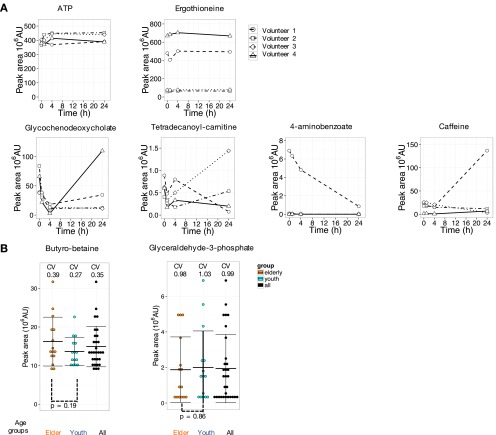
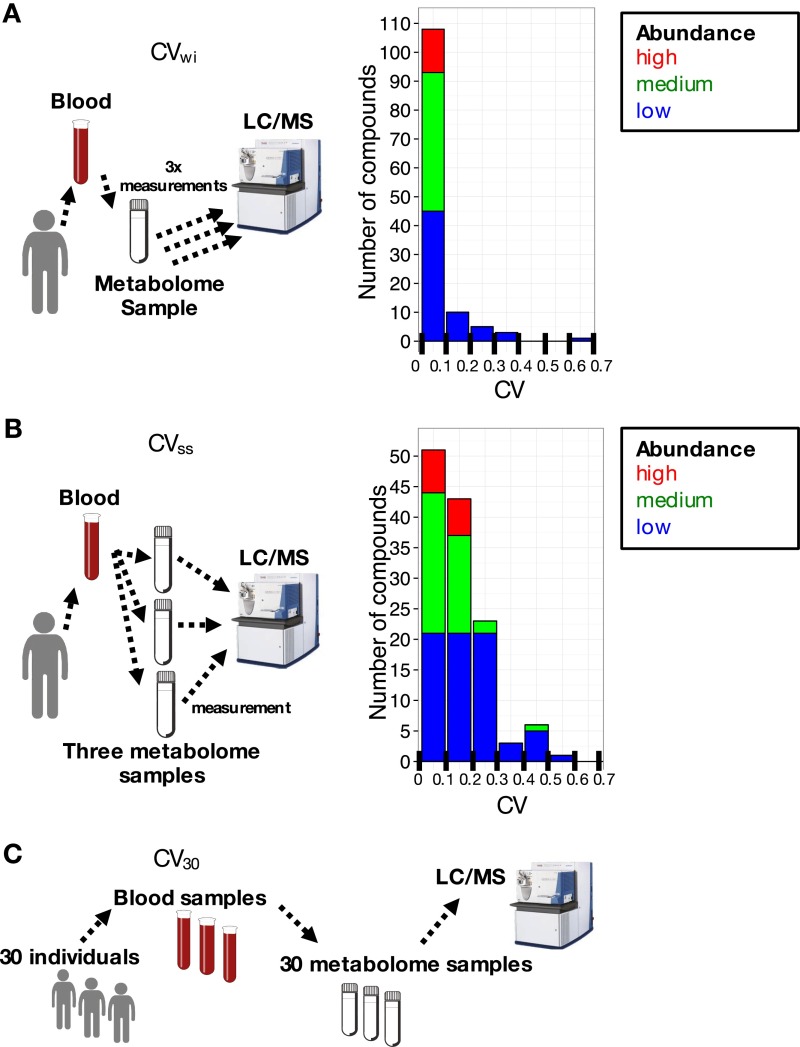
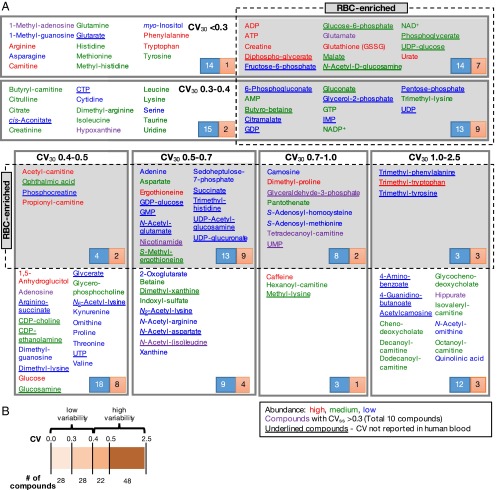
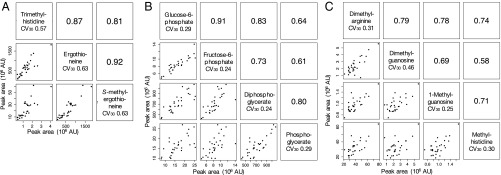
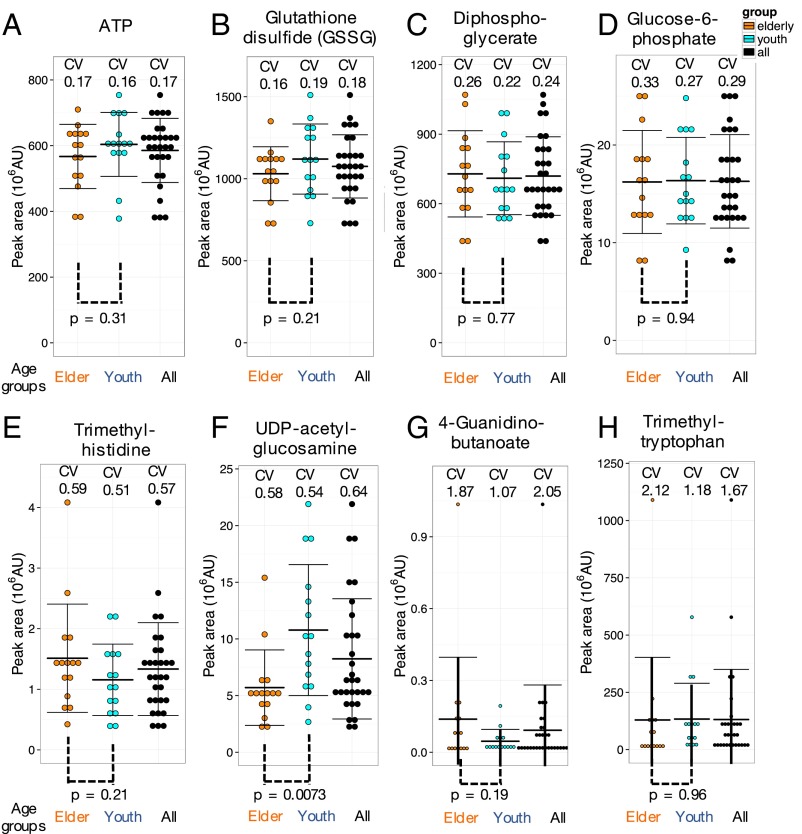
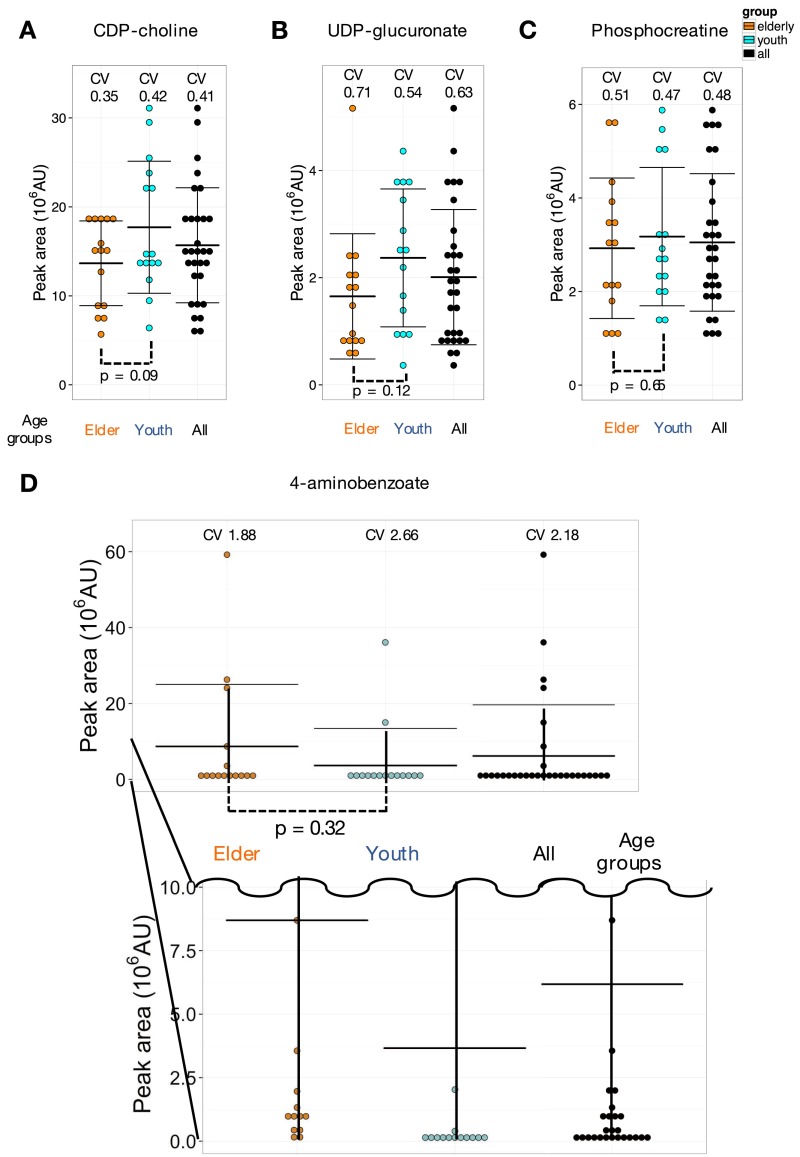
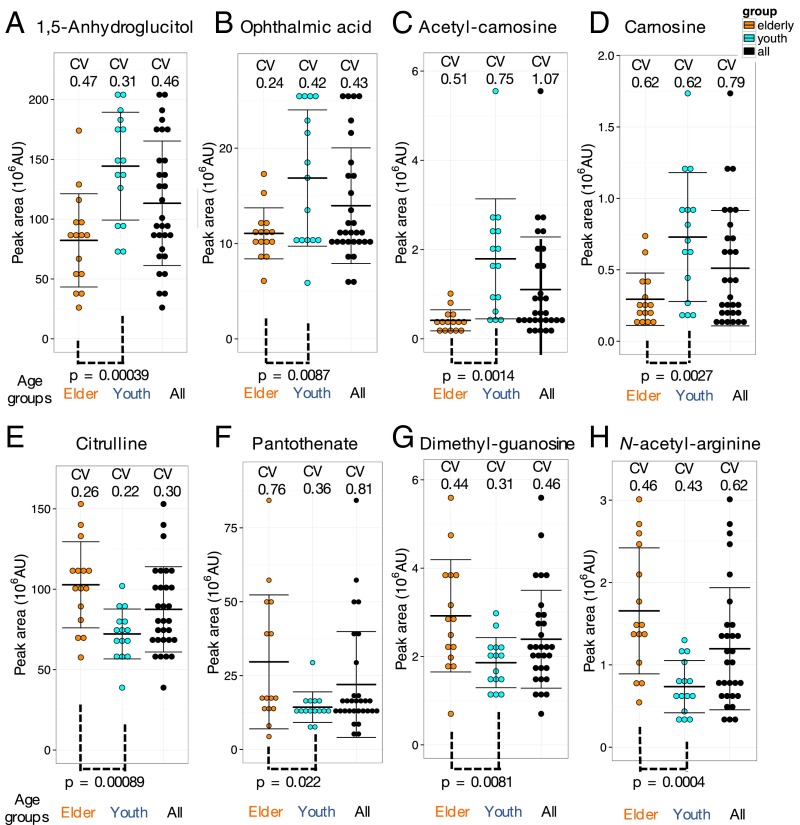
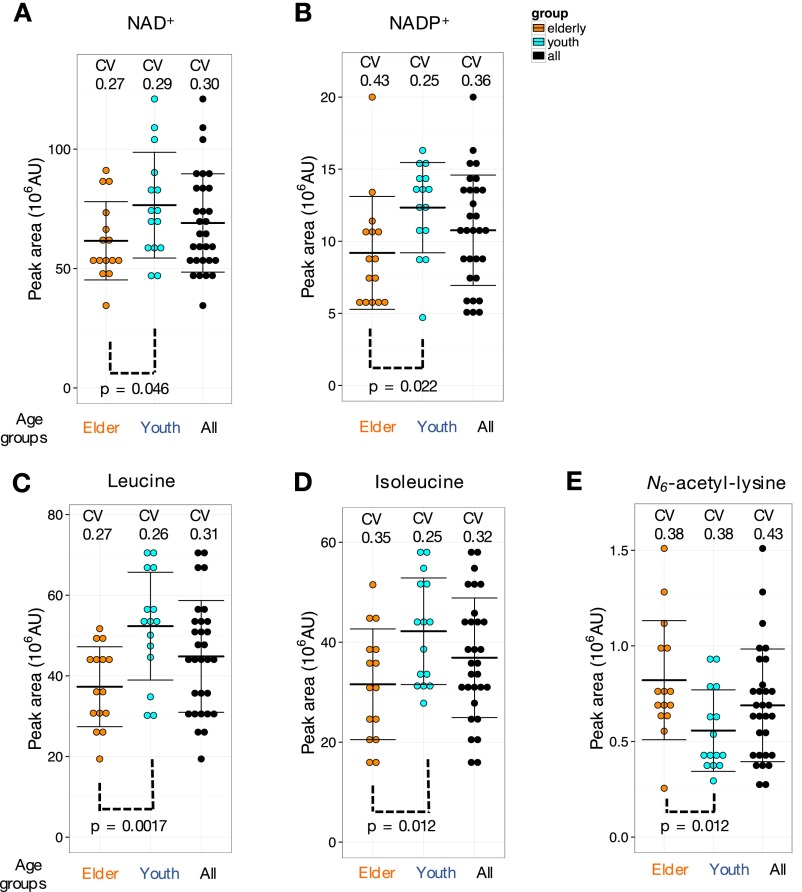
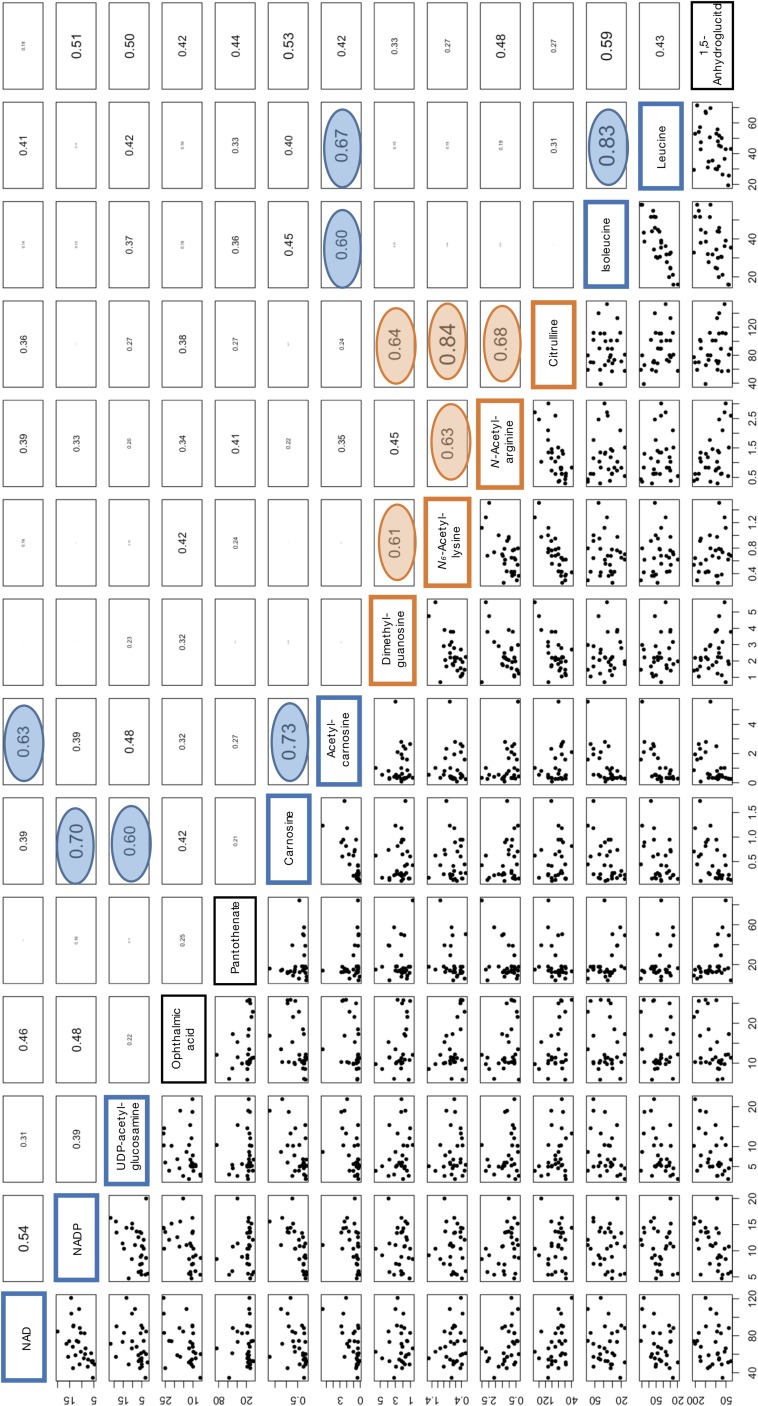
Metabolites present in human blood document individual physiological states influenced by genetic, epigenetic, and lifestyle factors. Using high-resolution liquid chromatography-mass spectrometry (LC-MS), we performed nontargeted, quantitative metabolomics analysis in blood of 15 young (29 ± 4 y of age) and 15 elderly (81 ± 7 y of age) individuals. Coefficients of variation (CV = SD/mean) were obtained for 126 blood metabolites of all 30 donors. Fifty-five RBC-enriched metabolites, for which metabolomics studies have been scarce, are highlighted here. We found 14 blood compounds that show remarkable age-related increases or decreases; they include 1,5-anhydroglucitol, dimethyl-guanosine, acetyl-carnosine, carnosine, ophthalmic acid, UDP-acetyl-glucosamine,N-acetyl-arginine,N6-acetyl-lysine, pantothenate, citrulline, leucine, isoleucine, NAD(+), and NADP(+) Six of them are RBC-enriched, suggesting that RBC metabolomics is highly valuable for human aging research. Age differences are partly explained by a decrease in antioxidant production or increasing inefficiency of urea metabolism among the elderly. Pearson's coefficients demonstrated that some age-related compounds are correlated, suggesting that aging affects them concomitantly. Although our CV values are mostly consistent with those CVs previously published, we here report previously unidentified CVs of 51 blood compounds. Compounds having moderate to high CV values (0.4-2.5) are often modified. Compounds having low CV values, such as ATP and glutathione, may be related to various diseases because their concentrations are strictly controlled, and changes in them would compromise health. Thus, human blood is a rich source of information about individual metabolic differences.

Keywords: CV value; aging markers; antioxidants; red blood cells; urea cycle.


Conflict of interest statement

The authors declare no conflict of interest.

Figures

Fig. S1.
Fig. S1.
Many human blood metabolites exhibit diel constancy. For the great majority of 126 compounds, diel fluctuations in abundance among four volunteers were negligible. (A) Peak levels of ATP and ergothioneine, like most compounds, hardly changed. The abundance of ergothioneine varied from person to person, however. Furthermore, about 10 compounds, including glycochenodeoxycholate, tetradecanoyl-carnitine, 4-aminobenzoate, and caffeine, showed exceptional 24-h variation. (B) Raw abundance data for two example compounds [butyro-betaine and glyceraldehyde-3-phosphate (G-3-P)], both enriched in RBCs, determined from 30 individual metabolomes, are shown as dotplots (each dot represents a single individual). Coefficients of variation were 0.35 and 0.99, respectively, for butyro-betaine and G-3-P. Ratios of maximum to minimum abundance are 3.7 and 29, respectively. Peak areas of metabolites were divided into 10 bins in each group. Error bars represent means ± SD.
Fig. S2.
Fig. S2.
Experimental variability for metabolite measurements is very small. CV distributions for 126 compounds are shown for (A) CVwi (three injections of the same blood sample preparation) and (B) CVss (three independently prepared samples from the same blood). (C) Coefficients of variation (CV30) for each compound from all 30 blood samples. Most compounds showed negligible CVwi whereas CVsss were more variable and considerably higher for certain metabolites.
Fig. 1.
Fig. 1.
Summary of CV profiles for 126 human blood metabolites. (A) The 126 blood compounds with coefficients of variation (CV30s) in six different ranges. (Upper) Values of <0.3 and 0.3∼0.4. (Lower) Values of 0.4∼0.5, 0.5∼0.7, 0.7∼1.0, and 1.0∼2.5). The lowest CV30 (<0.3) group contains 28 compounds. RBC-enriched compounds are highlighted in gray. The abundance of compounds is indicated by their peak areas: red, compounds with high peak areas [>108 AU (arbitrary unit)]; green, medium peak areas (108 ∼107 AU); blue, with low peak areas (<107 AU). Compounds for which CVs have not previously been reported in the literature are underlined. The number in the blue box represents all compounds listed in one CV range whereas the number in the red box represents compounds for which CVs reported here are previously unidentified. (B) Overview of compound numbers in low and high variability groups.
Fig. 2.
Fig. 2.
Clusters of human blood metabolites, defined by structure or function, show similar CVs. Blood data from all 30 volunteers revealed several groups of compounds with Pearson correlation coefficients of >0.7. Among these clusters were compounds related to ergothioneine (A), glycolytic pathway metabolites (B), and methylated compounds (C). Pearson correlation coefficients between pairs of compounds are shown in the upper right corners of the panels. In the lower left corners, actual compound levels are plotted for each pair.
Fig. 3.
Fig. 3.
Essential metabolites are almost invariant whereas modified metabolites (e.g., methylated amino acids) vary widely. Distributions of ATP (A), glutathione disulfide (GSSG) (B), diphosphoglycerate (C), glucose-6-phosphate (D), trimethyl-histidine (E), UDP-acetyl-glucosamine (F), 4-guanidinobutanoate (G), and trimethyl-tryptophan (H) in blood of 30 individuals. Black, orange, and azure dots represent all, elderly, and young subjects, respectively. Peak areas of metabolites were divided into 10 bins in each group. Error bars represent means ± SD.
Fig. S3.
Fig. S3.
Variations of CDP-choline, UDP-glucuronate, phosphocreatinine, and 4-aminobenzoate. (A and B) Two moderately variable metabolites, CDP-choline and UDP-glucuronate, are candidate compounds possibly differing between the two age groups. These compounds are used in biosynthesis and may reflect higher activity levels in younger people. Metabolite peak areas were divided into 10 bins per group. Error bars represent means ± SD. (C) Phosphocreatinine shows moderate variation among individuals, but no significant difference between young and elderly. Peak areas were divided into 10 bins per group. Error bars represent means ± SD. (D) 4-Aminobenzoate is highly variable among individuals. Peak areas were divided into 10 bins per group. Error bars represent means ± SD.
Fig. 4.
Fig. 4.
Identification of some blood metabolites that differ in abundance between young (29 ± 4 y of age) and elderly (81 ± 7 y of age) persons. 1,5-Anhydroglucitol (A), ophthalmic acid (B), acetyl-carnosine (C), and carnosine (D) are higher in young subjects whereas citrulline (E), pantothenate (F), dimethyl-guanosine (G), and N-acetyl-arginine (H) are higher in the elderly. Metabolite peak areas were divided into 10 bins in each group. Error bars represent means ± SD. P values between age groups are in the range of 0.022 and 0.00039.
Fig. S4.
Fig. S4.
Additional metabolites showing different patterns of abundance between young and elderly groups. NAD+ (A), NADP+ (B), leucine (C), and isoleucine (D) showed higher levels in the youth. N6-acetyl-lysine is higher in elderly people (E). Peak areas of metabolites were divided into 10 bins in each group. Error bars represent means ± SD. The range of P values was 0.0017–0.046.
Fig. S5.
Fig. S5.
Correlation values for all 14 age-related human blood compounds. See Correlations Among Age-Related Compounds.

Comment in

References

    1. Rapoport SM, Schewe T, Thiele B-J. Maturational breakdown of mitochondria and other organelles in reticulocytes. In: Harris JR, editor. Erythroid Cells. Springer; New York: 1990. pp. 151–194.
    1. van Wijk R, van Solinge WW. The energy-less red blood cell is lost: Erythrocyte enzyme abnormalities of glycolysis. Blood. 2005;106(13):4034–4042. - PubMed
    1. Bax BE, Bain MD, Talbot PJ, Parker-Williams EJ, Chalmers RA. Survival of human carrier erythrocytes in vivo. Clin Sci (Lond) 1999;96(2):171–178. - PubMed
    1. Chaleckis R, et al. Unexpected similarities between the Schizosaccharomyces and human blood metabolomes, and novel human metabolites. Mol Biosyst. 2014;10(10):2538–2551. - PubMed
    1. Fernie AR, Trethewey RN, Krotzky AJ, Willmitzer L. Metabolite profiling: From diagnostics to systems biology. Nat Rev Mol Cell Biol. 2004;5(9):763–769. - PubMed

Publication types