. 2016 Apr 12;113(15):E2162-71.
doi: 10.1073/pnas.1603534113. Epub 2016 Mar 28.

Myofibroblasts are distinguished from activated skin fibroblasts by the expression of AOC3 and other associated markers

Affiliations

Myofibroblasts are distinguished from activated skin fibroblasts by the expression of AOC3 and other associated markers

Lin-Ting Hsia et al. Proc Natl Acad Sci U S A. .

Abstract

Pericryptal myofibroblasts in the colon and rectum play an important role in regulating the normal colorectal stem cell niche and facilitating tumor progression. Myofibroblasts previously have been distinguished from normal fibroblasts mostly by the expression of α smooth muscle actin (αSMA). We now have identified AOC3 (amine oxidase, copper containing 3), a surface monoamine oxidase, as a new marker of myofibroblasts by showing that it is the target protein of the myofibroblast-reacting mAb PR2D3. The normal and tumor tissue distribution and the cell line reactivity of AOC3 match that expected for myofibroblasts. We have shown that the surface expression of AOC3 is sensitive to digestion by trypsin and collagenase and that anti-AOC3 antibodies can be used for FACS sorting of myofibroblasts obtained by nonenzymatic procedures. Whole-genome microarray mRNA-expression profiles of myofibroblasts and skin fibroblasts revealed four additional genes that are significantly differentially expressed in these two cell types: NKX2-3 and LRRC17 in myofibroblasts and SHOX2 and TBX5 in skin fibroblasts. TGFβ substantially down-regulated AOC3 expression in myofibroblasts but in skin fibroblasts it dramatically increased the expression of αSMA. A knockdown of NKX2-3 in myofibroblasts caused a decrease of myofibroblast-related gene expression and increased expression of the fibroblast-associated gene SHOX2, suggesting that NKX2-3 is a key mediator for maintaining myofibroblast characteristics. Our results show that colorectal myofibroblasts, as defined by the expression of AOC3, NKX2-3, and other markers, are a distinctly different cell type from TGFβ-activated fibroblasts.

Keywords: AOC3; NKX2-3; myofibroblasts; tumor microenvironment; α smooth muscle actin.


Conflict of interest statement

The authors declare no conflict of interest.

Figures

Fig. 1.
Fig. 1.
The MF marker mAb PR2D3 recognizes the AOC3 protein in human colonic lysates. (A) Immunofluorescence staining of cryostat sections of normal colon and CRC tissue using PR2D3 (green) for MFs and AUA-1 (red) to identify epithelial cells. (B) The immunoblot of human colonic smooth muscle (SM) lysate using mAb PR2D3 shows a band of about 150 kDa in a native (nonreduced) sample.
Fig. S1.
Fig. S1.
Mascot search result for protein identification of AOC3 and MYH11 using MALDI-TOF-MS/MS. (A) Electrophoretic analysis of proteins immunoprecipitated using PR2D3 and the IgG isoform under reduced and native conditions. The bands indicated by arrows were excised, digested with trypsin, and analyzed by MALDI-TOF/TOF. The marker lane is included on the left with sizes in kDa. The heavily stained lower-molecular-weight bands are Ig products. The mascot score histogram on the right showed AOC3 as the one significant match for the 100-kDa band. The only significant mascot score histogram match for the 250-kDa band was MYH11. The protein score on the x axis is −10*Log(P), where P is the probability that the observed match is a random event. Protein scores greater than 56 are considered significant. (B) Protein immunoblot of human colonic smooth muscle lysate with anti-AOC3 (TK8-14) showing a band of about 150 kDa in the native (nonreduced) sample giving the same expression profile as PR2D3. (C) Western blot of immunoprecipitated smooth muscle lysate probed with PR2D3. The same antigen was recognized by anti-AOC3 (TK8-14) and PR2D3.
Fig. 2.
Fig. 2.
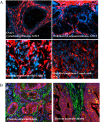
AOC3 is expressed on MFs in human normal and cancer tissues. (A) Confocal immunofluorescence of pericryptal MFs in a normal colon cryostat section. AOC3 (TK8-14) is shown in green and DAPI in blue in all cases where not otherwise mentioned. (Magnification: 100×.) The red arrow identifies the MFs. (B) Paraffin-embedded sections of normal colon were double-stained using AOC3 antibody (green) (393112; R&D Systems) and anti-αSMA (red) (1A4; Sigma). DAPI staining is shown in blue. The yellow staining in the merged image shows that the expression of AOC3 colocalizes with αSMA on MFs. (C) Anti-AOC3 (red) (393112; R&D Systems) is expressed on MFs in various FFPE normal and cancerous human tissues (colon, rectum, stomach, and prostate). (Magnification: 20×.) (D) AOC3 expression on MFs in FFPE CRC lymph node metastases. (i) Micrometastasis. (ii) Macrometastasis. (Magnification: 5×.) (iii) Macrometastasis. (Magnification: 20×.) AOC3 (393112; R&D) is shown in green, and AUA-1 is shown in red. (E) FFPE MFs in breast cancer are AOC3 but αSMA+. Several different cases were tested; one representative example is shown. (Magnification: 20×.) AOC3 (393112; R&D) is shown in red, and anti-αSMA (1A4; Sigma) is shown in green.
Fig. S2.
Fig. S2.
AOC3 expression in human tumor tissues. (A) The anti-AOC3 mAb (Clone 393112) staining shows AOC3 expression (red) on MFs in ovarian, endometrial, and liver cancers and in Hodgkin’s lymphoma lymph nodes. (B) Costaining with AOC3 (green) for MFs and AUA1 (red) to identify epithelial cells of prostate and rectum carcinomas. Blue staining is DAPI. (Magnification: 20×.)
Fig. 3.
Fig. 3.
AOC3 is expressed in primary MFs but not in fibroblasts. (A) Immunofluorescent staining of CCD 18CO cells and foreskin fibroblast cells with AOC3 mAb (TK8-14) and PR2D3. (Magnification: 20×.) (B) Western blot using AOC3 mAb (TK8-14) detected a 150-kDa protein in CCD 18CO, myo2020, myo1998, and myo6544 cells but not in foreskin fibroblasts (F. Fibro) or skin fibroblasts (Skin Fibro). Tubulin was used as the loading control. (C) Flow cytometric analysis of primary cell cultures (myo6544 and myo1998) and CCD 18CO cells. Fibroblasts (foreskin fibroblasts and two sets of adult skin fibroblasts) and epithelial cells (SW1222 and LS174T) show that MFs are AOC3+, whereas fibroblasts and epithelial cells do not express AOC3. Isotype control is shown in red, and anti-AOC3 (TK8-14) is shown in green. (D) mRNA-expression levels of AOC3 and ACTA2 in MF and fibroblast cultures. AOC3 and ACTA2 mRNA expression in eight cell lines (four MF cultures and four fibroblast cultures) was measured by the Affymetrix Human Genome U133 Plus 2.0 microarray. The mRNA-expression levels along the y axis are actual ΔCt fluorescence intensities. (E) AOC3 functions as an SSAO enzyme in MFs. The enzyme activity of MFs was determined by SSAO-mediated H2O2 production. The siRNA for AOC3, the SSAO inhibitor semicarbazide (SEM) (1 mM), and the MAO-A inhibitor Clorgyline (1 mM) were added under serum-free conditions for 48 h. The enzyme activity in untreated CCD 18CO control cells was set to 100%. The P values are based on t tests for the difference between the treated and the serum-free control samples: **P < 0.001.
Fig. S3.
Fig. S3.
Trypsin impaired the apparent expression of AOC3 protein on CCD 18CO cells. (A) Cell suspensions were prepared either by trypsin digestion (green) or EDTA solution (blue), and the cells were labeled with anti-AOC3 (TK 8-14)-APC. Isotype-APC (red) was used as the control. (B) Live cells from three primary MF cultures (myo6544, myo1998, and myo6526) and CCD 18CO cells were stained with anti-AOC3 (TK 8-14) and PR2D3. The primary antibodies were detected with a secondary antibody to mouse Ig conjugated to APC (green). The secondary antibody alone was used as a negative control (red). (C) RT-qPCR validation of AOC3 mRNA expression in 11 MF and two fibroblast cultures. Expression levels are determined by RT-qPCR as described in Materials and Methods and are given as linearized ΔCt values along the y axis. Red columns represent MF cultures; blue columns represent fibroblast cultures.
Fig. 4.
Fig. 4.
FACS isolation of MFs. (A) Flow cytometry-based separation of a 1:1 mixture of epithelial cells (SW1222) and primary MFs (myo6544). MFs were labeled with anti–AOC3-APC (TK8-14), and epithelial cells were labeled with AUA1-FITC. (B) FACS isolation of MFs from fresh tissue. Cells expressing AOC3 (mAb TK8-14) were gated using the Alexa-488 fluorescent signals (y axis) with a cutoff based on unstained samples. The x axis is forward scatter. (C) Immunofluorescent staining of AOC3 FACS-sorted cells with anti-vimentin (3B4; Dako) on fixed cells and anti-AOC3 (TK8-14) and PR2D3 on live cells. (Magnification: 20×.)
Fig. S4.
Fig. S4.
Surface expression of AOC3 is sensitive to proteolytic digestion by collagenase and trypsin. Fresh patient-derived colorectal tissue was mechanically disrupted and then treated with either (A) collagenase type 4 for 3 h or (B) nonenzymatic EDTA-based cell dissociating solution (Sigma) for 1 h at 37 °C, as described in Materials and Methods. Cells were stained separately with anti-AOC3 (TK8-14) conjugated with PE (phycoerythrin), anti-EpCAM (AUA1, conjugated with PE), or PE IgG isotype control. R1-gated cells were negative to AOC3 staining with collagenase digestion, whereas the nonenzymatically isolated cells in the same gate contained anti-AOC3+ cells. When these positively staining cells were rerun on the FACS after trypsin treatment, the staining by anti-AOC3 was lost.
Fig. 5.
Fig. 5.
Identification of candidate markers NKX2-3 for MFs and SHOX2 for fibroblasts. (A) NKX2-3, SHOX2, LRRC17, and TBX5 mRNA expression in MFs and fibroblasts measured by the Affymetrix Human Genome U133 Plus 2.0 microarray. NKX2-3 and LRRC17 are highly expressed in MFs; SHOX2 and TBX5 are highly expressed in fibroblasts. (B) RT-qPCR verification of NKX2-3 and SHOX2 mRNA expression in MF and fibroblast cultures. Expression levels are given as linearized ΔCt values generated as described in Materials and Methods. The NKX2-3 mRNA levels in skin fibroblasts and foreskin fibroblasts were too low to be determined (ND: no data). Columns in red represent MF cultures; columns in blue represent fibroblast cultures. (C) NKX2-3 protein is expressed in MF cultures (CCD 18CO, myo6769C, myo1998, and myo6526 cells) but not in fibroblast cultures. Western blot with anti NKX2-3 (polyclonal; LSBio). Anti-tubulin was used as a control. (D) The mRNA-expression levels of AOC3 and NKX2-3 in AOC3-sorted MFs. Expression levels were determined by RT-qPCR and are given as converted linearized ΔCt values. Red columns represent AOC3-sorted cells; the blue column represents skin fibroblast cultures. The NKX2-3 mRNA levels of skin fibroblasts and SHOX2 mRNA levels of AOC3-sorted cells were not determined, because there was no measurable Ct for the sample, indicating a very low or absent amount of mRNA.
Fig. S5.
Fig. S5.
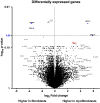
Volcano plot representing microarray data comparing MFs and fibroblasts. Microarray gene-expression profiles of MF cultures (positive fold-change) and fibroblast cultures (negative fold-change) were plotted with the log2 (fold-change) on the x axis and log10 (corrected P value) on the y axis. Genes were identified as having a significant change in expression if the corrected P value was less than 0.05 and the fold-change was greater than 4 (blue dots).
Fig. 6.
Fig. 6.
Regulation of AOC3, NKX2-3, and SHOX2 expression in MFs. (A) Serum starvation increased AOC3 expression in CCD 18CO cells. Cells were cultured with 10% FBS or without serum for 24, 48, 72, or 96 h. AOC3 protein expression was measured using Western blots with anti-AOC3 (TK8-14) and with anti-tubulin as the control. (B) AOC3 expression is down-regulated by TGFβ treatment. Cells were incubated with or without 10 ng/mL TGFβ in serum-free medium or in medium containing 10% normal serum for 24, 48, 72, or 96 h, and AOC3 levels were determined by Western blots as previously described. (C) The inhibitory effect of TGFβ on AOC3 expression in CCD 18CO cells. The AOC3 mRNA levels were determined using RT-qPCR. Cells were serum starved and then were treated with TGFβ (10 ng/mL) at the indicated times. The blue line indicates serum-starved levels; the red line indicates the levels after the addition of TGFβ. The Ct values were normalized to UBC, and the fold-change was calculated relative to cells in serum-free conditions for 24 h (y axis). (D) AOC3 expression is not inducible in foreskin fibroblast cells. Foreskin fibroblasts were serum starved (SF) and treated with TGFβ for 72 h. Protein expression was measured using Western blots with anti-AOC3 (TK8-14) and anti-tubulin. CON, control. (E) Skin fibroblast mRNA expression of AOC3, ACTA2, and SHOX2 following TGFβ treatment. Cells were grown in normal 10% serum (NS) or under serum-free conditions with (SF/TGFβ) or without TGFβ (10 ng/mL) treatment for 48 h. Expression levels were determined using RT-qPCR and are given as linearized ΔCt values. The NKX2-3 mRNA level was undetectable. The ΔCt values for NKX2-3, AOC3, and SHOX2 are given on the left y axis, and the ΔCt values for ACTA2 are given on the right y axis. (F) The expression of ACTA2, MYH11, and SHOX2 is regulated by NKX2-3 in MFs. Relative mRNA-expression levels were determined using RT-qPCR following transfection of CCD 18CO and Myo6526 cells with siNKX2-3 or with the scrambled sequence (siCON) as control. Raw Ct values were normalized to UBC, and the fold-changes relative to siCON were calculated using the ΔΔCt method. (G) AOC3 silencing decreases NKX2-3 expression in CCD 18CO cells. The expression levels of NKX2-3, SHOX2, MYH11, and ACTA2 in siAOC3-transfected relative to siCON-transfected CCD 18CO cells were determined using RT-qPCR. Raw Ct values were normalized to UBC, and the fold-changes relative to siCON were calculated using the ΔΔCt method. The P values are based on t tests for the difference between the treated and the serum-free control samples: **P < 0.001. (H) Schematic model for feedback gene regulation in MFs and fibroblasts.
Fig. S6.
Fig. S6.
Serum starvation increased AOC3 expression in CCD 18CO cells. (A) CCD 18CO cells were cultured with 10% FBS or without serum for 24, 48, 72, or 96 h. The AOC3 mRNA level was determined using RT-qPCR. Ct values were normalized to UBC, and fold-change was calculated relative to cells cultured for 24 h with 10% FBS. *P < 0.01; **P < 0.001 compared with the 10% FBS condition. (B) The inhibitory effect of TGFβ was assessed by RT-qPCR. CCD 18CO cells were incubated with or without TGFβ (10 ng/mL) in serum-free or normal serum-containing medium for 48 or 72 h. Ct values were normalized to UBC, and fold-change was calculated relative to cells cultured for 48 h with 10% FBS. **P < 0.001 compared with both the 10% FBS condition and with TGFβ in the serum-free condition. (C) The inhibitory effect of TGFβ on AOC3 protein expression. The AOC3 protein-expression level was measured by Western blot using anti-AOC3 (TK8-14) and with anti-tubulin as a loading control. Cells were cultured under serum-free conditions.
Fig. S7.
Fig. S7.
αSMA expression in primary MFs and fibroblasts under normal culture and with TGFβ treatment. (A) Immunofluorescent staining of five MF and five normal fibroblast cultures with αSMA (1A4; Sigma) cultured in normal, serum-containing medium (10% FBS). (Magnification: 20×.) (B) TGFβ-induced αSMA expression in CCD 18CO cells and foreskin fibroblast cells cultured in serum-free conditions. Cells were stained with αSMA (shown as green in CCD 18CO cells and red in foreskin fibroblasts). (Magnification: 5×.)
Fig. S8.
Fig. S8.
Heterogeneous expression of αSMA and MYH11 in AOC3-sorted MFs. Immunofluorescent staining with αSMA (1A4; Sigma) and MYH11 [EPR5336(B); Abcam] in fixed AOC3-sorted MFs. (Magnification: 20×.)

Similar articles

Cited by

References

    1. Donnellan WL. The structure of the colonic mucosa. The epithelium and subepithelial reticulohistiocytic complex. Gastroenterology. 1965;49(5):496–514. - PubMed
    1. Kaye GI, Lane N, Pascal RR. Colonic pericryptal fibroblast sheath: Replication, migration, and cytodifferentiation of a mesenchymal cell system in adult tissue. II. Fine structural aspects of normal rabbit and human colon. Gastroenterology. 1968;54(5):852–865. - PubMed
    1. Pascal RR, Kaye GI, Lane N. Colonic pericryptal fibroblast sheath: Replication, migration, and cytodifferentiation of a mesenchymal cell system in adult tissue. I. Autoradiographic studies of normal rabbit colon. Gastroenterology. 1968;54(5):835–851. - PubMed
    1. Gabbiani G, Ryan GB, Majne G. Presence of modified fibroblasts in granulation tissue and their possible role in wound contraction. Experientia. 1971;27(5):549–550. - PubMed
    1. Majno G, Gabbiani G, Hirschel BJ, Ryan GB, Statkov PR. Contraction of granulation tissue in vitro: Similarity to smooth muscle. Science. 1971;173(3996):548–550. - PubMed

Publication types

MeSH terms