. 2016 May 24;7(21):30461-78.
doi: 10.18632/oncotarget.8458.

MicroRNA-375/SEC23A as biomarkers of the in vitro efficacy of vandetanib

Affiliations

MicroRNA-375/SEC23A as biomarkers of the in vitro efficacy of vandetanib

Sandra Lassalle et al. Oncotarget. .

Abstract

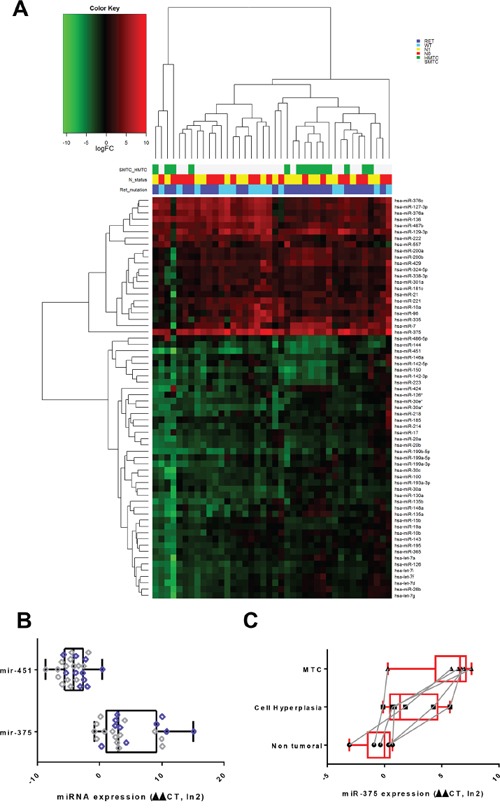
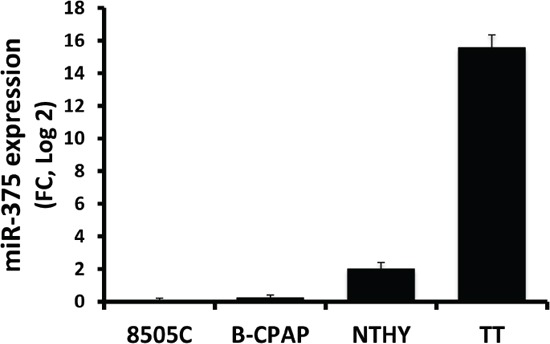
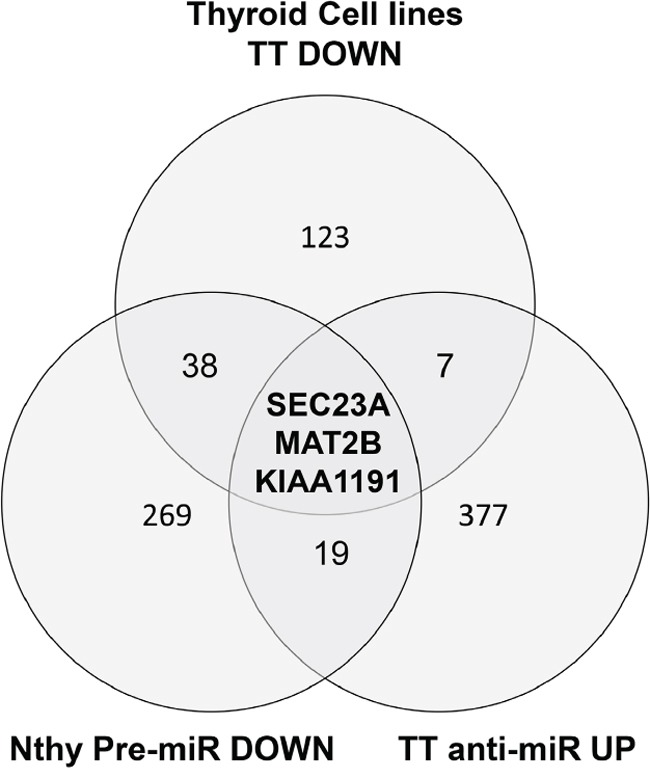
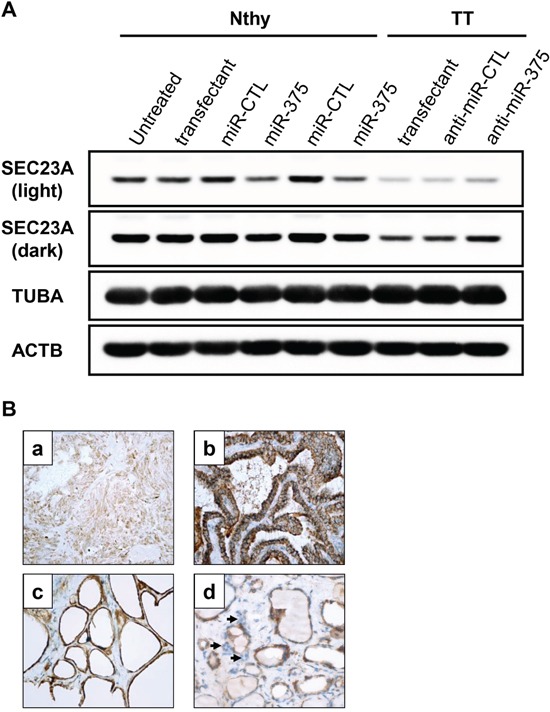
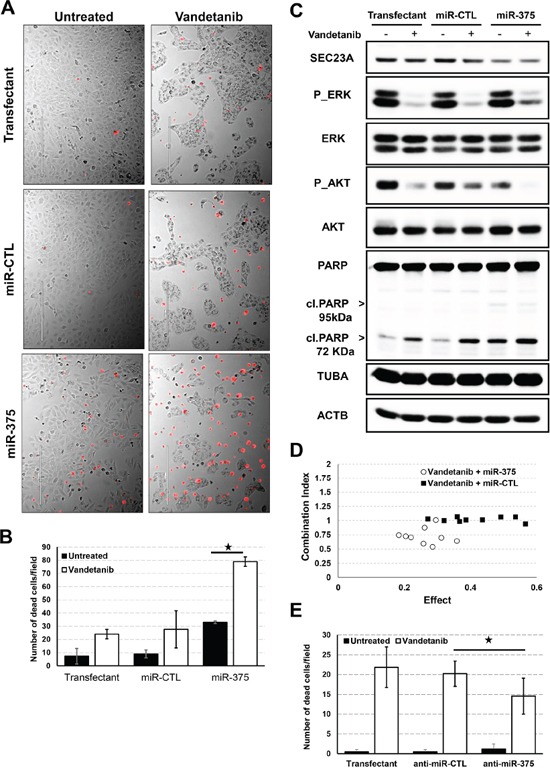
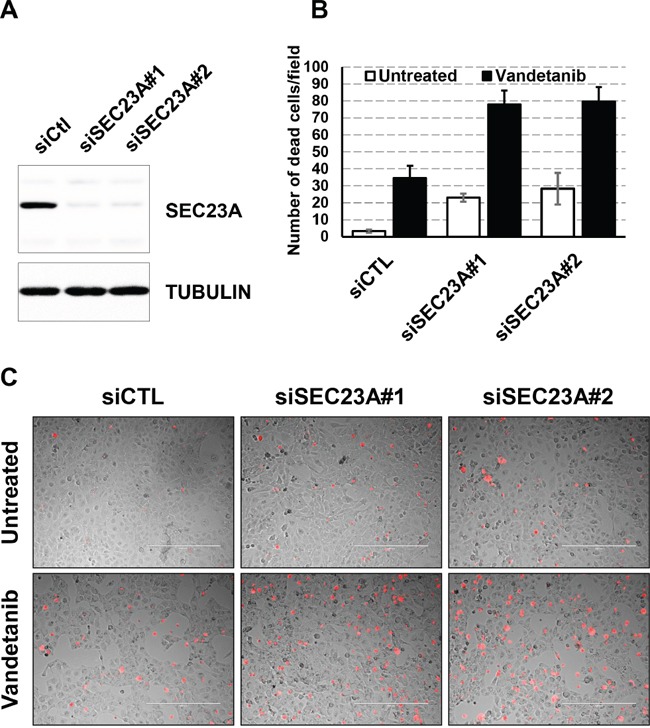
In this study, we performed microRNA (miRNA) expression profiling on a large series of sporadic and hereditary forms of medullary thyroid carcinomas (MTC). More than 60 miRNAs were significantly deregulated in tumor vs adjacent non-tumor tissues, partially overlapping with results of previous studies. We focused our attention on the strongest up-regulated miRNA in MTC samples, miR-375, the deregulation of which has been previously observed in a variety of human malignancies including MTC. We identified miR-375 targets by combining gene expression signatures from human MTC (TT) and normal follicular (Nthy-ori 3-1) cell lines transfected with an antagomiR-375 inhibitor or a miR-375 mimic, respectively, and from an in silico analysis of thyroid cell lines of Cancer Cell Line Encyclopedia datasets. This approach identified SEC23A as a bona fide miR-375 target, which we validated by immunoblotting and immunohistochemistry of non-tumor and pathological thyroid tissue. Furthermore, we observed that miR-375 overexpression was associated with decreased cell proliferation and synergistically increased sensitivity to vandetanib, the clinically relevant treatment of metastatic MTC. We found that miR-375 increased PARP cleavage and decreased AKT phosphorylation, affecting both cell proliferation and viability. We confirmed these results through SEC23A direct silencing in combination with vandetanib, highlighting the importance of SEC23A in the miR-375-associated increased sensitivity to vandetanib.Since the combination of increased expression of miR-375 and decreased expression of SEC23A point to sensitivity to vandetanib, we question if the expression levels of miR-375 and SEC23A should be evaluated as an indicator of eligibility for treatment of MTC patients with vandetanib.

Keywords: medullary thyroid carcinoma; microRNA; microRNA-375; treatment; vandetanib.


Conflict of interest statement

All authors fully declare any financial or other potential conflicts of interest.

Figures

Figure 1
Figure 1. MiRNA expression in patients with MTC
A. Hierarchical clustering on logFC expression of the 64 differentially expressed miRs. The mutational SMTC and HMTC status, the presence or absence of RET gene mutations, as well as the N status are color coded for all patients. The logFC individual gene colors are coded with a gradient from green (under-expression) to red (over-expression). MTC: Medullary Thyroid Carcinoma. HMTC: Hereditary Medullary Thyroid Carcinoma. SMTC: Sporadic Medullary Thyroid Carcinoma. B. Semi quantitative real-time PCR validation of the miRNA microarray results. Relative expression of miR-375 and miR-451 in tumor vs non-tumor tissue of 22 patients (11 HMTC, 11 SMTC). RNU19 normalized. Patient harbouring RET mutation are indicated in violet dots.*= P-value ≤ 0.05. C. Semi quantitative real-time PCR validation of the miRNA microarray results. Relative expression of miR-375 in non-tumor adjacent tissue, C-Cell hyperplasia and MTC of 6 patients bearing these pathologies in their thyroid. The dots corresponding to the same patient in the different tissues are connected with a grey line RNU19 was used as reference and values were normalized given the percentage of C-cell quantification in the tissue (hyperplasia, MTC).
Figure 2
Figure 2. Semi quantitative real-time PCR of miR-375 in thyroid cell lines
MiRNA were extracted from 70 percent confluent cells. RNU19 was used for normalization and the 8505C cell line, expressing lowest levels, was used as a reference.
Figure 3
Figure 3. A Venn diagram of the genes passing the cut off filters of 3 independent approaches
Nthy-ori 3-1 premiR DOWN: genes that are under-expressed in the Nthy-ori 3-1 after transfection of premir-375. TT anti-miR UP: genes over-expressed in the TT cells transfected with antagomir-375. Thyroid Cell Lines TT_DOWN: genes specifically under-expressed in the TT cell line compared to 11 thyroid cell lines from the public dataset GSE36133. The different cut off values are given in the Material and methods section.
Figure 4
Figure 4. SEC23A expression is negatively associated with miR-375 levels in the thyroid
A. Nthy-ori 3-1 were transfected with pre-miR-375 or pre-miR-CTL for 48h. TT cells were transfected with antagomiR-375 (anti-miR-375) or antagomiR-CTL (anti-miR-CTL) for 48h. SEC23A protein levels were quantified by immunoblotting. Tubulin (TUBA) and actin B (ACTB) protein levels were used as loading controls. Light exposure (upper band): unsaturated signal for all samples. Dark exposure (lower band): unsaturated signals for TT cells only. B. Immunohistochemistry with anti-SEC23A. (a) MTC: weak expression in tumor cells; (b) Papillary thyroid carcinoma: intense cytoplasmic expression in tumor cells; (c) Normal thyroid tissue: intense cytoplasmic expression in normal follicular cells; (d) C-cells: weak expression (arrows). (a-d: immunoperoxdiase, original magnification × 400).
Figure 5
Figure 5. Effect of miR-375 on proliferation and cancer drug response
A. Nthy-ori 3-1 cells were seeded and transfected with pre-miR-375 or pre-miR-CTL at 20pM for 24h and vandetanib was then added for 48h. Dead cells were stained with propidium iodide (red) before microscopic analysis. Pictures representative of four biological replicates. B. Quantification of propidium iodide positive Nthy-ori 3-1 cells. C. Nthy-ori 3-1 cells were seeded and transfected with pre-miR-375 or pre-miR-CTL at 20pM for 24h and vandetanib was then added for 48h. Quantification of ERK, AKT pathways and PARP cleavage was performed by immunoblotting. Tubulin (TUBA) and actin B (ACTB) protein levels were used as loading controls. D. Nthy-ori 3-1 cells were seeded in 96-well plates and transfected with pre-miR-375 or pre-miR-CTL either at 6.25, 12.5, 25 pM for 24h and then treated with either 1.25, 2.5, 5μM vandetanib for 48h. Cell proliferation was evaluated using BrdU incorporation for 3h. Single doses and combination doses were analysed using Compusyn software and a Combination index/effect dot plot was generated. CI<1 values are indicative of synergism. E. TT cells were seeded and transfected with antagomiR-375 (anti-miR-375) or antagomiR-CTL (anti-miR-CTL) for 24h and vandetanib was then added for 48h. Quantification of propidium iodide positive TT cells.
Figure 6
Figure 6. Effect of siSEC23A on the vandetanib response
A. Nthy-ori 3-1 cells were seeded and transfected with siCTL or siSEC23A#1 or siSEC23#2 for 48h. SEC23A protein levels were quantified by immunoblotting. Tubulin (TUBA) protein levels were used as a loading control. B. Nthy-ori 3-1 cells were seeded and transfected with siSEC23A or siCTL for 24h and vandetanib was then added for 48h. Dead cells were stained with propidium iodide (red) before microscopic analysis. Quantification of propidium iodide positive cells. C. Pictures representative of four biological replicates.

References

    1. Hundahl SA, Fleming ID, Fremgen AM, Menck HR. A National Cancer Data Base report on 53,856 cases of thyroid carcinoma treated in the U.S., 1985-1995. Cancer. 1998;83:2638–2648. - PubMed
    1. De Lellis RL, R V, Heitz PU, Eng C. Pathology and Genetics of Tumours of Endocrine Organs. World Health Organization Classification of Tumours. 2004
    1. Kouvaraki MA, Shapiro SE, Perrier ND, Cote GJ, Gagel RF, Hoff AO, Sherman SI, Lee JE, Evans DB. RET proto-oncogene: a review and update of genotype-phenotype correlations in hereditary medullary thyroid cancer and associated endocrine tumors. Thyroid. 2005;15:531–544. - PubMed
    1. Hubner RA, Houlston RS. Molecular advances in medullary thyroid cancer diagnostics. Clinica chimica acta. 2006;370:2–8. - PubMed
    1. Scollo C, Baudin E, Travagli JP, Caillou B, Bellon N, Leboulleux S, Schlumberger M. Rationale for central and bilateral lymph node dissection in sporadic and hereditary medullary thyroid cancer. J Clin Endocrinol Metab. 2003;88:2070–2075. - PubMed

MeSH terms

LinkOut - more resources