. 2016 Apr 1:17:274.
doi: 10.1186/s12864-016-2596-3.

A streamlined tethered chromosome conformation capture protocol

Affiliations

A streamlined tethered chromosome conformation capture protocol

Idan Gabdank et al. BMC Genomics. .

Abstract

Background: Identification of locus-locus contacts at the chromatin level provides a valuable foundation for understanding of nuclear architecture and function and a valuable tool for inferring long-range linkage relationships. As one approach to this, chromatin conformation capture-based techniques allow creation of genome spatial organization maps. While such approaches have been available for some time, methodological advances will be of considerable use in minimizing both time and input material required for successful application.

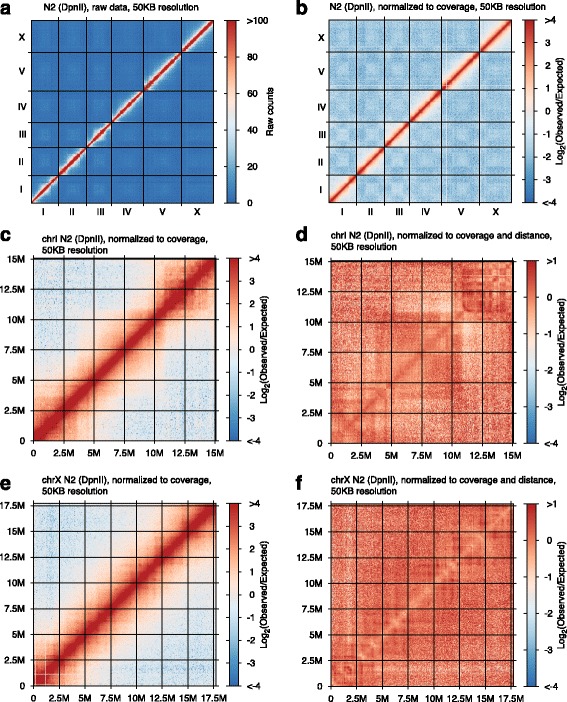
Results: Here we report a modified tethered conformation capture protocol that utilizes a series of rapid and efficient molecular manipulations. We applied the method to Caenorhabditis elegans, obtaining chromatin interaction maps that provide a sequence-anchored delineation of salient aspects of Caenorhabditis elegans chromosome structure, demonstrating a high level of consistency in overall chromosome organization between biological samples collected under different conditions. In addition to the application of the method to defining nuclear architecture, we found the resulting chromatin interaction maps to be of sufficient resolution and sensitivity to enable detection of large-scale structural variants such as inversions or translocations.

Conclusion: Our streamlined protocol provides an accelerated, robust, and broadly applicable means of generating chromatin spatial organization maps and detecting genome rearrangements without a need for cellular or chromatin fractionation.

Keywords: Caenorhabditis elegans; Chromatin; Conformation; Genome; Hi-C; TCC.


Figures

Fig. 1
Fig. 1
Overview of RTCC protocol. a Diagram shows a schematic description of steps from a crude tissue homogenate to a proximity sequencing library (details provided in the Methods section). For our studies (using C. elegans), animals flash-frozen in liquid nitrogen were finely ground using either mortar and pestle or using an electric drill with “Cellcrusher” drill-bit and “Cellcrusher” base held at liquid nitrogen temperature and treated with formaldehyde to covalently cross-link proteins to each other and to DNA (red and purple strands, threaded through the blue amorphous complex, representing proteins). (1) Chromatin is solubilized with detergent and proteins were non-specifically biotinylated (orange balls on sticks). (2) DNA was digested with a restriction enzyme that generates 5’ overhangs. (3) Cross-linked complexes were immobilized at a very low density on the surface of streptavidin-coated magnetic beads (grey color arc) through the biotinylated proteins, while the non-cross-linked DNA fragments were removed. (4) 5′ overhangs were filled in using DNA polymerase and a nucleotide mixture containing biotin-14-dCTP (orange balls on sticks) to generate blunt ends. (5) Blunt DNA ends were ligated. (6) Cross-linking was reversed and DNA was purified. (7) The DNA was fragmented and tagged (light blue strands) using Nextera tagmentase. (8) DNA fragments containing biotinylated CTP were selected on streptavidin-coated beads. This selects for ligation junctions and DNA molecules biotinylated at their terminus. (9) A Sequencing library was generated via PCR using the Nextera [http://www.illumina.com/products/nextera_dna_library_prep_kit.html] adaptors introduced at step 7. This amplification step should provide a substantial enrichment for ligation junctions, since molecules that were biotinylated solely on their termini would carry a Nextera adaptor only on one side. b RTCC protocol timeline
Fig. 2
Fig. 2
Chromatin interaction intensity maps. a Heat map showing raw counts of observed chromatin contacts on a genome-wide scale with 50KB bins (data from wild type N2 young adults). b Binned chromatin interaction map for wild type N2 young adults displayed with color representing the Log2 of the observed/expected ratio for each 50KB bin pair. c Magnified Log2 plot as in B, but focused just on chromosome I. d A further normalization of the plot in Panel C in which the interaction level for each combination of 50KB intervals is normalized to other pairs of intervals separated by a similar distance (using HOMER software [40]). e Log2 of the observed/expected ratio of interaction frequency (similar to panel C) for the X chromosome. f Coverage and distance normalized interaction plot (similar to panel D) for the X chromosome
Fig. 3
Fig. 3
Interaction frequency decay as function of the distance between interacting loci. The genome was divided into 1KB non-overlapping intervals and intra-chromosomal contacts between these intervals were counted to produce the plotted profile. In the chart we are plotting the fraction of the total intra-chromosomal junctions detected within 1000 bp of a given genomic distance
Fig. 4
Fig. 4
Differences in prevalence of intra- and inter-chromosomal contacts. Contacts detected in aggregated N2 DpnII experiments (total of ~18M junctions) were used to construct an interaction frequency matrix with resolution of 50KB. a, b, c show sections of this chart under different magnifications. For each square in the matrix we calculated an expected number of contacts (based on the product of sequence read coverage for the two regions amongst all “junctional” reads) and compared these with the quantity of the observed “junctional” reads between the two indicated regions. We have plotted the frequencies of observed/expected ratios in intra- and inter-chromosomal junctions for each bin of width 0.001 in observed/expected value. Junctions mapping to ribosomal RNA sequence on chromosome I were excluded from the calculation
Fig. 5
Fig. 5
Detection of simulated structural variants by RTCC. This figure shows an analytical evaluation of feasibility for using RTCC data to detect large scale structural variations in the C. elegans genome. For this analysis, the N2 reference genome was computationally modified to simulate “model reference genomes” that differ structurally from the normal C. elegans genome. We then analyzed the data from N2 (DpnII) experiments as in Fig. 2, aligning the reads to the indicated simulated reference genome and using a 50KB window size as above. In each case, the analysis yields a footprint characteristic of the simulated rearrangement. In (a), we simulated a two-chromosome fusion: we generated a model reference genome in which chrI was artificially separated into 2 parts (I-L and I-R), each 7.53MB long. Execution of our analysis pipeline resulted in visible evidence for a high level of contacts between the artificially created right tip of I-L and the artificially created left tip of I-R of the model reference genome, which are “fused” in the N2 genome. In (b), we simulated a reciprocal translocation by creating a model reference genome in which segments of chromosomes II and IV were virtually recombined. The simulated recombination was created in the middle of a TC5 transposable element (3171bp long) present in multiple copies in the genome to simulate a rearrangement that would have presented detection challenges by standard methods. The “translocation” in the N2 data (relative to the model reference genome) is evident on the plot, by the distinct accentuation of contacts between II-L and II-R and IV-L and IV-R. In (c), we generated a model reference genome in which a large inversion (4MB in length) was virtually introduced on chromosome I. Evidence for inversion is visible on the plot

References

    1. Lieberman-Aiden E, van Berkum NL, Williams L, Imakaev M, Ragoczy T, Telling A, Amit I, Lajoie BR, Sabo PJ, Dorschner MO, Sandstrom R, Bernstein B, Bender MA, Groudine M, Gnirke A, Stamatoyannopoulos J, Mirny LA, Lander ES, Dekker J. Comprehensive mapping of long-range interactions reveals folding principles of the human genome. Science. 2009;326:289–293. doi: 10.1126/science.1181369. - DOI - PMC - PubMed
    1. van Berkum NL, Lieberman-Aiden E, Williams L, Imakaev M, Gnirke A, Mirny LA, Dekker J, Lander ES. Hi-C: a method to study the three-dimensional architecture of genomes. J Vis Exp. 2010;39:1869. - PMC - PubMed
    1. Dekker J, Rippe K, Dekker M, Kleckner N. Capturing chromosome conformation. Science. 2002;295:1306–1311. doi: 10.1126/science.1067799. - DOI - PubMed
    1. Misteli T. Beyond the sequence: cellular organization of genome function. Cell. 2007;128:787–800. doi: 10.1016/j.cell.2007.01.028. - DOI - PubMed
    1. Branco MR, Pombo A. Chromosome organization: new facts, new models. Trends Cell Biol. 2007;17:127–134. doi: 10.1016/j.tcb.2006.12.006. - DOI - PubMed

Publication types