Review
. 2016 Mar 31:48:27.
doi: 10.1186/s12711-016-0205-1.

Using biological networks to integrate, visualize and analyze genomics data

Affiliations
Review

Using biological networks to integrate, visualize and analyze genomics data

Theodosia Charitou et al. Genet Sel Evol. .

Abstract

Network biology is a rapidly developing area of biomedical research and reflects the current view that complex phenotypes, such as disease susceptibility, are not the result of single gene mutations that act in isolation but are rather due to the perturbation of a gene's network context. Understanding the topology of these molecular interaction networks and identifying the molecules that play central roles in their structure and regulation is a key to understanding complex systems. The falling cost of next-generation sequencing is now enabling researchers to routinely catalogue the molecular components of these networks at a genome-wide scale and over a large number of different conditions. In this review, we describe how to use publicly available bioinformatics tools to integrate genome-wide 'omics' data into a network of experimentally-supported molecular interactions. In addition, we describe how to visualize and analyze these networks to identify topological features of likely functional relevance, including network hubs, bottlenecks and modules. We show that network biology provides a powerful conceptual approach to integrate and find patterns in genome-wide genomic data but we also discuss the limitations and caveats of these methods, of which researchers adopting these methods must remain aware.


Figures

Fig. 1
Fig. 1
Overview of InnateDB network analysis. a Go to the “Data Analysis” menu at the top of the InnateDB.com home page and select “Network Analysis”. b Paste a gene list (and any associated quantitative data) into the web form or upload the data via a tab-delimited text file or Excel spreadsheet (.xls files only). c Select the options for the network analysis as described in the main text. d Click on the column headers to define the columns that contain the gene IDs and the quantitative data. e Submit the data by clicking “Next” to tell InnateDB to build the network
Fig. 2
Fig. 2
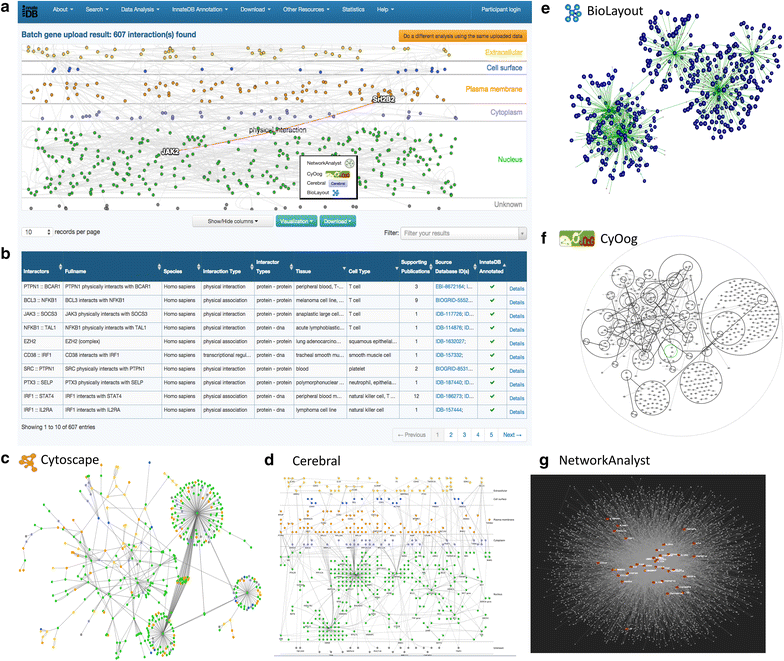
Visualizing the network. InnateDB was used to construct a network of genes that were significantly up-regulated in monocytes isolated from bovine milk at either 36 or 48 h post infection (hpi) with Streptococcus uberis. Only experimentally-validated interactions between genes in the uploaded dataset are shown. The network can be visualized using a wide variety of applications, including a CerebralWeb, b tabular format, c Cytoscape, d the Cerebral Java Webstart, e Biolayout, f CyOog or g NetworkAnalyst
Fig. 3
Fig. 3
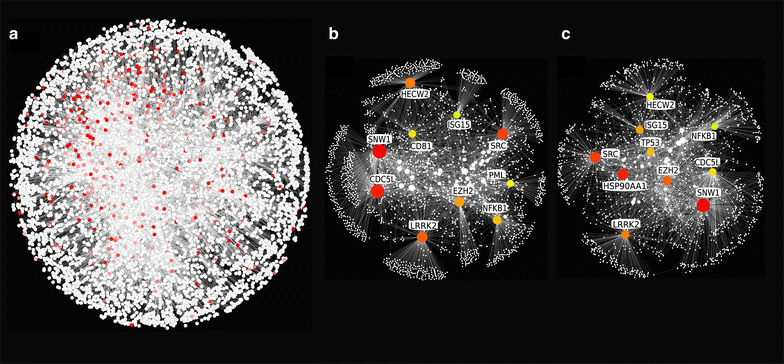
Network hubs and bottlenecks. a InnateDB was used to construct a network of genes that were significantly up-regulated in the Lawless et al. [30] dataset. Interactions between the genes in the uploaded list, as well as all their interacting partners, were included in the network. The network consisted of 6259 nodes and 15,137 edges (self-loops; duplicated edges; and edges involving UBC were removed). b Hub nodes were identified using the CytoHubba plugin in Cytoscape 2.8.2. Cytoscape was used to extract and visualize the top 10 hub nodes and their interactors. Hub nodes are shown in colour with gene names. Node size is proportional to degree. c CytoHubba was also used to identify bottleneck nodes in the network. The top 10 bottleneck nodes are shown in colour with gene names. There is considerable overlap between the top 10 hub nodes and the top 10 bottleneck nodes
Fig. 4
Fig. 4
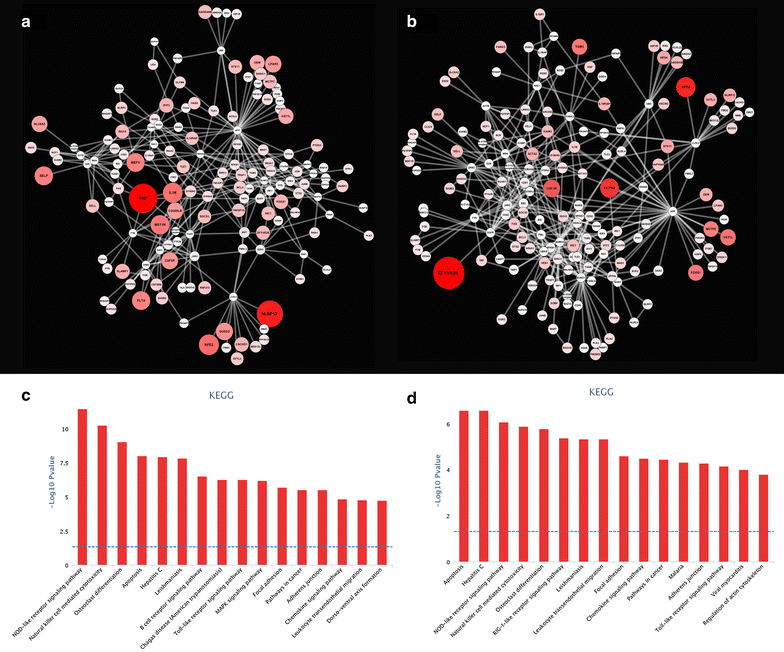
Identifying modules in a network. The jActiveModules plugin in Cytoscape 3.1.0 was also used to identify high-scoring differentially expressed (DE) sub-networks in the network of Fig. 3a (using parameter values: overlap threshold = 0.3; search depth = 2). The highest-scoring module identified in the network using a the gene expression data at 36 h post-infection (hpi) and b at 48 hpi, are shown. The InnateDB pathway analysis tool was used to identify over-represented pathways for c the 36 hpi module and d the 48 hpi module. Note that for this dataset, the top five pathways for the 36 and 48 hpi modules are very similar, which reflects a similar pattern of gene expression at these time-points in this dataset

References

    1. Ashburner M, Ball CA, Blake JA, Botstein D, Butler H, Cherry JM, et al. Gene ontology: tool for the unification of biology. The Gene Ontology Consortium. Nat Genet. 2000;25:25–29. doi: 10.1038/75556. - DOI - PMC - PubMed
    1. Rhee SY, Wood V, Dolinski K, Draghici S. Use and misuse of the gene ontology annotations. Nat Rev Genet. 2008;9:509–515. doi: 10.1038/nrg2363. - DOI - PubMed
    1. Jantzen SG, Sutherland BJ, Minkley DR, Koop BF. GO trimming: systematically reducing redundancy in large gene ontology datasets. BMC Res Notes. 2011;4:267. doi: 10.1186/1756-0500-4-267. - DOI - PMC - PubMed
    1. Khatri P, Sirota M, Butte AJ. Ten years of pathway analysis: current approaches and outstanding challenges. PLoS Comput Biol. 2012;8:e1002375. doi: 10.1371/journal.pcbi.1002375. - DOI - PMC - PubMed
    1. Kanehisa M, Goto S. KEGG: kyoto encyclopedia of genes and genomes. Nucleic Acids Res. 2000;28:27–30. doi: 10.1093/nar/28.1.27. - DOI - PMC - PubMed

Publication types

LinkOut - more resources