. 2016 Apr 2:5:e13343.
doi: 10.7554/eLife.13343.

Structural development and dorsoventral maturation of the medial entorhinal cortex

Affiliations

Structural development and dorsoventral maturation of the medial entorhinal cortex

Saikat Ray et al. Elife. .

Abstract

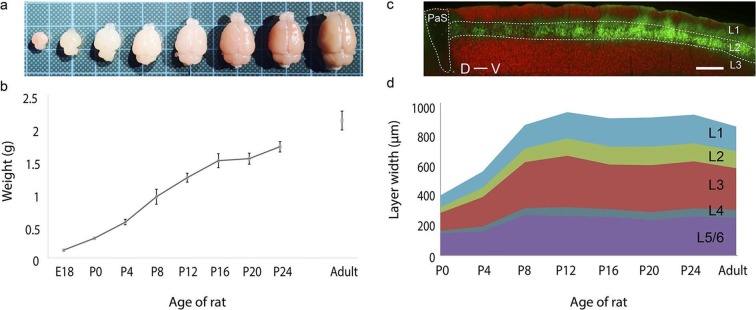
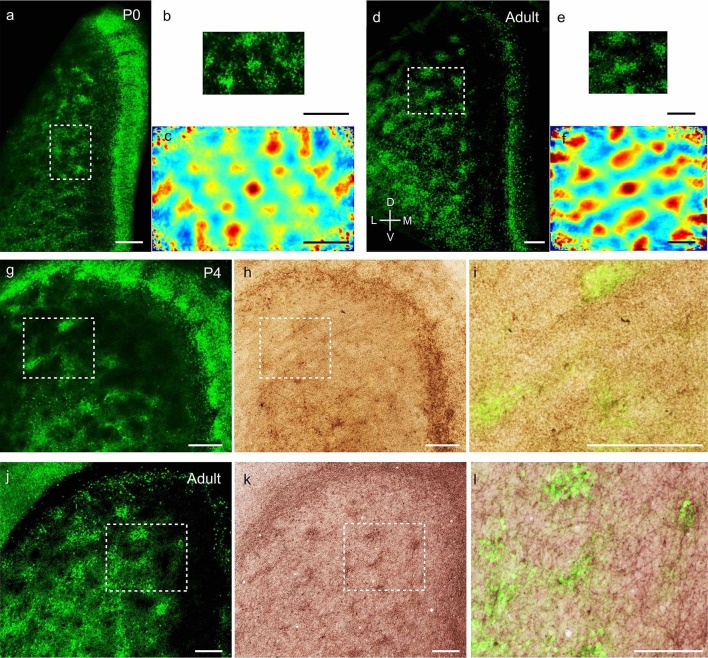
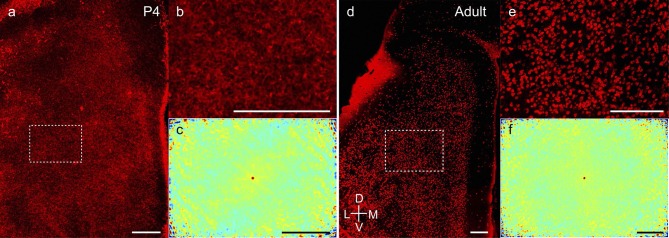
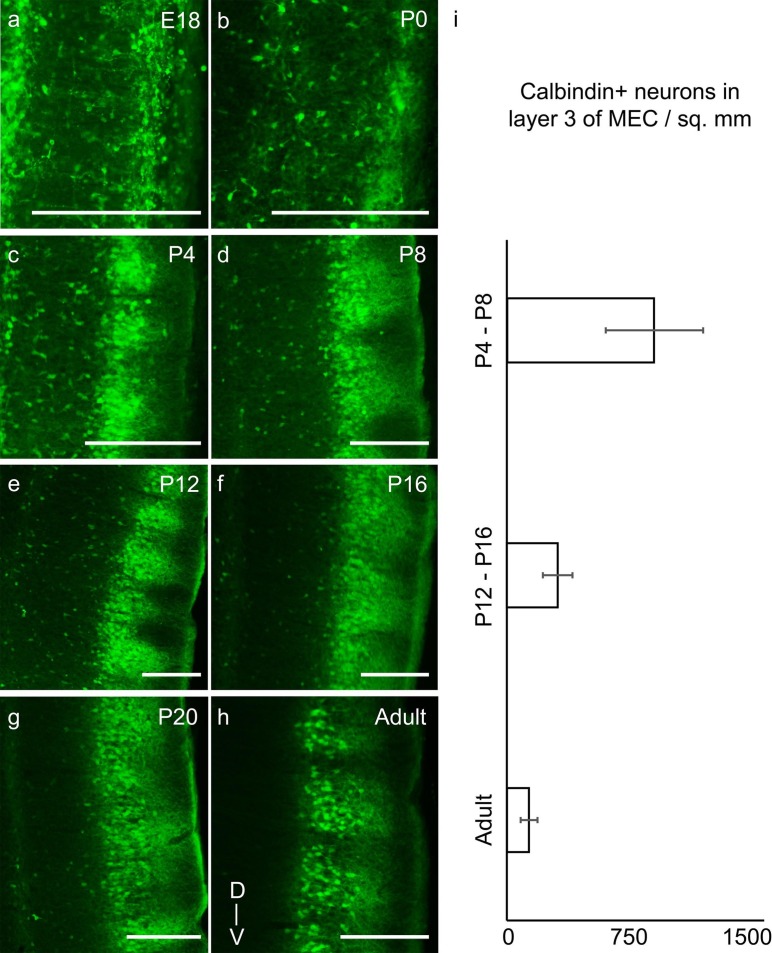
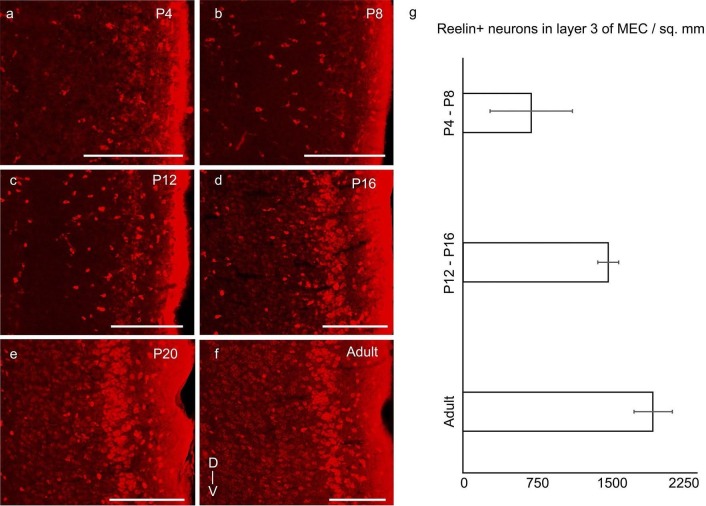
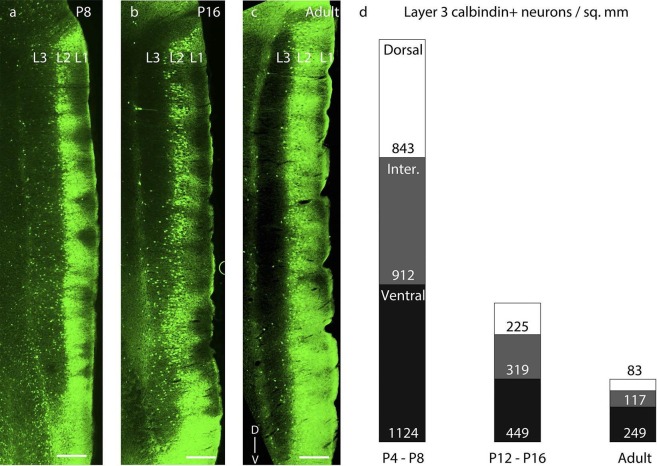
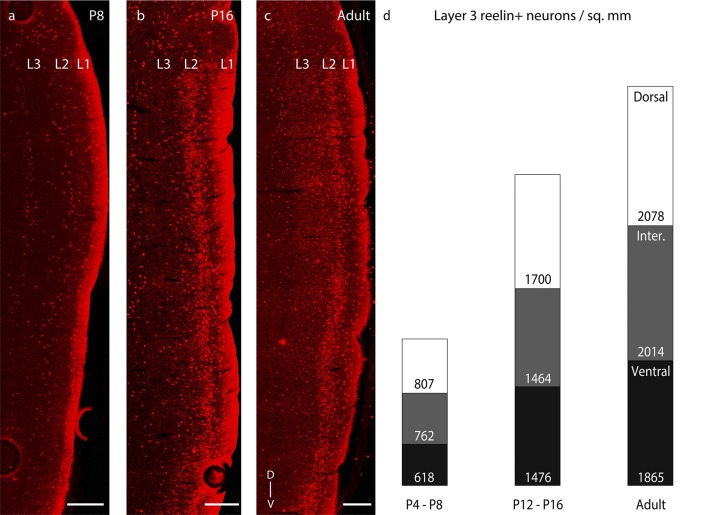
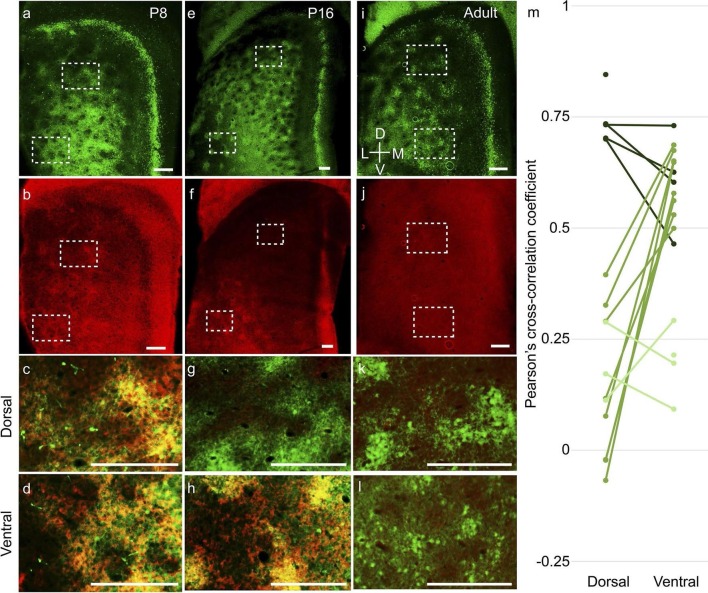
We investigated the structural development of superficial-layers of medial entorhinal cortex and parasubiculum in rats. The grid-layout and cholinergic-innervation of calbindin-positive pyramidal-cells in layer-2 emerged around birth while reelin-positive stellate-cells were scattered throughout development. Layer-3 and parasubiculum neurons had a transient calbindin-expression, which declined with age. Early postnatally, layer-2 pyramidal but not stellate-cells co-localized with doublecortin - a marker of immature neurons - suggesting delayed functional-maturation of pyramidal-cells. Three observations indicated a dorsal-to-ventral maturation of entorhinal cortex and parasubiculum: (i) calbindin-expression in layer-3 neurons decreased progressively from dorsal-to-ventral, (ii) doublecortin in layer-2 calbindin-positive-patches disappeared dorsally before ventrally, and (iii) wolframin-expression emerged earlier in dorsal than ventral parasubiculum. The early appearance of calbindin-pyramidal-grid-organization in layer-2 suggests that this pattern is instructed by genetic information rather than experience. Superficial-layer-microcircuits mature earlier in dorsal entorhinal cortex, where small spatial-scales are represented. Maturation of ventral-entorhinal-microcircuits - representing larger spatial-scales - follows later around the onset of exploratory behavior.

Keywords: calbindin patches; doublecortin; immature neurons; medial entorhinal cortex; neuroscience; parasubiculum; pyramidal neurons; rat.


Conflict of interest statement

The authors declare that no competing interests exist.

Figures

Figure 1.
Figure 1.. Rat brain and medial entorhinal cortex laminar development.
(a) Growth in rat brain size from E18, P0, P4, P8, P12, P16, P20 to adult. Brains are overlaid on a 1 cm x 1 cm grid. (b) Mean weight (in grams) of E18 (n=3), P0 (n=6), P4 (n=5), P8 (n=5), P12 (n=5), P16 (n=5), P20 (n=5), P24 (n=6) and in adult (n=9) rat brains. Error bars indicate SD. (c) Parasagittal section double stained for calbindin-immunoreactivity (green) and Purkinje cell protein 4 immunoreactivity (pcp4; red), illustrating the superficial layers of the medial entorhinal cortex and parasubiculum. Calbindin+ neurons (green) are in layer 2, pcp4+ neurons (red) are in layer 3 MEC. (d) Development of mean layer width (in μm) of layer 1 (light-blue), layer 2 (green), layer 3 (red), layer 4 (gray-blue) and layer 5/6 (purple) from P0 to P24 and in adult rat medial entorhinal cortex. Scale bars 250 µm. PaS- Parasubiculum; L1- Layer 1; L2- Layer 2; L3- Layer 3; D- Dorsal; V-Ventral. DOI: http://dx.doi.org/10.7554/eLife.13343.004
Figure 2.
Figure 2.. Adult-like grid layout and cholinergic innervation of calbindin+ pyramidal neurons in layer 2 of MEC at early postnatal stages.
(a) Tangential sections of the MEC processed for calbindin-immunoreactivity (green). Patches of calbindin+ neurons are evident already in the MEC, while the parasubicular patches at the right extremity also show calbindin-immunoreactivity in P0 rats. (b) Inset from (a), rotated 90 degrees clockwise, for presentation. (c) Two-dimensional spatial autocorrelation of the MEC region shown in (b) showing a periodic spatial organization of calbindin+ patches. The grid score is 0.59. (d) as (a) for adult animals. (e) Inset from (d). (f) Two-dimensional spatial autocorrelation of the MEC region shown in (e) showing a periodic spatial organization of calbindin+ patches. The grid score is 1.18. (g) Tangential section in a P4 animal processed for calbindin-immunoreactivity (green). Also note the calbindin-immunoreactive parasubicular patches present in a P4 rat. (h) Section from (g) co-stained for acetylcholinesterase activity (brown). (i) Overlay of inset regions from (g) and (h) shows overlap between calbindin and acetylcholinesterase in MEC in P4 rats. (j–l) as (g–i) for adult animals. (d–f, j–l) modified from Ray et al. (2014). Colour scale of spatial autocorrelation, -0.5 (blue) through 0 (green) to 0.5 (red). Scale bars 250 µm. D- Dorsal; V- Ventral; M- Medial; L- Lateral. Orientation in (d) applies to all sections apart from (b), where it’s rotated 90 degrees clockwise. DOI: http://dx.doi.org/10.7554/eLife.13343.006
Figure 2—figure supplement 1.
Figure 2—figure supplement 1.. Adult-like scattered distribution of reelin+ stellate cells in early postnatal stages.
(a) Tangential sections of the MEC processed for reelin-immunoreactivity (red) in a P4 rat. (b) Inset from (a). (c) Two-dimensional spatial autocorrelation of the MEC region shown in (b) showing a lack of periodicity of reelin+ neurons. The grid score is -0.09. (d–f) as (a–c) for adult animals. The grid score in (f) is 0.03. Scale bars 250 µm. D- Dorsal; V- Ventral; M- Medial; L- Lateral. Orientation in (d) applies to all sections. DOI: http://dx.doi.org/10.7554/eLife.13343.007
Figure 3.
Figure 3.. Transient presence of calbindin+ neurons in layer 3 of MEC in early postnatal stages reduces progressively to adult-like state by third postnatal week.
Parasaggital sections of the MEC processed for calbindin-immunoreactivity (green). The sections show clustering of calbindin+ pyramidal cells in layer 2 and a transient presence of calbindin+ neurons in layer 3, which decrease with age in (a) E18 rat. (b) P0 rat. (c) P4 rat. (d) P8 rat. (e) P12 rat. (f) P16 rat. (g) P20 rat. (h) Adult rat. (i) Decreasing density of calbindin+ neurons in layer 3 of MEC from P4-P8 (n=3776 neurons, 8 rats); to P12-P16 (n=2104 neurons, 8 rats) to adults (n=828 neurons, 7 rats). Error bars denote SD. Scale bars 250 µm. D- Dorsal; V- Ventral. Orientation in (h) applies to all sections. DOI: http://dx.doi.org/10.7554/eLife.13343.008
Figure 4.
Figure 4.. Increase of reelin expression in layer 3 neurons of MEC through development.
Parasaggital sections of the MEC processed for reelin-immunoreactivity (red). The sections show reelin+ stellate cells in layer 2 and an increasing reelin expression in layer 3 neurons with development in (a) P4 rat. (b) P8 rat. (c) P12 rat. (d) P16 rat. (e) P20 rat. (f) Adult rat. (g) Increasing density of reelin+ neurons in layer 3 of MEC from P4-P8 (n=1405 neurons, 4 rats); to P12-P16 (n=3309 neurons, 3 rats) to adults (n=5039 neurons, 3 rats). Error bars denote SD. Scale bars 250 µm. D- Dorsal; V- Ventral. Orientation in (f) applies to all sections. DOI: http://dx.doi.org/10.7554/eLife.13343.010
Figure 5.
Figure 5.. Dorsal-to-ventral disappearance of layer 3 calbindin expression.
Parasaggital sections showing superficial layers of the MEC processed for calbindin-immunoreactivity (green). (a) Calbindin expression is seen throughout layer 3 in P8 rats. (b) Calbindin expression is seen only in ventral half of layer 3 in P16 rats. (c) Calbindin expression is largely absent in layer 3 in adult rats. (d) Proportion of layer 3 calbindin+ neurons in dorsal (white), intermediate (gray) and ventral (black) MEC in P4-P8 (n=3776 neurons, 8 rats); P12-P16 (n =2014 neurons, 8 rats); and adult (n=828 neurons, 7 rats) rats. The numbers represent layer 3 calbindin+ neuronal density and decay in a dorsal to ventral gradient with age as evident with the reduced proportions of the white (dorsal MEC) and gray (intermediate MEC) sections of the columns with increasing age. Scale bars 250 µm. L1- Layer 1; L2- Layer 2; L3- Layer 3; D- Dorsal; V-Ventral. Orientation in (c) applies to all sections. DOI: http://dx.doi.org/10.7554/eLife.13343.012
Figure 5—figure supplement 1.
Figure 5—figure supplement 1.. Dorsal- ventral distribution of layer 3 reelin expression.
Parasaggital sections showing superficial layers of the MEC processed for reelin-immunoreactivity (red). (a) Reelin expression is sporadic throughout layer 3 in P8 rats. (b) Reelin expression equitably increases in layer 3 in P16 rats. (c) Reelin expression is present throughout layer 3 in adult rats. (d) Proportion of layer 3 reelin+ neurons in dorsal (white), intermediate (gray) and ventral (black) MEC in P4-P8 (n=1405 neurons, 4 rats); P12-P16 (n =3309 neurons, 3 rats); and adult (n=5039 neurons, 3 rats) rats. The numbers represent layer 3 reelin+ neuronal density and increase equitably with age as evident with the similar proportions of the white (dorsal MEC), gray (intermediate MEC) and black (ventral MEC) sections of the columns with increasing age. Scale bars 250 µm. L1- Layer 1; L2- Layer 2; L3- Layer 3; D- Dorsal; V-Ventral. Orientation in (c) applies to all sections. DOI: http://dx.doi.org/10.7554/eLife.13343.013
Figure 6.
Figure 6.. Dorsal-to-ventral maturation of layer 2 calbindin+ patches and parasubiculum.
Tangential sections of the MEC double-stained for calbindin immunoreactivity (green) and doublecortin immunoreactivity (red). Doublecortin is a marker for immature neurons and disappears in a dorsal-ventral gradient. (a) Calbindin-expression (green) in P8 rats. (b) Doublecortin-expression (red) in P8 rats. Note the presence of doublecortin throughout the dorso-ventral extent of MEC and parasubiculum. (c) Overlay of the dorsal inset region (dashed) in (a) and (b), showing overlap of calbindin and doublecortin (hence the yellowish color). (d) Overlay of the ventral inset region (dashed) in (a) and (b), showing overlap of calbindin and doublecortin. (e–h) as (a–d) for P16 rats, respectively. However, note that dorsal inset region lacks doublecortin (g) while ventral inset region shows overlap of calbindin and doublecortin (h). Also, note the absence of doublecortin in the dorsal but not the ventral parasubiculum (f). (i–k) as (a–d) for adult rats. No doublecortin is present in either dorsal (k) or ventral (l) regions. (m) Spatial cross-correlations of calbindin and doublecortin in MEC showing high overlap in both dorsal and ventral regions in P8-P12 rats (dark green; n=9 regions, 5 rats); low correlation in dorsal but high overlap in ventral in P16-P20 rats (green; n=16 regions, 8 rats) and low correlations in both dorsal and ventral in adult rats (light green; n=7 regions, 4 rats). The Pearson’s cross-correlation coefficient can vary from -1 (anti-correlated) through 0 (un-correlated) to 1 (correlated). Scale bars 250 µm. D- Dorsal; V- Ventral; M- Medial; L- Lateral. Orientation in (i) applies to all sections. DOI: http://dx.doi.org/10.7554/eLife.13343.015
Figure 7.
Figure 7.. Higher co-localization of doublecortin with calbindin+ pyramidal than reelin+ stellate cells in the developing medial entorhinal cortex.
Tangential sections of the MEC layer 2 triple-stained for calbindin immunoreactivity (CB; blue), doublecortin immunoreactivity (DCX; red) and reelin immunoreactivity (RL; green). Pyramidal but not stellate cells are structurally immature during early postnatal stages. (a) Calbindin-expression (blue) in layer 2 of MEC. (b) Doublecortin-expression (red) in layer 2 of MEC. (c) Reelin-expression (green) in layer 2 of MEC. (d) Overlay of the inset region (dashed) in (a), (b) and (c), showing a higher co-localization of doublecortin (red) with calbindin (blue), than reelin (green). (e) Spatial cross-correlations of doublecortin with calbindin and reelin showing high overlap of doublecortin with calbindin but not reelin (n=8 regions, 8 rats). Scale bars (a–c) 250 µm; (d) 100 µm. D- Dorsal; V- Ventral; M- Medial; L- Lateral. Orientation in (c) applies to all sections. DOI: http://dx.doi.org/10.7554/eLife.13343.016
Figure 8.
Figure 8.. Dorsal-to-ventral maturation of wolframin expression in the medial entorhinal cortex and parasubiculum.
(a) Tangential sections of the MEC and PaS (outlines dashed) double-stained for calbindin-immunoreactivity (green) and wolframin immunoreactivity (red) in a P4 rat. Shown is an overlay of red and green fluorescence. (b) as (a) for a P8 rat. (c) as (a) for a P20 rat. Wolframin is present in the dorsal ~10% of the parasubiculum at P4, ~40% at P8 and 100% at P20. Note that wolframin expression co-localizes with calbindin-expression in the MEC (hence the yellowish color) and increases from dorsal to ventral with age. Scale bars 250 µm. D- Dorsal; V- Ventral; M- Medial; L- Lateral. Orientation in (a) applies to all sections. DOI: http://dx.doi.org/10.7554/eLife.13343.017

Similar articles

Cited by

References

    1. Ainge JA, Langston RF. Ontogeny of neural circuits underlying spatial memory in the rat. Frontiers in Neural Circuits. 2012;6 doi: 10.3389/fncir.2012.00008. - DOI - PMC - PubMed
    1. Alonso A, Llinás RR. Subthreshold Na+-dependent theta-like rhythmicity in stellate cells of entorhinal cortex layer II. Nature. 1989;342:175–177. doi: 10.1038/342175a0. - DOI - PubMed
    1. Alonso A, Klink R. Differential electroresponsiveness of stellate and pyramidal-like cells of medial entorhinal cortex layer II. Journal of Neurophysiology. 1993;70:128–143. - PubMed
    1. Bayer SA. Development of the hippocampal region in the rat I. Neurogenesis examined with3h-thymidine autoradiography. The Journal of Comparative Neurology. 1980;190:87–114. doi: 10.1002/cne.901900107. - DOI - PubMed
    1. Bayer SA. Development of the hippocampal region in the rat II. Morphogenesis during embryonic and early postnatal life. The Journal of Comparative Neurology. 1980;190:115–134. doi: 10.1002/cne.901900108. - DOI - PubMed

LinkOut - more resources