A Western diet induced NAFLD in LDLR(-/)(-) mice is associated with reduced hepatic glutathione synthesis
- PMID: 27036364
- PMCID: PMC5297627
- DOI: 10.1016/j.freeradbiomed.2016.03.032
A Western diet induced NAFLD in LDLR(-/)(-) mice is associated with reduced hepatic glutathione synthesis
Abstract
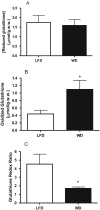
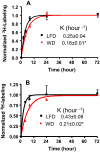
Oxidative stress plays a key role in the pathogenesis of non-alcoholic fatty liver disease (NAFLD). Glutathione is the major anti-oxidant involved in cellular oxidative defense, however there are currently no simple non-invasive methods for assessing hepatic glutathione metabolism in patients with NAFLD. As a primary source of plasma glutathione, liver plays an important role in interorgan glutathione homeostasis. In this study, we have tested the hypothesis that measurements of plasma glutathione turnover could be used to assess the hepatic glutathione metabolism in LDLR(-/)(-) mice, a mouse model of diet-induced NAFLD. Mice were fed a standard low fat diet (LFD) or a high fat diet containing cholesterol (a Western type diet (WD)). The kinetics of hepatic and plasma glutathione were quantified using the (2)H2O metabolic labeling approach. Our results show that a WD leads to reduced fractional synthesis rates (FSR) of hepatic (25%/h in LFD vs. 18%/h in WD, P<0.05) and plasma glutathione (43%/h in LFD vs. 21%/h in WD, P<0.05), without any significant effect on their absolute production rates (PRs). WD-induced concordant changes in both hepatic and plasma glutathione turnover suggest that the plasma glutathione turnover measurements could be used to assess hepatic glutathione metabolism. The safety, simplicity, and low cost of the (2)H2O-based glutathione turnover approach suggest that this method has the potential for non-invasive probing of hepatic glutathione metabolism in patients with NAFLD and other diseases.
Keywords: Flux; Glutathione; Heavy water; Mass spectrometer; NAFLD; NASH; Oxidative stress; Western Diet.
Copyright © 2016 Elsevier Inc. All rights reserved.
Figures


Similar articles
-
Is Western Diet-Induced Nonalcoholic Steatohepatitis in Ldlr-/- Mice Reversible?PLoS One. 2016 Jan 13;11(1):e0146942. doi: 10.1371/journal.pone.0146942. eCollection 2016. PLoS One. 2016. PMID: 26761430 Free PMC article.
-
Lipidomic and transcriptomic analysis of western diet-induced nonalcoholic steatohepatitis (NASH) in female Ldlr -/- mice.PLoS One. 2019 Apr 3;14(4):e0214387. doi: 10.1371/journal.pone.0214387. eCollection 2019. PLoS One. 2019. PMID: 30943218 Free PMC article.
-
Proteome Dynamics Reveals Pro-Inflammatory Remodeling of Plasma Proteome in a Mouse Model of NAFLD.J Proteome Res. 2016 Sep 2;15(9):3388-404. doi: 10.1021/acs.jproteome.6b00601. Epub 2016 Aug 5. J Proteome Res. 2016. PMID: 27439437 Free PMC article.
-
Docosahexaenoic acid blocks progression of western diet-induced nonalcoholic steatohepatitis in obese Ldlr-/- mice.PLoS One. 2017 Apr 19;12(4):e0173376. doi: 10.1371/journal.pone.0173376. eCollection 2017. PLoS One. 2017. PMID: 28422962 Free PMC article.
-
Hepatic Mitochondrial Defects in a Nonalcoholic Fatty Liver Disease Mouse Model Are Associated with Increased Degradation of Oxidative Phosphorylation Subunits.Mol Cell Proteomics. 2018 Dec;17(12):2371-2386. doi: 10.1074/mcp.RA118.000961. Epub 2018 Aug 31. Mol Cell Proteomics. 2018. PMID: 30171159 Free PMC article.
Cited by
-
An unbiased ranking of murine dietary models based on their proximity to human metabolic dysfunction-associated steatotic liver disease (MASLD).Nat Metab. 2024 Jun;6(6):1178-1196. doi: 10.1038/s42255-024-01043-6. Epub 2024 Jun 12. Nat Metab. 2024. PMID: 38867022 Free PMC article.
-
Monitoring the synthesis of biomolecules using mass spectrometry.Philos Trans A Math Phys Eng Sci. 2016 Oct 28;374(2079):20150378. doi: 10.1098/rsta.2015.0378. Philos Trans A Math Phys Eng Sci. 2016. PMID: 27644976 Free PMC article.
-
Acetaminophen-Induced Hepatotoxicity in Obesity and Nonalcoholic Fatty Liver Disease: A Critical Review.Livers. 2023 Mar;3(1):33-53. doi: 10.3390/livers3010003. Epub 2023 Jan 12. Livers. 2023. PMID: 36713231 Free PMC article.
-
Allopurinol potentiates the hepatoprotective effect of metformin and vitamin E in fructose-induced fatty liver in rats.Clin Exp Hepatol. 2019 Mar;5(1):65-74. doi: 10.5114/ceh.2019.83159. Epub 2019 Feb 20. Clin Exp Hepatol. 2019. PMID: 30915409 Free PMC article.
-
A Review of Dietary (Phyto)Nutrients for Glutathione Support.Nutrients. 2019 Sep 3;11(9):2073. doi: 10.3390/nu11092073. Nutrients. 2019. PMID: 31484368 Free PMC article. Review.
References
-
- Angulo P. Nonalcoholic fatty liver disease. N Engl J Med. 2002;346(16):1221–1231. - PubMed
-
- Reddy JK, Rao MS. Lipid metabolism and liver inflammation. II. Fatty liver disease and fatty acid oxidation. Am J Physiol Gastrointest Liver Physiol. 2006;290(5):G852–G858. - PubMed
-
- Begriche K, et al. Mitochondrial dysfunction in NASH: causes, consequences and possible means to prevent it. Mitochondrion. 2006;6(1):1–28. - PubMed
-
- Rolo AP, Teodoro JS, Palmeira CM. Role of oxidative stress in the pathogenesis of nonalcoholic steatohepatitis. Free Radic Biol Med. 2012;52(1):59–69. - PubMed
-
- Bedogni G, et al. Prevalence of and risk factors for nonalcoholic fatty liver disease: the Dionysos nutrition and liver study. Hepatology. 2005;42(1):44–52. - PubMed
Publication types
MeSH terms
Substances
Grants and funding
LinkOut - more resources
Full Text Sources
Other Literature Sources
Medical
Research Materials

