Review
. 2016 Mar;87(3):031101.
doi: 10.1063/1.4943211.

Invited Review Article: Pump-probe microscopy

Affiliations
Review

Invited Review Article: Pump-probe microscopy

Martin C Fischer et al. Rev Sci Instrum. 2016 Mar.

Abstract

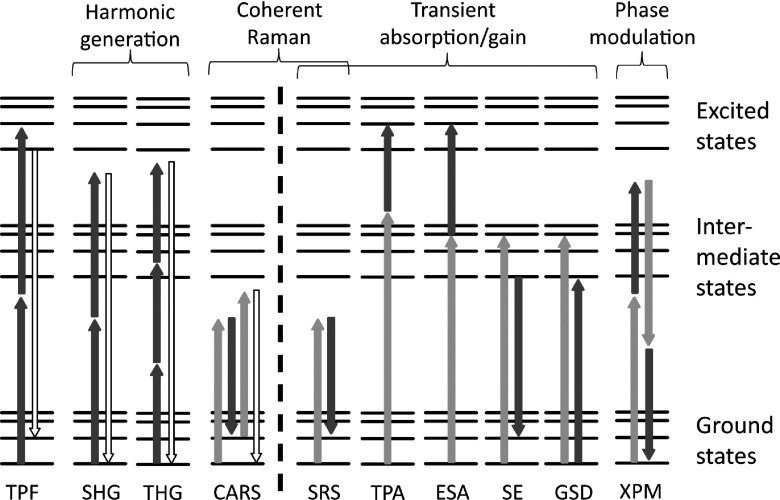
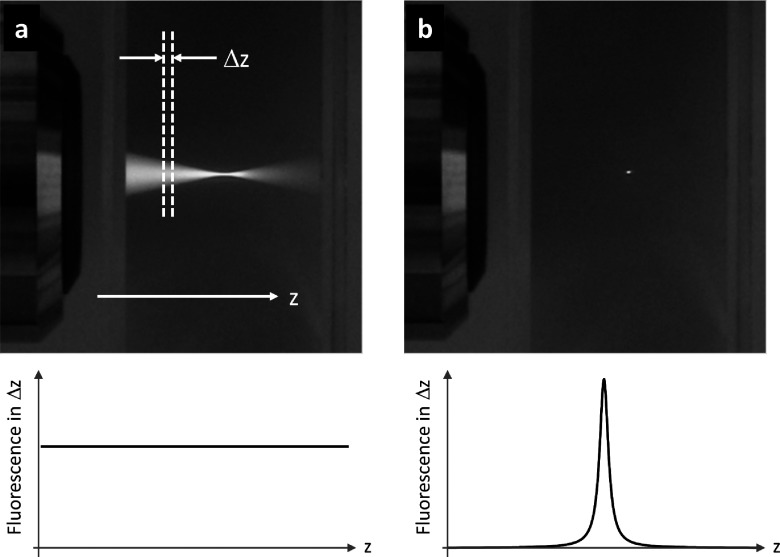
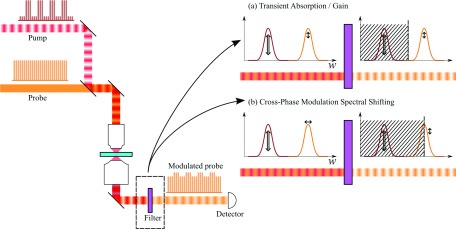
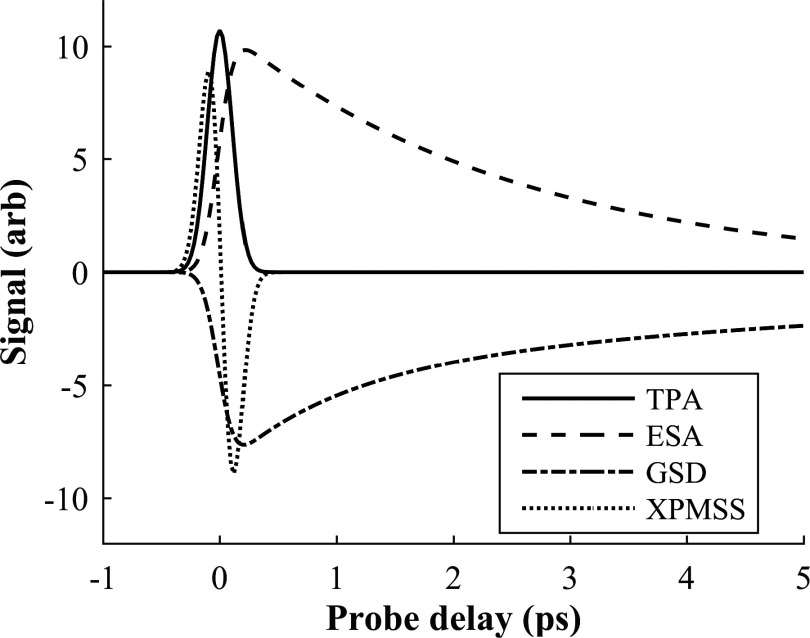
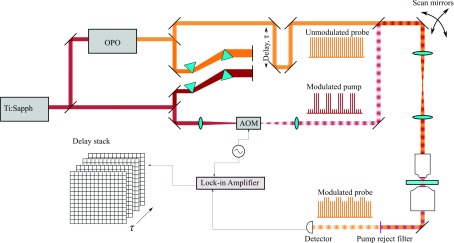
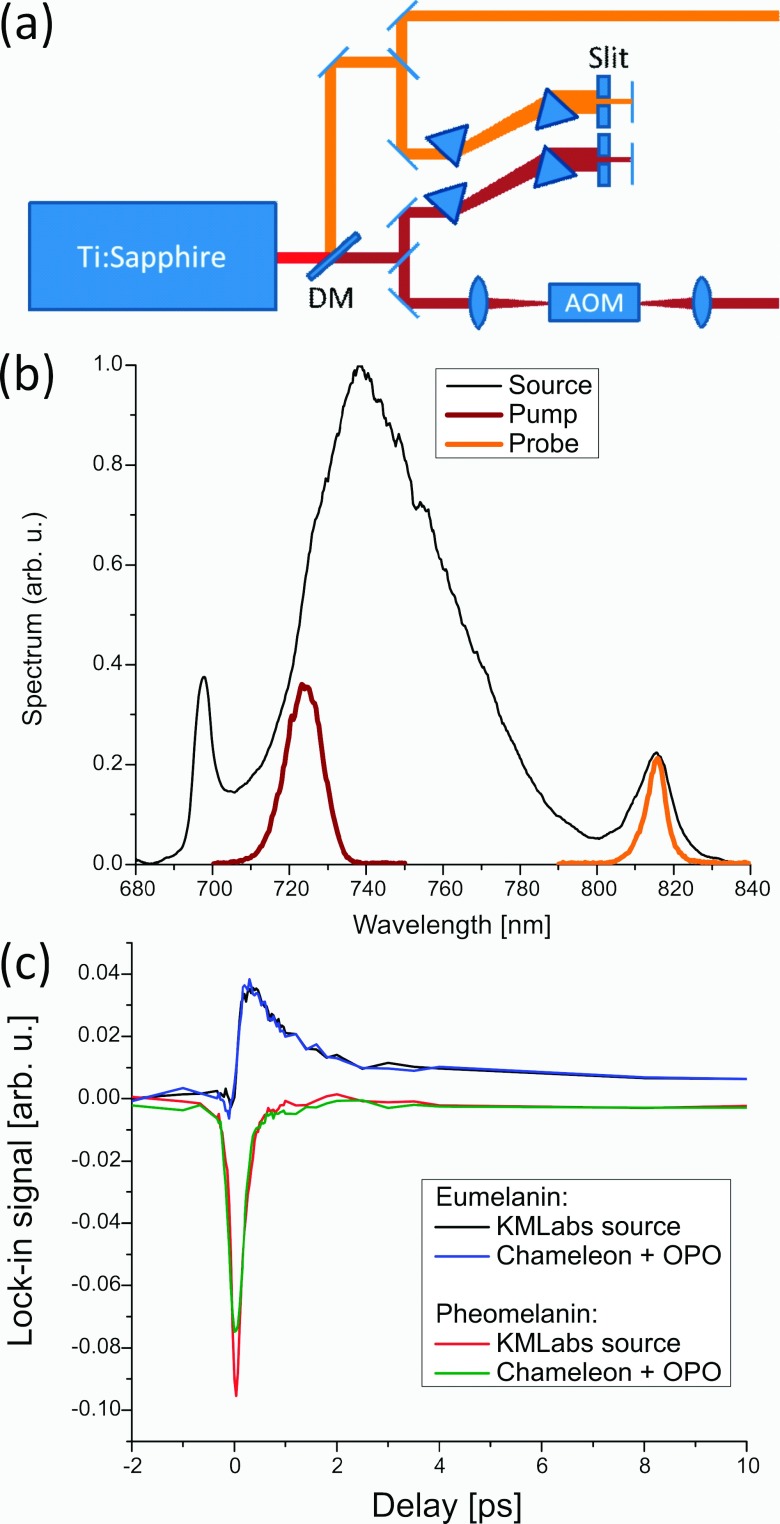
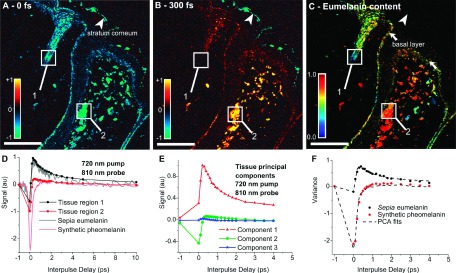
Multiphoton microscopy has rapidly gained popularity in biomedical imaging and materials science because of its ability to provide three-dimensional images at high spatial and temporal resolution even in optically scattering environments. Currently the majority of commercial and home-built devices are based on two-photon fluorescence and harmonic generation contrast. These two contrast mechanisms are relatively easy to measure but can access only a limited range of endogenous targets. Recent developments in fast laser pulse generation, pulse shaping, and detection technology have made accessible a wide range of optical contrasts that utilize multiple pulses of different colors. Molecular excitation with multiple pulses offers a large number of adjustable parameters. For example, in two-pulse pump-probe microscopy, one can vary the wavelength of each excitation pulse, the detection wavelength, the timing between the excitation pulses, and the detection gating window after excitation. Such a large parameter space can provide much greater molecular specificity than existing single-color techniques and allow for structural and functional imaging without the need for exogenous dyes and labels, which might interfere with the system under study. In this review, we provide a tutorial overview, covering principles of pump-probe microscopy and experimental setup, challenges associated with signal detection and data processing, and an overview of applications.


Figures

FIG. 1.
FIG. 1.
Nonlinear optical interactions available for multiphoton image contrast. On the left side of the dashed line are conventional contrast mechanisms: two-photon-excited fluorescence (TPF), second-harmonic generation (SHG), third-harmonic generation (THG), and coherent anti-Stokes Raman scattering (CARS). On the right are additional contrasts accessible with pump-probe microscopy: stimulated Raman scattering (SRS), two-photon absorption (TPA, degenerate or non-degenerate), excited-state absorption (ESA), stimulated emission (SE), ground state depletion (GSD), and cross-phase modulation (XPM).
FIG. 2.
FIG. 2.
Top: fluorescence generated in Rhodamine excited by (a) continuous wave UV light and (b) short near-IR pulses. Bottom: integrated fluorescence from a thin slice of thickness Δz for (a) linear excitation and (b) nonlinear excitation.
FIG. 3.
FIG. 3.
Pump-probe schematic. An intensity-modulated pump and non-modulated probe are combined and passed through a laser scanning microscope. The collected light is filtered before detection by one of two schemes. (a) For transient absorption/gain processes that imprint an amplitude modulation on the probe, the filter only needs to reject the pump before detection. (b) For phase modulation processes that shift the probe optical spectrum, a filter that cuts off part of the probe spectrum converts the spectral shift into an amplitude modulation (XPMSS).
FIG. 4.
FIG. 4.
Typical time traces for various nonlinear interactions (two-photon absorption, excited-state absorption, ground state depletion, and cross-phase modulation spectral shifting [XPMSS, discussed below]).
FIG. 5.
FIG. 5.
Schematic of a typical experimental pump-probe microscopy setup. A portion of the output of an ultrafast oscillator laser source (e.g., Ti:sapphire) is split to pump an optical parametric oscillator (OPO) to generate a synchronized pulse train at a different wavelength. Prism compressors on both beams pre-compensate for dispersion in the setup. The pump is modulated with an acousto-optic modulator (AOM), typically at >1 MHz, and combined with the unmodulated probe by a dichroic mirror. A delay line introduces a computer-controllable pump-probe delay τ. The scan mirrors (galvanometers) are imaged onto the back focal plane of the microscope objective, and the focal spot is raster-scanned through the sample to build up an image. After collecting transmitted light with a condenser, the pump is rejected by a chromatic filter, and the probe is detected with an amplified photodiode. This signal is analyzed with a lock-in amplifier which is synchronized to the pump modulation. Image stacks are constructed by acquiring frames at different pump-probe time delays.
FIG. 6.
FIG. 6.
(a) Schematic of the use of a single broadband laser source. (b) Pump and probe spectra selected from the laser output spectrum. (c) Comparison of pump-probe delay traces in melanin samples for a broadband laser source and an oscillator/OPO combination.
FIG. 7.
FIG. 7.
Summary of PCA processing. (a) and (b) show the raw data, X, at two pump-probe time delays, τ = 0 fs and τ = 300 fs. (d) Spectra from two representative regions, along with that of sepia eumelanin and synthetic pheomelanin. (e) First three PCs, V(t x m′=3), resulting from 137 representative spectra drawn from 32 cutaneous samples. (c) Estimate of the relative melanin concentration (fractional eumelanin, (c′m=1 + c′m=2)/c′m=1). (f) Spectra from the same regions as (d) along with the fits using the PCs. Reproduced from Matthews et al., Sci. Transl. Med. 3, 71ra15 (2011). Published by the American Association for the Advancement of Science.
FIG. 8.
FIG. 8.
(a) Simulated ultrafast pump-probe photodynamics: Even function (solid black line) represents an instantaneous response such as TPA. Odd function (dashed black line) may result from XPM. Unipolar, negative exponential curve (dashed gray line) may result from SRS or GSD. The bipolar signal (solid gray line) is a combination of lines 1-3, and it resembles the eumelanin dynamics. (b) Corresponding phasors at different frequencies ranging from ω = 0.01π to 2π THz. Each point is an increment of 0.01π THz. Adapted with permission from Robles et al., Opt. Express 20, 17082 (2012). Copyright 2012 Optical Society of America.
FIG. 9.
FIG. 9.
(a) Cumulative histogram phasor plot of 42 cutaneous samples. The figure also shows the phasors of standard references of eumelanin (red dot), pheomelanin (green circle), hemoglobin (purple triangle), and surgical ink (blue triangle). The color bar within the figure denotes the color schema used for the image in (b). (b) Representative pump-probe image with colorimetric contrast derived from phasor analysis. (c) Phasor histogram of a representative image in (b). Adapted with permission from Robles et al., Opt. Express 20, 17082 (2012). Copyright 2012 Optical Society of America.
FIG. 10.
FIG. 10.
(a) Eumelanin and pheomelanin, compared with pigments in biopsied human tissue. (b) Response to chemical oxidation and (c) molecular weight. (a) Reproduced from Mathews et al., Sci. Transl. Med. 3, 71ra15 (2011). Published by the American Association for the Advancement of Science; (b) and (c) reproduced from Simpson et al., J. Phys. Chem. A 118, 993 (2014). Copyright 2014 American Chemical Society.
FIG. 11.
FIG. 11.
(a) Molecular contrast in a biopsy section of malignant melanoma and (b) and (c) hemoglobin image (mouse ear) at different pump-probe wavelengths. Red arrow: artery; blue arrows: veins. (a) Reproduced from Simpson et al., J. Invest. Dermatol. 133, 1822 (2013). Published by Elsevier; (b) and (c) reproduced from Fu et al., J. Biomed. Opt. 13, 040503 (2008). Copyright 2008 Society of Photo-Optical Instrumentation Engineers.
FIG. 12.
FIG. 12.
Images of the dermo-epidermal junction in a melanoma biopsy. Shown are XPMSS, transient absorption (tuned to visualize melanin), and combined multiphoton autofluorescence and SHG. The merged image shows the comprehensive contrast through multimodal multiphoton imaging. Adapted with permission from Wilson et al., Biomed. Opt. Express 3, 854 (2012). Copyright 2012 Optical Society of America.
FIG. 13.
FIG. 13.
Transient absorption traces of mineral, inorganic, and organic pigments.
FIG. 14.
FIG. 14.
Pump-probe in historic artwork. Left: the painting was imaged in the region of the angel’s robe with a wavelength combination of 720/810 nm. Right: false-color coded en face images (top, each image is 185 × 185 μm), a virtual cross section, and a maximum intensity projection (bottom, dimensions are 185 × 50 μm). Adapted from Villafana et al., Proc. Natl. Acad. Sci. U. S. A. 111, 1708 (2014). Copyright 2014 National Academy of Sciences of the United States of America.

References

    1. Franken P. A., Weinreich G., Peters C. W., and Hill A. E., “Generation of optical harmonics,” Phys. Rev. Lett. 7, 118 (1961).10.1103/PhysRevLett.7.118 - DOI
    1. Denk W., Strickler J. H., and Webb W. W., “Two-photon laser scanning fluorescence microscopy,” Science 248, 73 (1990).10.1126/science.2321027 - DOI - PubMed
    1. Williams R. M., Zipfel W. R., and Webb W. W., “Multiphoton microscopy in biological research,” Curr. Opin. Chem. Biol. 5, 603 (2001).10.1016/S1367-5931(00)00241-6 - DOI - PubMed
    1. Hartland G. V., “Ultrafast studies of single semiconductor and metal nanostructures through transient absorption microscopy,” Chem. Sci. 1, 303 (2010).10.1039/c0sc00243g - DOI
    1. Zipfel W. R., Williams R. M., and Webb W. W., “Nonlinear magic: Multiphoton microscopy in the biosciences,” Nat. Biotechnol. 21, 1369 (2003).10.1038/nbt899 - DOI - PubMed

Publication types