

On the use of propensity scores in case of rare exposure
- PMID: 27036963
- PMCID: PMC4815252
- DOI: 10.1186/s12874-016-0135-1
On the use of propensity scores in case of rare exposure
Abstract
Background: Observational post-marketing assessment studies often involve evaluating the effect of a rare treatment on a time-to-event outcome, through the estimation of a marginal hazard ratio. Propensity score (PS) methods are the most used methods to estimate marginal effect of an exposure in observational studies. However there is paucity of data concerning their performance in a context of low prevalence of exposure.
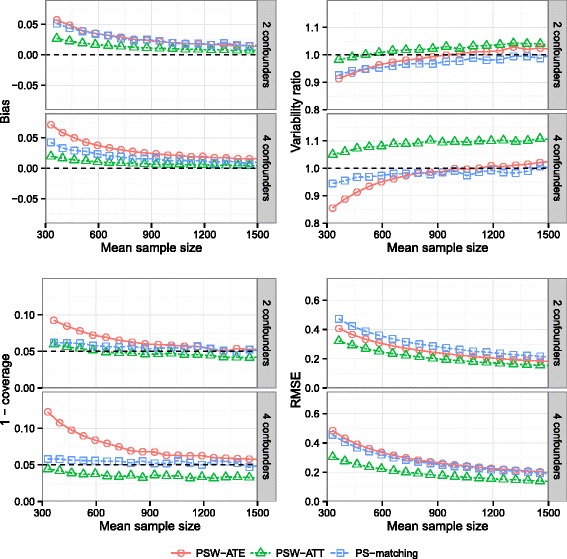
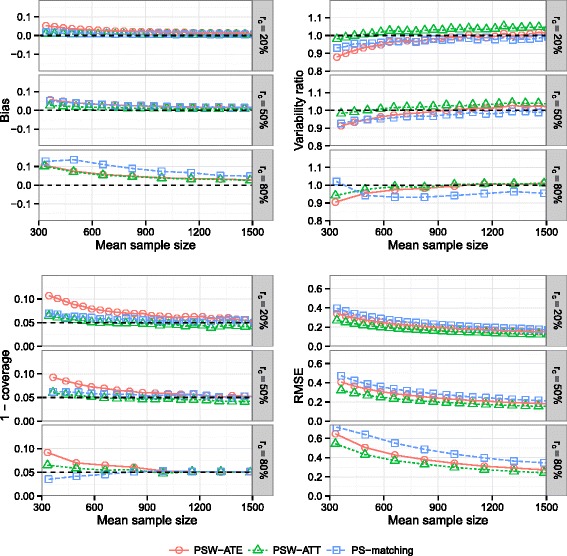
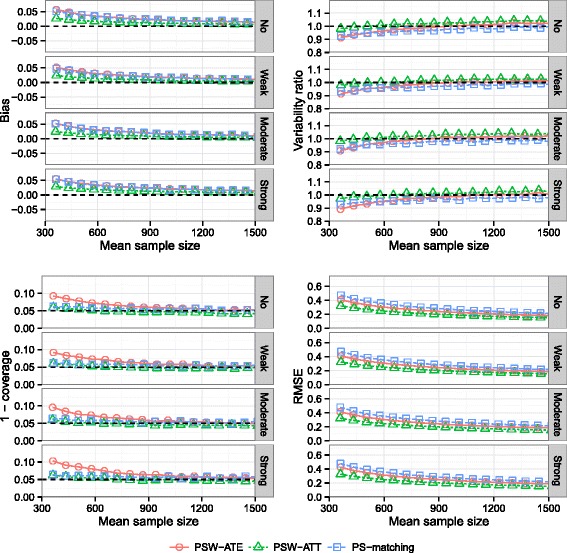
Methods: We conducted an extensive series of Monte Carlo simulations to examine the performance of the two preferred PS methods, known as PS-matching and PS-weighting to estimate marginal hazard ratios, through various scenarios.
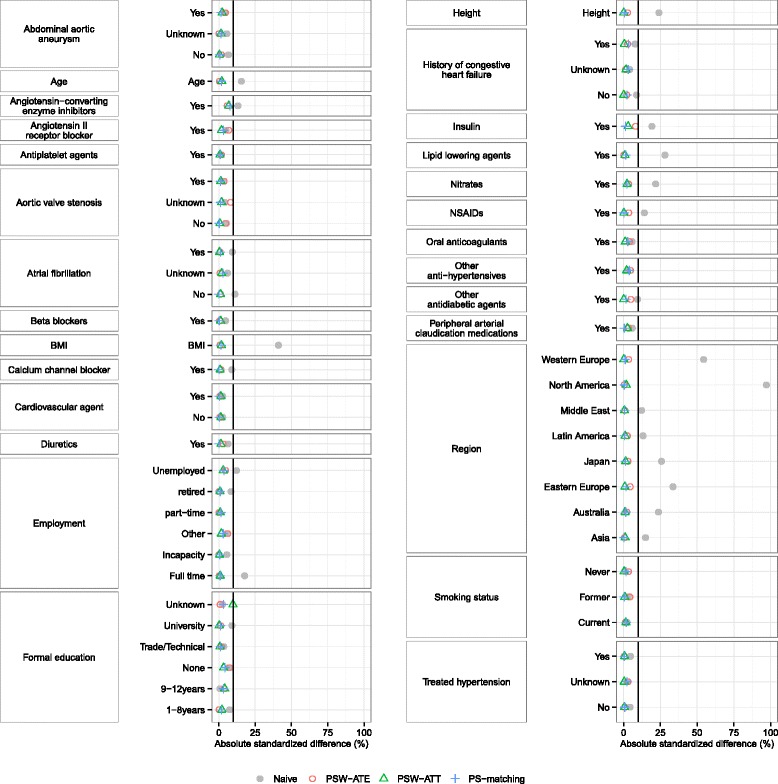
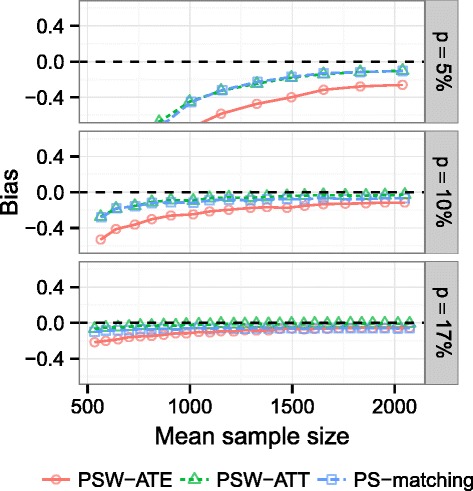
Results: We found that both PS-weighting and PS-matching could be biased when estimating the marginal effect of rare exposure. The less biased results were obtained with estimators of average treatment effect in the treated population (ATT), in comparison with estimators of average treatment effect in the overall population (ATE). Among ATT estimators, PS-weighting using ATT weights outperformed PS-matching. These results are illustrated using a real observational study.
Conclusions: When clinical objectives are focused on the treated population, applied researchers are encouraged to estimate ATT with PS-weighting for studying the relative effect of a rare treatment on time-to-event outcomes.
Keywords: Hazard ratio; Monte Carlo simulations; Observational studies; Pharmacoepidemiology; Propensity scores; Rare exposure.
Figures
Similar articles
-
The performance of different propensity score methods for estimating marginal hazard ratios.Stat Med. 2013 Jul 20;32(16):2837-49. doi: 10.1002/sim.5705. Epub 2012 Dec 12. Stat Med. 2013. PMID: 23239115 Free PMC article.
-
The performance of inverse probability of treatment weighting and full matching on the propensity score in the presence of model misspecification when estimating the effect of treatment on survival outcomes.Stat Methods Med Res. 2017 Aug;26(4):1654-1670. doi: 10.1177/0962280215584401. Epub 2015 Apr 30. Stat Methods Med Res. 2017. PMID: 25934643 Free PMC article.
-
Improving causal inference with a doubly robust estimator that combines propensity score stratification and weighting.J Eval Clin Pract. 2017 Aug;23(4):697-702. doi: 10.1111/jep.12714. Epub 2017 Jan 24. J Eval Clin Pract. 2017. PMID: 28116816
-
Observational Research Using Propensity Scores.Adv Chronic Kidney Dis. 2016 Nov;23(6):367-372. doi: 10.1053/j.ackd.2016.11.010. Adv Chronic Kidney Dis. 2016. PMID: 28115080 Review.
-
Use and Interpretation of Propensity Scores in Aging Research: A Guide for Clinical Researchers.J Am Geriatr Soc. 2016 Oct;64(10):2065-2073. doi: 10.1111/jgs.14253. Epub 2016 Aug 22. J Am Geriatr Soc. 2016. PMID: 27550392 Free PMC article. Review.
Cited by
-
Medications for Opioid Use Disorder and Mortality and Hospitalization Among People With Opioid Use-related Infections.Epidemiology. 2024 Jan 1;35(1):7-15. doi: 10.1097/EDE.0000000000001681. Epub 2023 Oct 11. Epidemiology. 2024. PMID: 37820243 Free PMC article.
-
Identifying the effect of inherited bleeding disorders on the development of postpartum hemorrhage: a population-based, retrospective cohort study.Res Pract Thromb Haemost. 2023 Mar 10;7(2):100104. doi: 10.1016/j.rpth.2023.100104. eCollection 2023 Feb. Res Pract Thromb Haemost. 2023. PMID: 37063757 Free PMC article.
-
Performance of matching methods in studies of rare diseases: a simulation study.Intractable Rare Dis Res. 2020 May;9(2):79-88. doi: 10.5582/irdr.2020.01016. Intractable Rare Dis Res. 2020. PMID: 32494554 Free PMC article.
-
G-computation, propensity score-based methods, and targeted maximum likelihood estimator for causal inference with different covariates sets: a comparative simulation study.Sci Rep. 2020 Jun 8;10(1):9219. doi: 10.1038/s41598-020-65917-x. Sci Rep. 2020. PMID: 32514028 Free PMC article.
-
Can supervised deep learning architecture outperform autoencoders in building propensity score models for matching?BMC Med Res Methodol. 2024 Aug 2;24(1):167. doi: 10.1186/s12874-024-02284-5. BMC Med Res Methodol. 2024. PMID: 39095707 Free PMC article.
References
-
- Rafaniello C, Lombardo F, Ferrajolo C, Sportiello L, Parretta E, Formica R, Potenza S, Rinaldi B, Irpino A, Raschetti R, Vanacore N, Rossi F, Capuano A. Predictors of mortality in atypical antipsychotic-treated community-dwelling elderly patients with behavioural and psychological symptoms of dementia: a prospective population-based cohort study from Italy. Eur J Clin Pharmacol. 2014;70(2):187–95. doi: 10.1007/s00228-013-1588-3. - DOI - PubMed
-
- Beigel F, Steinborn A, Schnitzler F, Tillack C, Breiteneicher S, John JM, Van Steen K, Laubender RP, Göke B, Seiderer J, Brand S, Ochsenkühn T. Risk of malignancies in patients with inflammatory bowel disease treated with thiopurines or anti-TNF alpha antibodies. Pharmacoepidemiology and Drug Safety. 2014;23(7):735–44. doi: 10.1002/pds.3621. - DOI - PubMed
-
- Kestenbaum B. Methods to Control for Confounding. In: Epidemiology and Biostatistics. New York: Springer: 2009. p. 101–11.
Publication types
MeSH terms
Substances
LinkOut - more resources
Full Text Sources
Other Literature Sources
Research Materials
