

Ozone Inhalation Provokes Glucocorticoid-Dependent and -Independent Effects on Inflammatory and Metabolic Pathways
- PMID: 27037194
- PMCID: PMC12077420
- DOI: 10.1093/toxsci/kfw061
Ozone Inhalation Provokes Glucocorticoid-Dependent and -Independent Effects on Inflammatory and Metabolic Pathways
Abstract
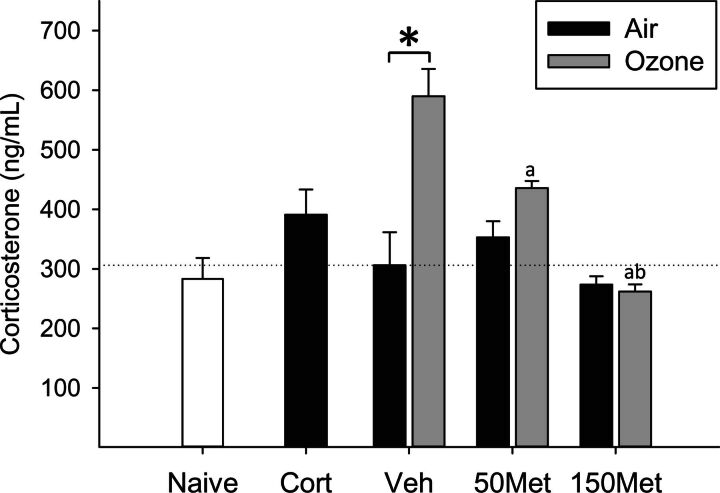
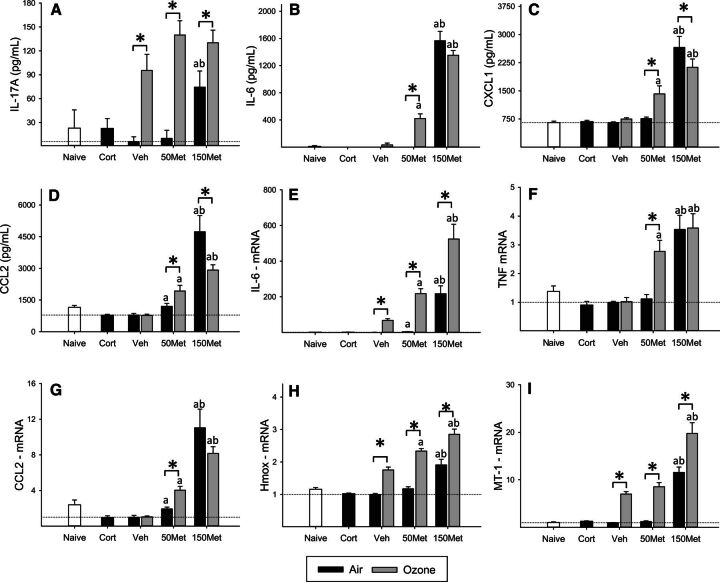
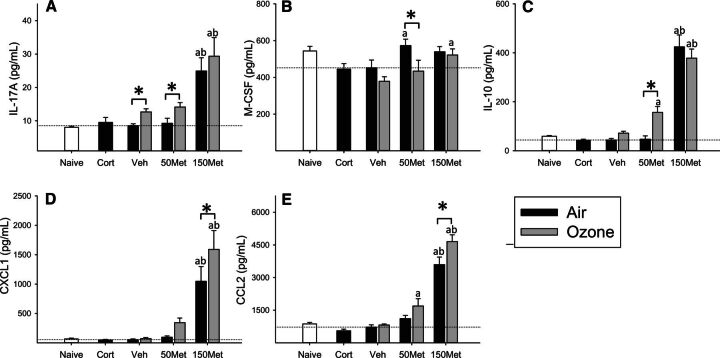
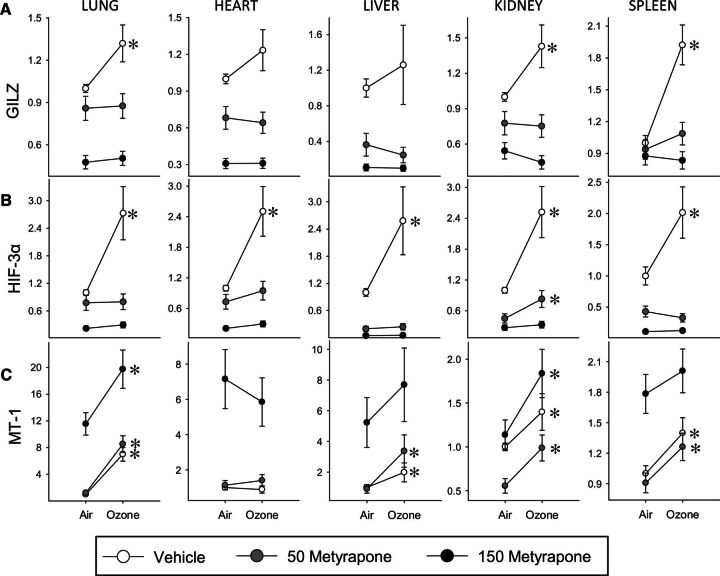
Growing evidence implicates air pollutants in adverse health effects beyond respiratory and cardiovascular disease, including metabolic impacts (diabetes, metabolic syndrome, obesity) and neurological/neurobehavioral outcomes (neurodegenerative disease, cognitive decline, perceived stress, depression, suicide). We have shown that inhalation of particulate matter or ozone activates the hypothalamic-pituitary-adrenal axis in rats and increases plasma levels of the glucocorticoid corticosterone. To investigate the role of corticosterone in mediating inflammatory and metabolic effects of pollutant exposure, in this study male Fischer-344 rats were administered the 11β-hydroxylase inhibitor metyrapone (0, 50, 150 mg/kg body weight) and exposed by nose-only inhalation for 4 h to air or 0.8 ppm ozone. Ozone inhalation provoked a 2-fold increase in plasma corticosterone, an effect blocked by metyrapone, but did not alter epinephrine levels. Inhibition of corticosterone production was associated with increased inflammatory signaling in the lungs and plasma in response to ozone, consistent with a role for glucocorticoids in limiting local and systemic inflammatory responses. Effects of ozone on insulin and glucagon, but not ghrelin or plasminogen activator inhibitor-1, were modified by metyrapone, revealing glucocorticoid-dependent and -independent effects on circulating metabolic and hemostatic factors. Several immunosuppressive and metabolic impacts of ozone in the lungs, heart, liver, kidney, and spleen were blocked by metyrapone and reproduced through exogenous administration of corticosterone (10 mg/kg body weight), demonstrating glucocorticoid-dependent effects in target tissues. Our results support involvement of endogenous glucocorticoids in ozone-induced inflammatory and metabolic effects, providing insight into potential biological mechanisms underlying health impacts and susceptibility.
Keywords: air pollution; glucocorticoid; hypothalamic–pituitary–adrenal (HPA) axis; inflammation; metabolic effects.; ozone; stress response; systemic effects.
© Crown copyright 2016.
Figures
Similar articles
-
Mapping acute systemic effects of inhaled particulate matter and ozone: multiorgan gene expression and glucocorticoid activity.Toxicol Sci. 2013 Sep;135(1):169-81. doi: 10.1093/toxsci/kft137. Epub 2013 Jun 26. Toxicol Sci. 2013. PMID: 23805001 Free PMC article.
-
Ozone modifies the metabolic and endocrine response to glucose: Reproduction of effects with the stress hormone corticosterone.Toxicol Appl Pharmacol. 2018 Mar 1;342:31-38. doi: 10.1016/j.taap.2018.01.020. Epub 2018 Jan 31. Toxicol Appl Pharmacol. 2018. PMID: 29391239
-
Stress hormones as potential mediators of air pollutant effects on the brain: Rapid induction of glucocorticoid-responsive genes.Environ Res. 2019 Nov;178:108717. doi: 10.1016/j.envres.2019.108717. Epub 2019 Sep 4. Environ Res. 2019. PMID: 31520820
-
Neuroendocrine Regulation of Air Pollution Health Effects: Emerging Insights.Toxicol Sci. 2018 Jul 1;164(1):9-20. doi: 10.1093/toxsci/kfy129. Toxicol Sci. 2018. PMID: 29846720 Free PMC article. Review.
-
Air Pollution, Stress, and Allostatic Load: Linking Systemic and Central Nervous System Impacts.J Alzheimers Dis. 2019;69(3):597-614. doi: 10.3233/JAD-190015. J Alzheimers Dis. 2019. PMID: 31127781 Free PMC article. Review.
Cited by
-
Co-Expression Network Modeling Identifies Specific Inflammation and Neurological Disease-Related Genes mRNA Modules in Mood Disorder.Front Genet. 2022 Mar 21;13:865015. doi: 10.3389/fgene.2022.865015. eCollection 2022. Front Genet. 2022. PMID: 35386281 Free PMC article.
-
Susceptibility Variations in Air Pollution Health Effects: Incorporating Neuroendocrine Activation.Toxicol Pathol. 2019 Dec;47(8):962-975. doi: 10.1177/0192623319878402. Epub 2019 Oct 8. Toxicol Pathol. 2019. PMID: 31594484 Free PMC article.
-
Aging Exacerbates Neuroinflammatory Outcomes Induced by Acute Ozone Exposure.Toxicol Sci. 2018 May 1;163(1):123-139. doi: 10.1093/toxsci/kfy014. Toxicol Sci. 2018. PMID: 29385576 Free PMC article.
-
Anemia prevalence and hemoglobin levels are associated with long-term exposure to air pollution in an older population.Environ Int. 2017 Apr;101:125-132. doi: 10.1016/j.envint.2017.01.017. Epub 2017 Jan 31. Environ Int. 2017. PMID: 28153527 Free PMC article.
-
Air pollution and suicide risk: another adverse effect of air pollution?Eur J Epidemiol. 2017 Nov;32(11):943-946. doi: 10.1007/s10654-017-0329-9. Epub 2017 Nov 3. Eur J Epidemiol. 2017. PMID: 29101595 Free PMC article. No abstract available.
References
-
- Alessi M. C. Juhan-Vague I. (2006). PAI-1 and the metabolic syndrome: Links, causes, and consequences. Arterioscler. Thromb. Vasc. Biol. 26, 2200–2207. - PubMed
-
- Anagnostis P. Athyros V. G. Tziomalos K. Karagiannis A. Mikhailidis D. P. (2009). Clinical review: The pathogenetic role of cortisol in the metabolic syndrome: A hypothesis. J. Clin. Endocrinol. Metab. 94, 2692–2701. - PubMed
Publication types
MeSH terms
Substances
LinkOut - more resources
Full Text Sources
Other Literature Sources
Medical
