. 2016 Jun;203(2):881-91.
doi: 10.1534/genetics.116.186890. Epub 2016 Apr 2.

The Genetic Cost of Neanderthal Introgression

Affiliations

The Genetic Cost of Neanderthal Introgression

Kelley Harris et al. Genetics. 2016 Jun.

Abstract

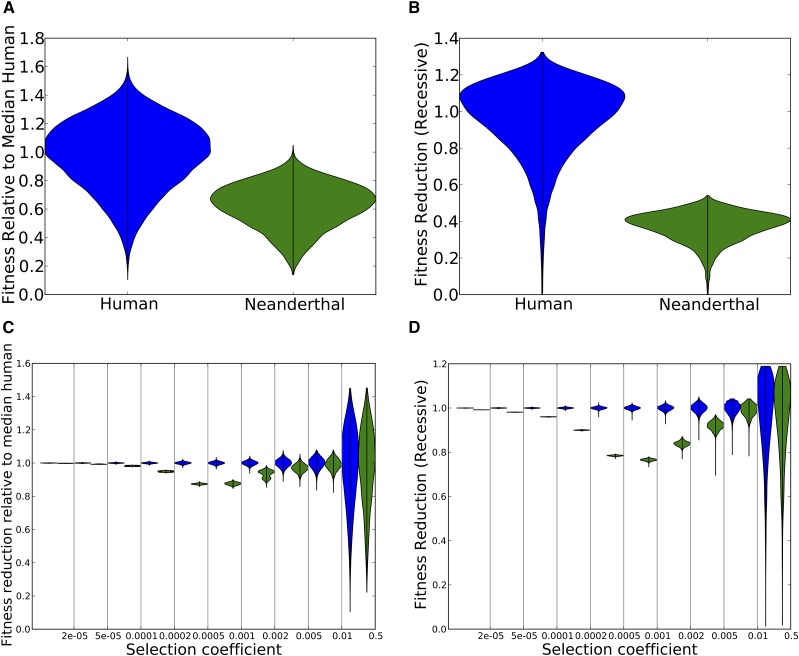
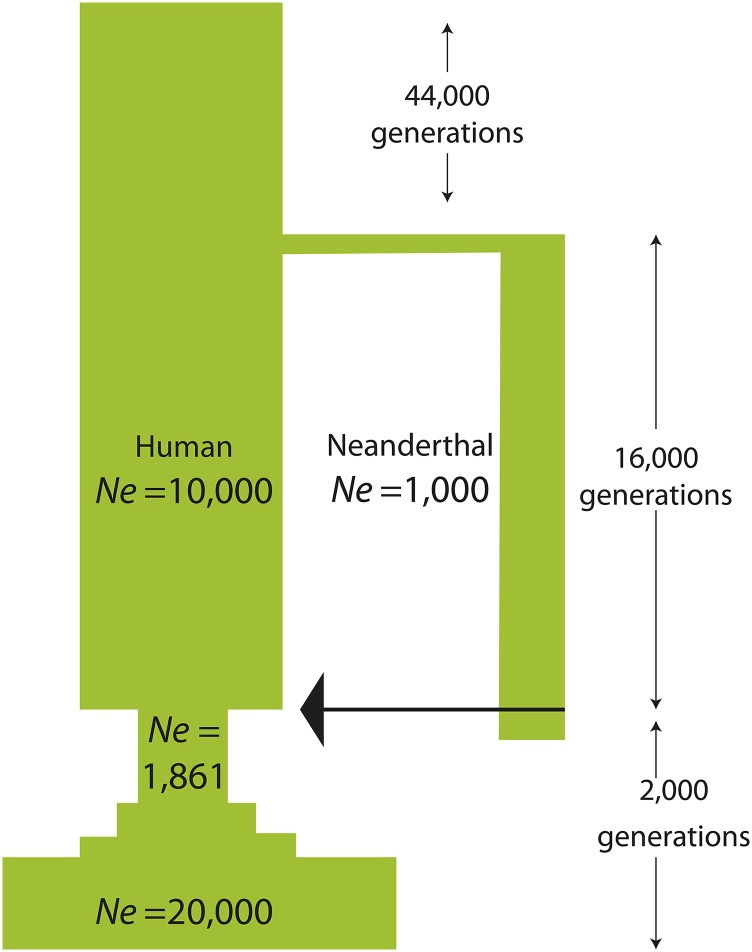
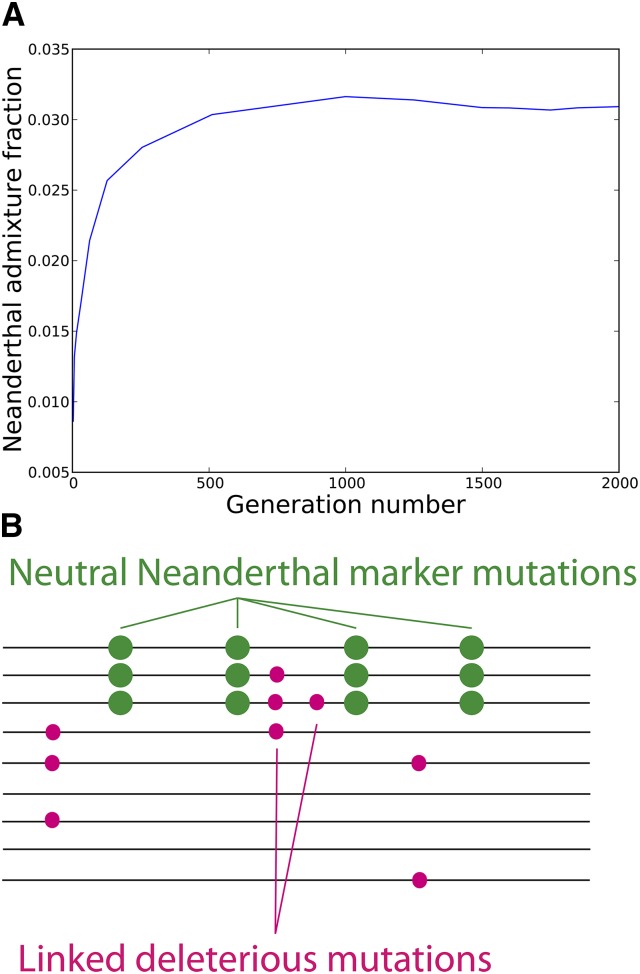
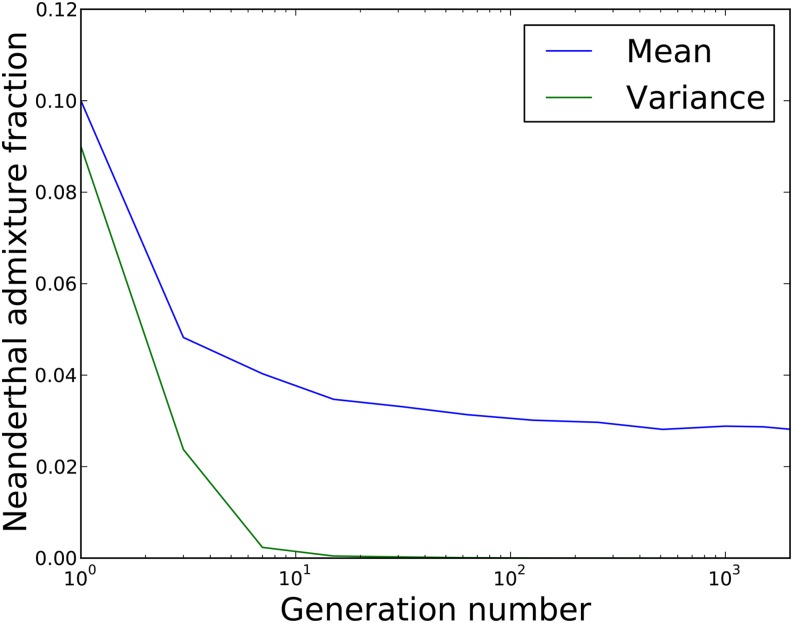
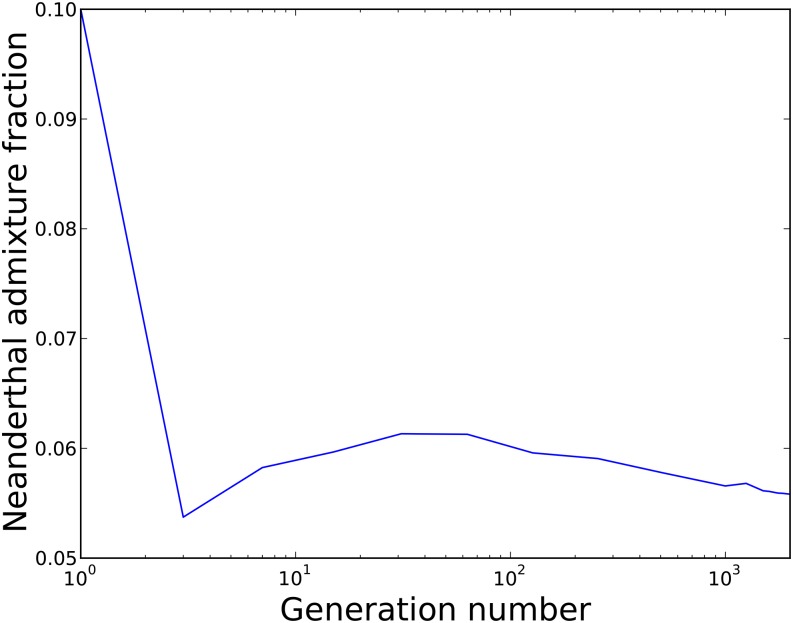
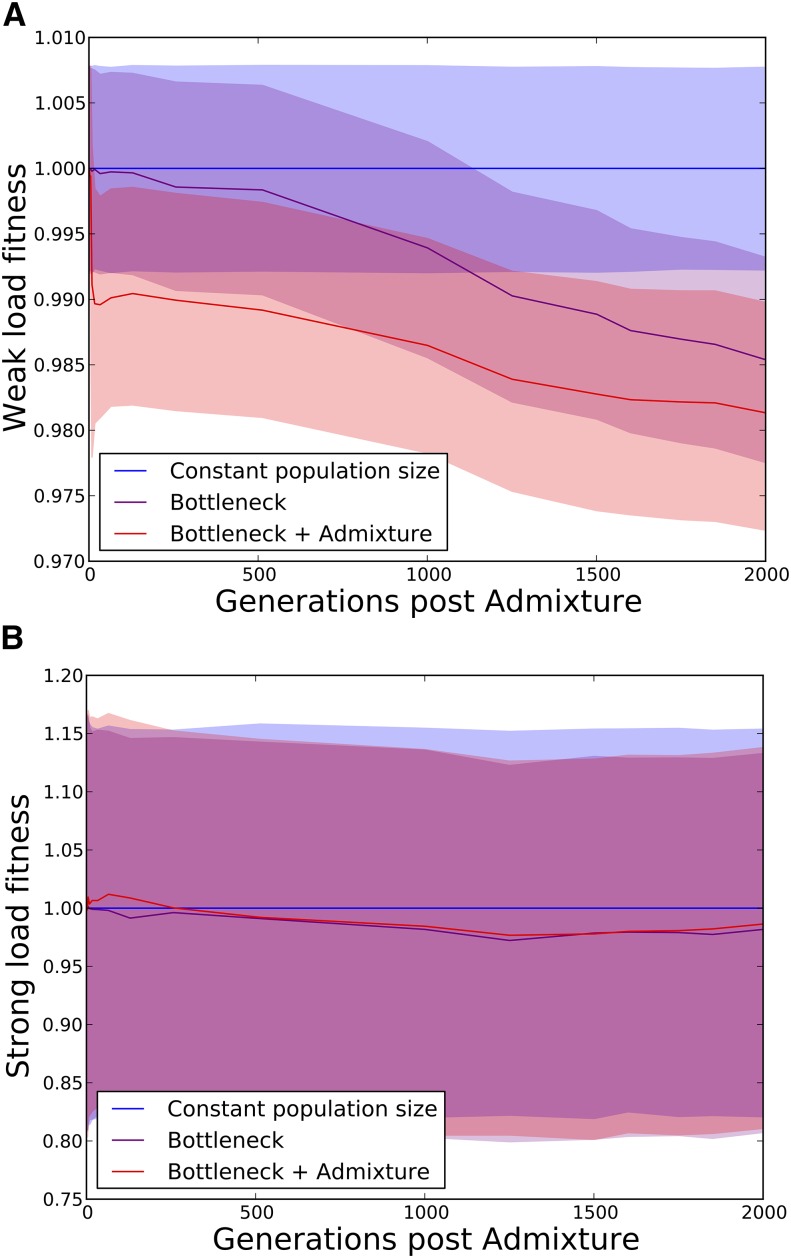
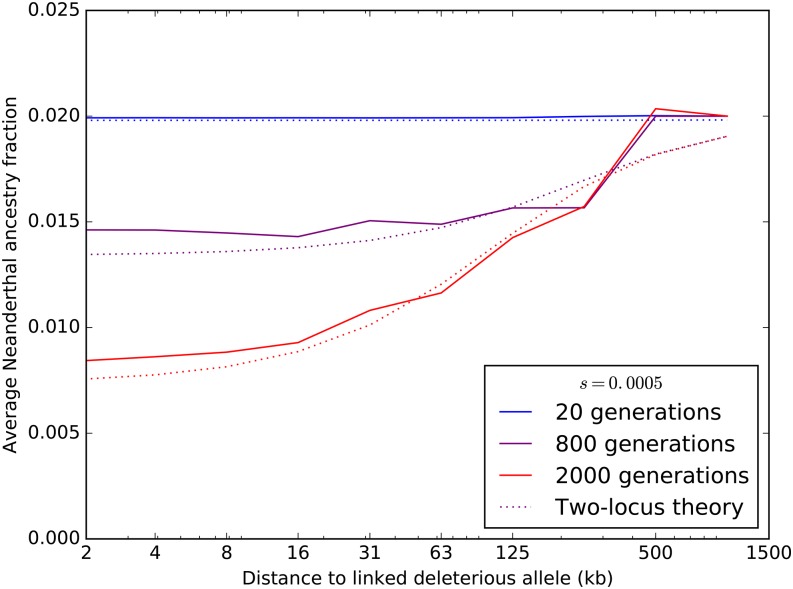
Approximately 2-4% of genetic material in human populations outside Africa is derived from Neanderthals who interbred with anatomically modern humans. Recent studies have shown that this Neanderthal DNA is depleted around functional genomic regions; this has been suggested to be a consequence of harmful epistatic interactions between human and Neanderthal alleles. However, using published estimates of Neanderthal inbreeding and the distribution of mutational fitness effects, we infer that Neanderthals had at least 40% lower fitness than humans on average; this increased load predicts the reduction in Neanderthal introgression around genes without the need to invoke epistasis. We also predict a residual Neanderthal mutational load in non-Africans, leading to a fitness reduction of at least 0.5%. This effect of Neanderthal admixture has been left out of previous debate on mutation load differences between Africans and non-Africans. We also show that if many deleterious mutations are recessive, the Neanderthal admixture fraction could increase over time due to the protective effect of Neanderthal haplotypes against deleterious alleles that arose recently in the human population. This might partially explain why so many organisms retain gene flow from other species and appear to derive adaptive benefits from introgression.

Keywords: archaic hominins; deleterious mutation load; gene flow; heterosis; nearly neutral theory.


Figures

Figure 1
Figure 1
(A) The distribution of fitness in Neanderthals vs. nonadmixed humans, assuming that their effective population sizes differed 10-fold since their divergence 16,000 generations ago and assuming additive mutation effects. After simulating the two populations using SLiM, we calculated each individual’s fitness relative to the median human. The violin plots of the two distributions show significant variance within each population but lower fitness in Neanderthals. (B) The same as in A but for a model of recessive mutations. C and D show the same data as in A and B, respectively, but stratified into different bins of selection coefficients. The fitness reduction due to mutations with s between 2×10⁴ and 5×10⁴ is much greater in Neanderthals than in humans. In contrast, the fitness reduction due to very weak effect mutations s<2×10⁵ is similar between the two populations, as is the fitness reduction due to strongly deleterious mutations with s>0.005. This is expected as mutations outside this range are either effectively neutral in both populations or strongly deleterious in both populations.
Figure 2
Figure 2
the demographic history used to simulate Neanderthal and human genomes. A single ancestral population of size 10,000 is simulated for 44,000 generations to let the distribution of deleterious mutations reach equilibrium. At this point, a Neanderthal population of size 1000 splits off. After 16,000 generations of isolation, Neanderthals and humans admix, followed by the out-of-Africa bottleneck and piecewise-constant exponential growth.
Figure 3
Figure 3
Neanderthal admixture over 2000 generations in a simulation where all mutations are recessive. The initial admixture fraction is only 1%, but rises to 3% genome-wide due to selection for Neanderthal haplotypes that protect against human recessive mutations. The accompanying cartoon illustrates how neutral marker mutations (one every 105 bp) are used to measure the Neanderthal admixture fraction as a function of time. The average frequency of these markers, an estimate of the total admixture fraction, is reduced by selection on linked deleterious mutations.
Figure 4
Figure 4
The mean and variance of the Neanderthal ancestry fraction in an admixed population where fitness effects are additive, starting with 10% Neanderthals in generation 1. During the first 10–20 generations after admixture, both the mean and variance in Neanderthal ancestry decrease quickly due to selection against individuals whose Neanderthal ancestry fraction is higher than the population average. After 20 generations, however, all individuals have nearly the same amount of Neanderthal ancestry and selection against its deleterious component becomes less efficient.
Figure 5
Figure 5
Variance of Neanderthal ancestry with time in a population where all mutations are partially recessive with dominance coefficient h=0.1. Interestingly, selection against partially recessive foreign alleles was not monotonic; the Neanderthal admixture fraction actually increased due to heterosis for a few tens of generations after undershooting its asymptotic value.
Figure 6
Figure 6
(A and B) Plots showing the mutation load in three simulated human populations, one with constant population size, one that experiences only the out-of-Africa bottleneck, and a third that experiences the bottleneck along with Neanderthal admixture (see Figure 2), assuming additive fitness effects. We partition each individual’s mutation load into two components: the weak load due to mutations with selection coefficient <0.0005 and the strong load due to mutations with selection coefficient >0.0005 (note the difference in scale between the two y-axes). At time t, each individual’s weak-load fitness and strong-load fitness are normalized relative to that of the median individual in the constant-size population. The solid lines show the median in each respective population, and the colored areas encompass the 25th–75th percentiles. A shows that the admixed population suffers the greatest fitness reduction due to weak mutations, even 2000 generations after admixture. B shows that neither the bottleneck nor admixture affects the strong load.
Figure 7
Figure 7
Each colored curve plots the average fraction of Neanderthal ancestry after T generations of admixture (T=20, 800, or 2000) as a function of distance from an introgressed deleterious mutation, assuming an additive model of dominance effects. Solid lines show simulation results averaged over 300 SLiM replicates. For each time point, a dotted line of the same color as the simulation line shows the Neanderthal ancestry fraction profile that is predicted by Equation 2.

References

    1. Abi-Rached L., Jobin M., Kulkarni S., McWhinnie A., Dalva K., et al. , 2011. The shaping of modern human immune systems by multiregional admixture with archaic humans. Science 334: 89–94. - PMC - PubMed
    1. Agrawal A., Whitlock M., 2011. Inferences about the distribution of dominance drawn from yeast knockout data. Genetics 187: 553–566. - PMC - PubMed
    1. Allendorf F., Hohenlohe P., Luikart G., 2010. Genomics and the future of conservation genetics. Nat. Rev. Genet. 11: 697–709. - PubMed
    1. Assaf Z., Petrov D., Blundell J., 2015. Obstruction of adaptation in diploids by recessive, strongly deleterious alleles. Proc. Natl. Acad. Sci. USA 112: E2658–E2666. - PMC - PubMed
    1. Balick D., Do R., Cassa C., Reich D., Sunyaev S., 2015. Dominance of deleterious alleles controls the response to a population bottleneck. PLoS Genet. 11: e1005436. - PMC - PubMed

Publication types