

Brain imaging of neurovascular dysfunction in Alzheimer's disease
- PMID: 27038189
- PMCID: PMC5283382
- DOI: 10.1007/s00401-016-1570-0
Brain imaging of neurovascular dysfunction in Alzheimer's disease
Abstract
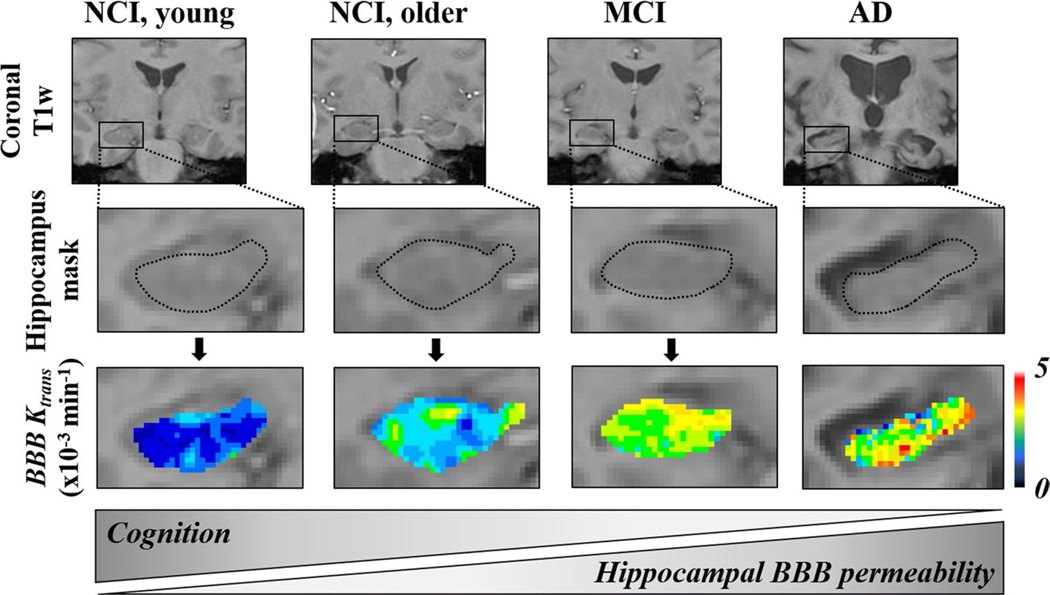
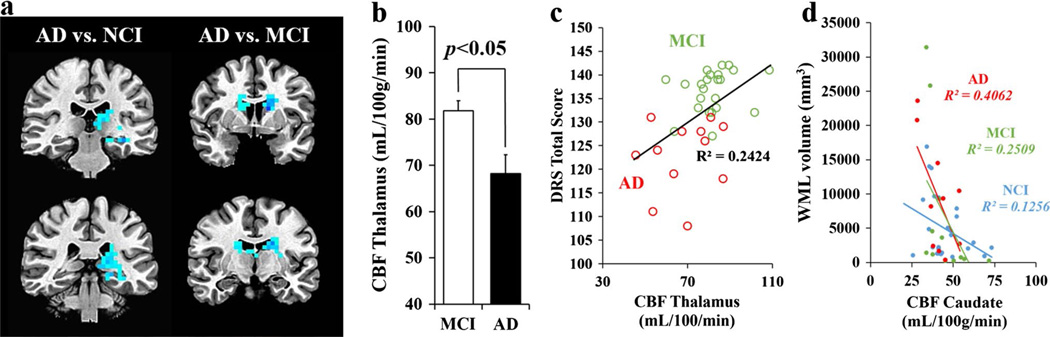
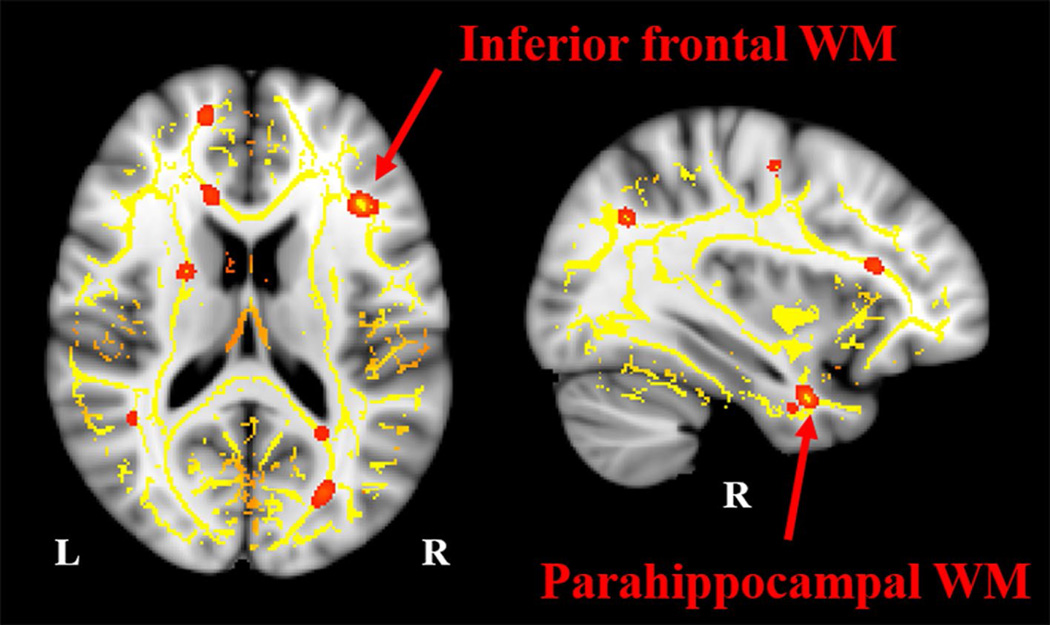
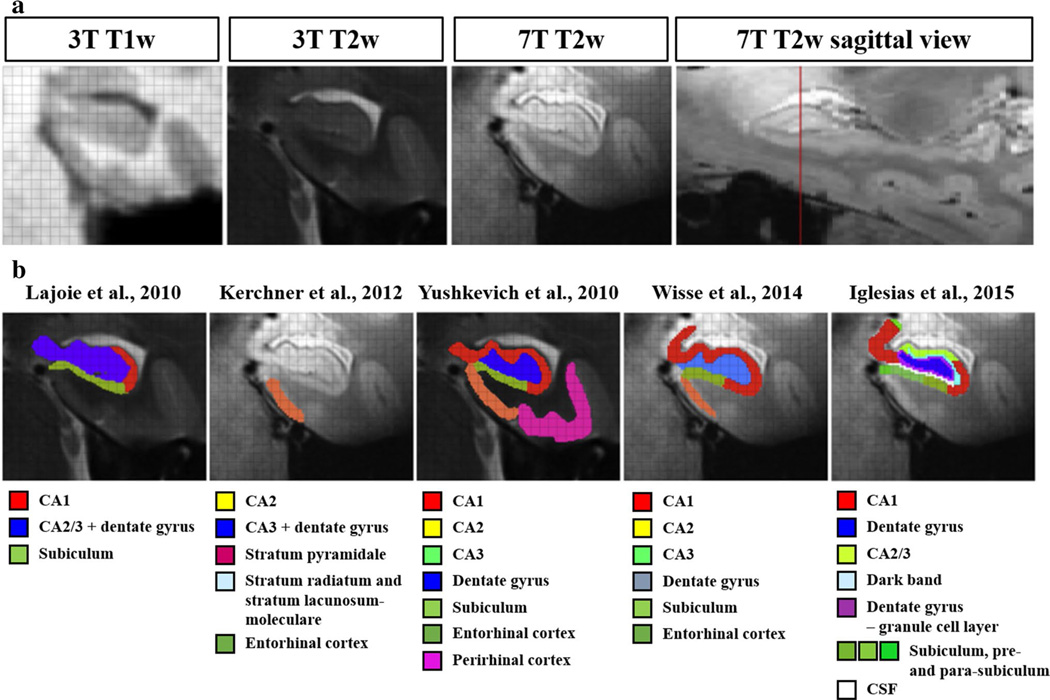
Neurovascular dysfunction, including blood-brain barrier (BBB) breakdown and cerebral blood flow (CBF) dysregulation and reduction, are increasingly recognized to contribute to Alzheimer's disease (AD). The spatial and temporal relationships between different pathophysiological events during preclinical stages of AD, including cerebrovascular dysfunction and pathology, amyloid and tau pathology, and brain structural and functional changes remain, however, still unclear. Recent advances in neuroimaging techniques, i.e., magnetic resonance imaging (MRI) and positron emission tomography (PET), offer new possibilities to understand how the human brain works in health and disease. This includes methods to detect subtle regional changes in the cerebrovascular system integrity. Here, we focus on the neurovascular imaging techniques to evaluate regional BBB permeability (dynamic contrast-enhanced MRI), regional CBF changes (arterial spin labeling- and functional-MRI), vascular pathology (structural MRI), and cerebral metabolism (PET) in the living human brain, and examine how they can inform about neurovascular dysfunction and vascular pathophysiology in dementia and AD. Altogether, these neuroimaging approaches will continue to elucidate the spatio-temporal progression of vascular and neurodegenerative processes in dementia and AD and how they relate to each other.
Keywords: Alzheimer’s disease; Blood–brain barrier; Cerebral blood flow; Magnetic resonance imaging; Neurovascular dysfunction.
Figures
References
-
- den Abeelen ASSM, Lagro J, van Beek AHEA, Claassen JAHR. Impaired cerebral autoregulation and vasomotor reactivity in sporadic Alzheimer’s disease. Curr Alzheimer Res. 2014;11:11–17. - PubMed
-
- Acosta-Cabronero J, Williams GB, Pengas G, Nestor PJ. Absolute diffusivities define the landscape of white matter degeneration in Alzheimer’s disease. Brain J Neurol. 2010;133:529–539. - PubMed
-
- Alexopoulos P, Sorg C, Förschler A, Grimmer T, Skokou M, Wohlschläger A, Perneczky R, Zimmer C, Kurz A, Preibisch C. Perfusion abnormalities in mild cognitive impairment and mild dementia in Alzheimer’s disease measured by pulsed arterial spin labeling MRI. Eur Arch Psychiatry Clin Neurosci. 2012;262:69–77. - PubMed
Publication types
MeSH terms
Grants and funding
- R37AG23084/AG/NIA NIH HHS/United States
- R37NS34467/NS/NINDS NIH HHS/United States
- R01 NS034467/NS/NINDS NIH HHS/United States
- R01AG046928/AG/NIA NIH HHS/United States
- R01AG039452/AG/NIA NIH HHS/United States
- R21 AG055034/AG/NIA NIH HHS/United States
- P41EB015922/EB/NIBIB NIH HHS/United States
- P41 EB015922/EB/NIBIB NIH HHS/United States
- R37 NS034467/NS/NINDS NIH HHS/United States
- R01 AG039452/AG/NIA NIH HHS/United States
- R01 AG046928/AG/NIA NIH HHS/United States
- P50 AG005142/AG/NIA NIH HHS/United States
- RF1 AG039452/AG/NIA NIH HHS/United States
- R37 AG023084/AG/NIA NIH HHS/United States
LinkOut - more resources
Full Text Sources
Other Literature Sources
Medical
