

Deletion of Kvβ1.1 subunit leads to electrical and haemodynamic changes causing cardiac hypertrophy in female murine hearts
- PMID: 27038296
- PMCID: PMC4827621
- DOI: 10.1113/EP085405
Deletion of Kvβ1.1 subunit leads to electrical and haemodynamic changes causing cardiac hypertrophy in female murine hearts
Abstract
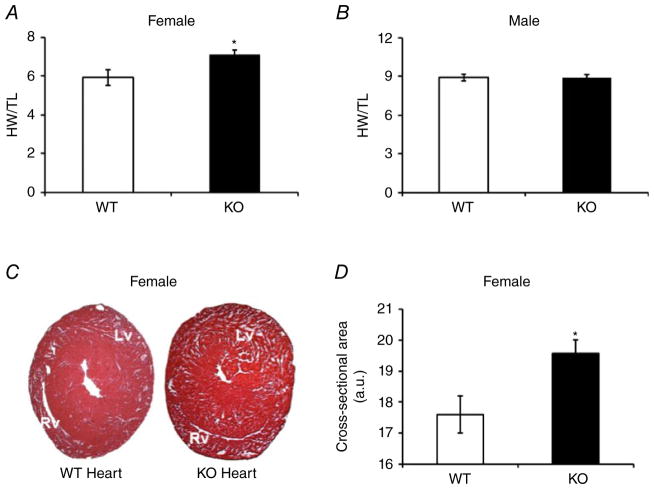
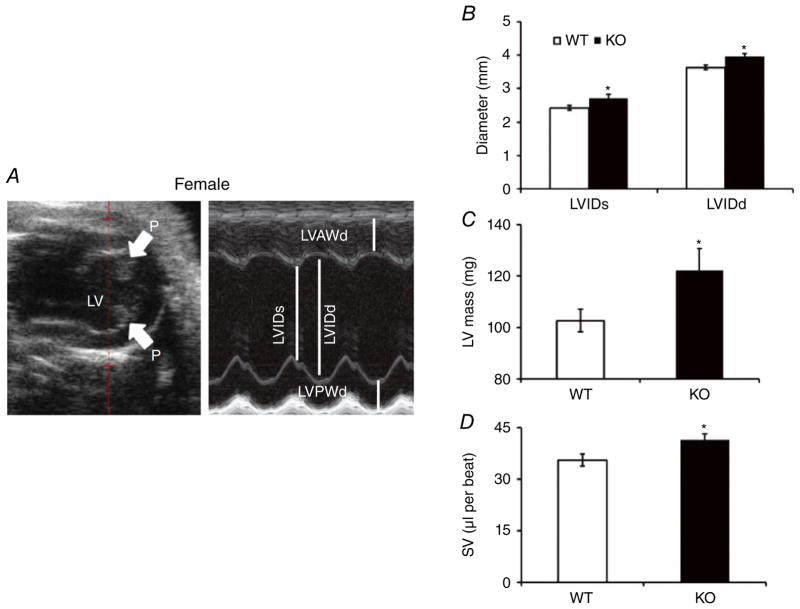
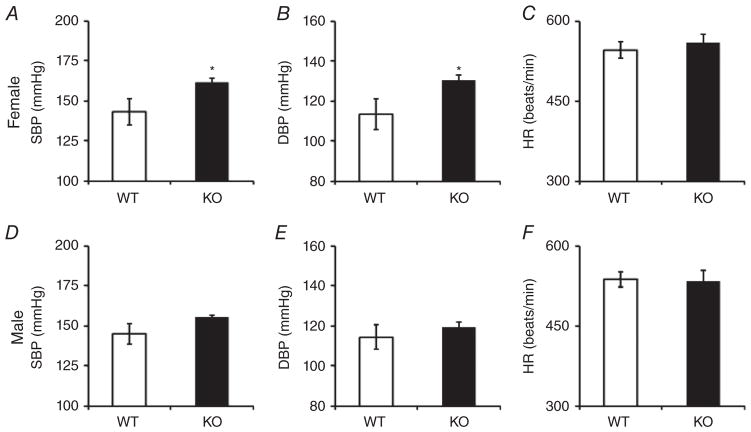
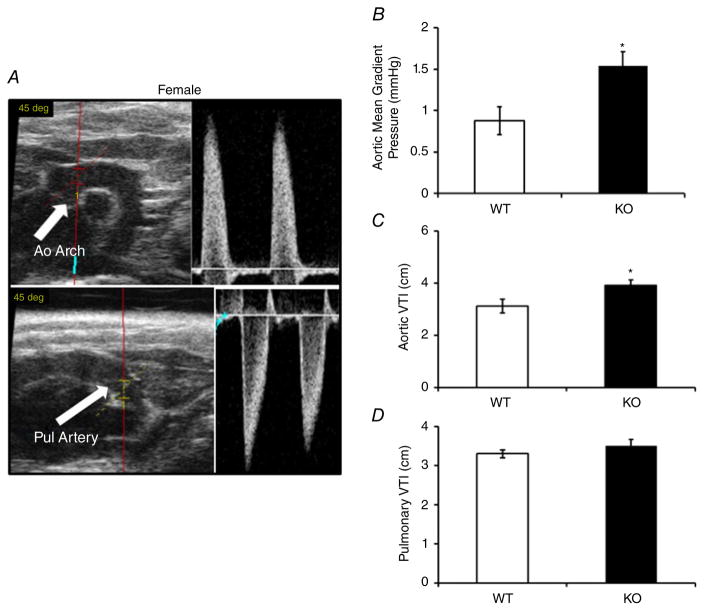
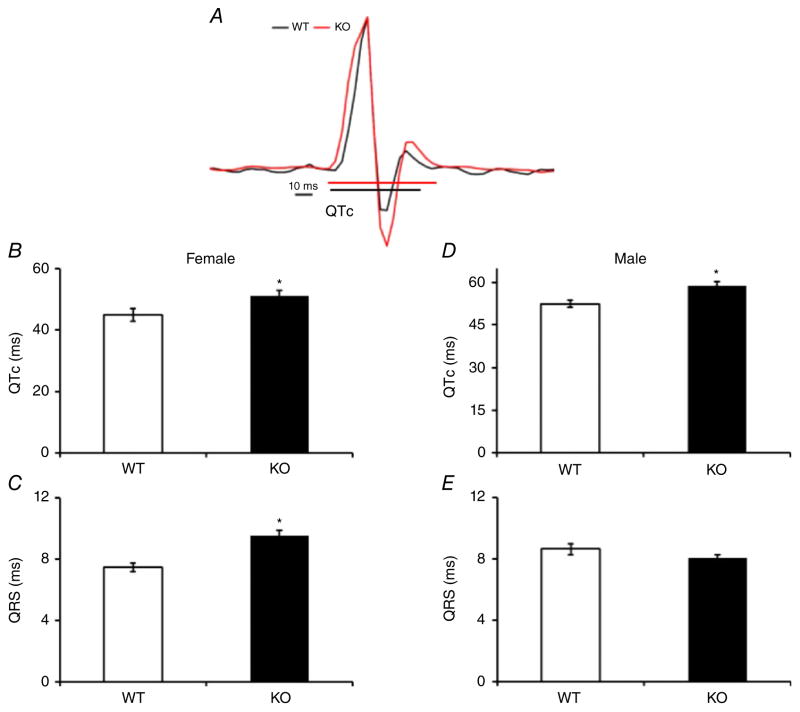
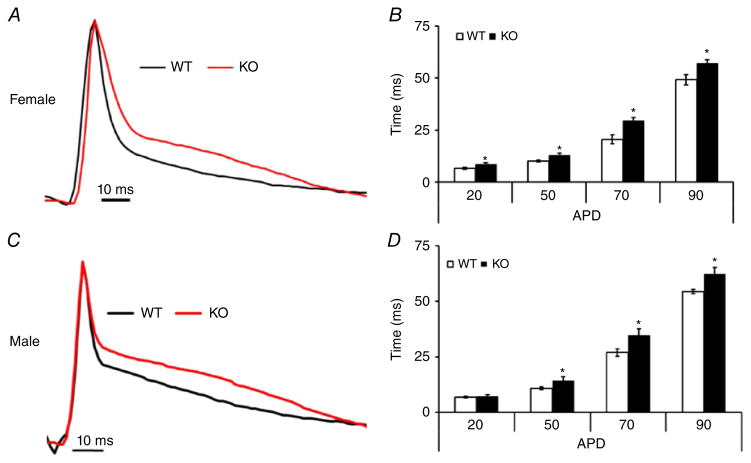
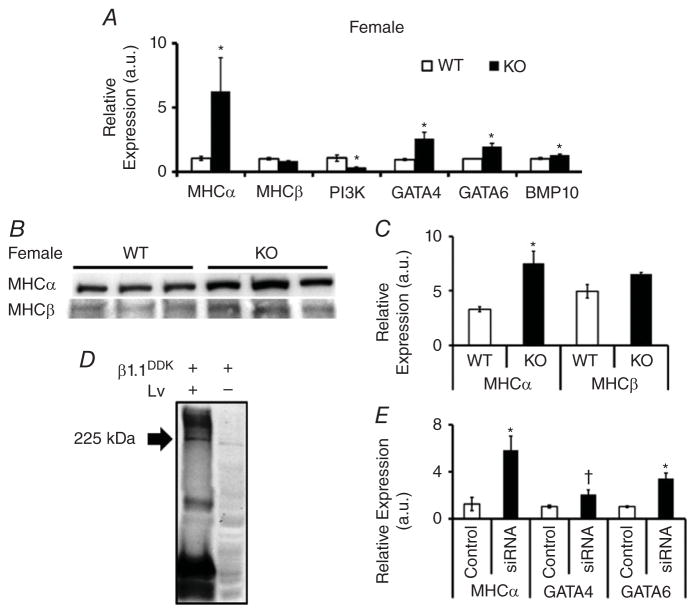
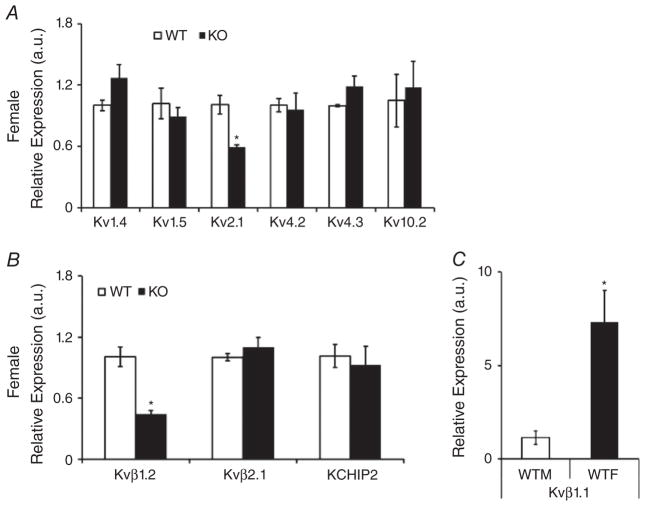
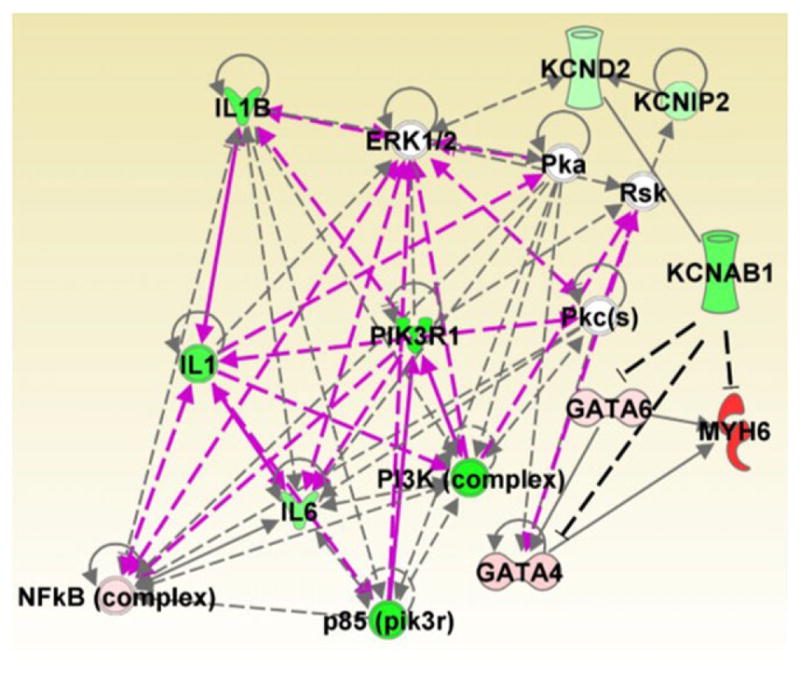
What is the central question of this study? The goal of this study was to evaluate sex differences and the role of the potassium channel β1 (Kvβ1) subunit in the heart. What is the main finding and its importance? Genetic ablation of Kvβ1.1 in females led to cardiac hypertrophy characterized by increased heart size, prolonged monophasic action potentials, elevated blood pressure and increased myosin heavy chain α (MHCα) expression. In contrast, male mice showed only electrical changes. Kvβ1.1 binds the MHCα isoform at the protein level, and small interfering RNA targeted knockdown of Kvβ1.1 upregulated MHCα. Cardiovascular disease is the leading cause of death and debility in women in the USA, and cardiac arrhythmias are a major concern. Voltage-gated potassium (Kv) channels along with the binding partners; Kvβ subunits are major regulators of the action potential (AP) shape and duration (APD). The regulation of Kv channels by the Kvβ1 subunit is unknown in female hearts. In the present study, we hypothesized that the Kvβ1 subunit is an important regulator of female cardiac physiology. To test this hypothesis, we ablated (knocked out; KO) the KCNAB1 isoform 1 (Kvβ1.1) subunit in mice and evaluated cardiac function and electrical activity by using ECG, monophasic action potential recordings and echocardiography. Our results showed that the female Kvβ1.1 KO mice developed cardiac hypertrophy, and the hearts were structurally different, with enlargement and increased area. The electrical derangements caused by Kvβ1.1 KO in female mice included long QTc and QRS intervals along with increased APD (APD20-90% repolarization). The male Kvβ1.1 KO mice did not develop cardiac hypertrophy, but they showed long QTc and prolonged APD. Molecular analysis showed that several genes that support cardiac hypertrophy were significantly altered in Kvβ1.1 KO female hearts. In particular, myosin heavy chain α expression was significantly elevated in Kvβ1.1 KO mouse heart. Using a small interfering RNA strategy, we identified that knockdown of Kvβ1 increases myosin heavy chain α expression in H9C2 cells. Collectively, changes in molecular and cell signalling pathways clearly point towards a distinct electrical and structural remodelling consistent with cardiac hypertrophy in the Kvβ1.1 KO female mice.
© 2016 The Authors. Experimental Physiology © 2016 The Physiological Society.
Conflict of interest statement
None declared.
Figures
Similar articles
-
Corticosteroids and aldose reductase inhibitor Epalrestat modulates cardiac action potential via Kvβ1.1 (AKR6A8) subunit of voltage-gated potassium channel.Mol Cell Biochem. 2017 Dec;436(1-2):71-78. doi: 10.1007/s11010-017-3079-9. Epub 2017 Jun 5. Mol Cell Biochem. 2017. PMID: 28585087 Free PMC article.
-
Kvβ1.1 (AKR6A8) senses pyridine nucleotide changes in the mouse heart and modulates cardiac electrical activity.Am J Physiol Heart Circ Physiol. 2017 Mar 1;312(3):H571-H583. doi: 10.1152/ajpheart.00281.2016. Epub 2016 Dec 16. Am J Physiol Heart Circ Physiol. 2017. PMID: 27986658 Free PMC article.
-
Accessory Kvbeta1 subunits differentially modulate the functional expression of voltage-gated K+ channels in mouse ventricular myocytes.Circ Res. 2005 Mar 4;96(4):451-8. doi: 10.1161/01.RES.0000156890.25876.63. Epub 2005 Jan 20. Circ Res. 2005. PMID: 15662035
-
Role of voltage-gated potassium channel α subunits in cardiovascular system.Sheng Li Xue Bao. 2024 Oct 25;76(5):761-774. Sheng Li Xue Bao. 2024. PMID: 39468812 Review.
-
Structure and function of cardiac potassium channels.Cardiovasc Res. 1999 May;42(2):377-90. doi: 10.1016/s0008-6363(99)00071-1. Cardiovasc Res. 1999. PMID: 10533574 Review.
Cited by
-
Physiological role of Kvβ2 (AKR6) in murine skeletal muscle growth and regulation.Acta Physiol (Oxf). 2018 Oct;224(2):e13083. doi: 10.1111/apha.13083. Epub 2018 Jun 6. Acta Physiol (Oxf). 2018. PMID: 29704886 Free PMC article.
-
Corticosteroids and aldose reductase inhibitor Epalrestat modulates cardiac action potential via Kvβ1.1 (AKR6A8) subunit of voltage-gated potassium channel.Mol Cell Biochem. 2017 Dec;436(1-2):71-78. doi: 10.1007/s11010-017-3079-9. Epub 2017 Jun 5. Mol Cell Biochem. 2017. PMID: 28585087 Free PMC article.
-
Transmural gradients in ion channel and auxiliary subunit expression.Prog Biophys Mol Biol. 2016 Dec;122(3):165-186. doi: 10.1016/j.pbiomolbio.2016.09.012. Epub 2016 Oct 1. Prog Biophys Mol Biol. 2016. PMID: 27702655 Free PMC article. Review.
-
Metabolic regulation of Kv channels and cardiac repolarization by Kvβ2 subunits.J Mol Cell Cardiol. 2019 Dec;137:93-106. doi: 10.1016/j.yjmcc.2019.09.013. Epub 2019 Oct 19. J Mol Cell Cardiol. 2019. PMID: 31639389 Free PMC article.
-
Emerging potential benefits of modulating NAD+ metabolism in cardiovascular disease.Am J Physiol Heart Circ Physiol. 2018 Apr 1;314(4):H839-H852. doi: 10.1152/ajpheart.00409.2017. Epub 2017 Dec 22. Am J Physiol Heart Circ Physiol. 2018. PMID: 29351465 Free PMC article. Review.
References
-
- Aimond F, Kwak SP, Rhodes KJ, Nerbonne JM. Accessory Kvβ1 subunits differentially modulate the functional expression of voltage-gated K+ channels in mouse ventricular myocytes. Circ Res. 2005;96:451–458. - PubMed
-
- Banerjee B, Peiris DN, Koo SH, Chui P, Lee EJ, Hande MP. Genomic imbalances in key ion channel genes and telomere shortening in sudden cardiac death victims. Cytogenet Genome Res. 2008;122:350–355. - PubMed
-
- Benjamin EJ, Levy D, Vaziri SM, D’Agostino RB, Belanger AJ, Wolf PA. Independent risk factors for atrial fibrillation in a population-based cohort. The Framingham Heart Study. JAMA. 1994;271:840–844. - PubMed
-
- Berul CI, Aronovitz MJ, Wang PJ, Mendelsohn ME. In vivo cardiac electrophysiology studies in the mouse. Circulation. 1996;94:2641–2648. - PubMed
Publication types
MeSH terms
Substances
Grants and funding
LinkOut - more resources
Full Text Sources
Other Literature Sources
Research Materials