. 2016 Jun;10(6):895-909.
doi: 10.1016/j.molonc.2016.03.001. Epub 2016 Mar 22.

IL-8 induces miR-424-5p expression and modulates SOCS2/STAT5 signaling pathway in oral squamous cell carcinoma

Affiliations

IL-8 induces miR-424-5p expression and modulates SOCS2/STAT5 signaling pathway in oral squamous cell carcinoma

Hsuan-Yu Peng et al. Mol Oncol. 2016 Jun.

Abstract

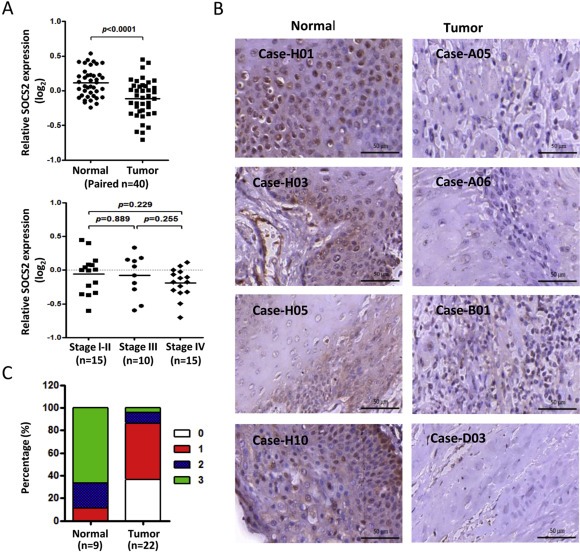
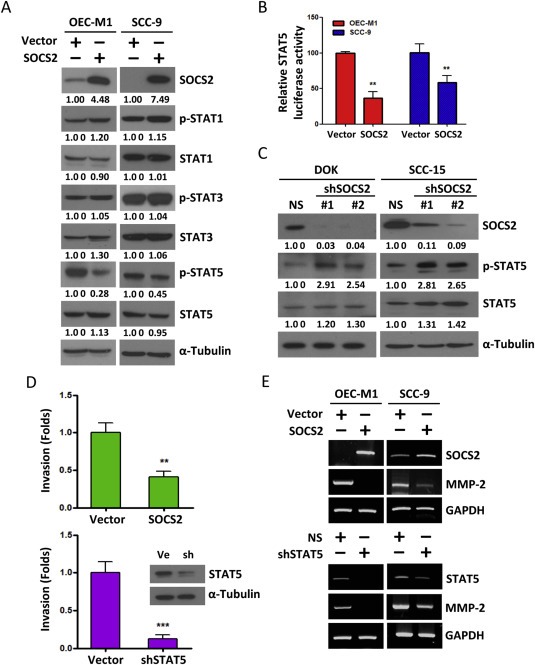
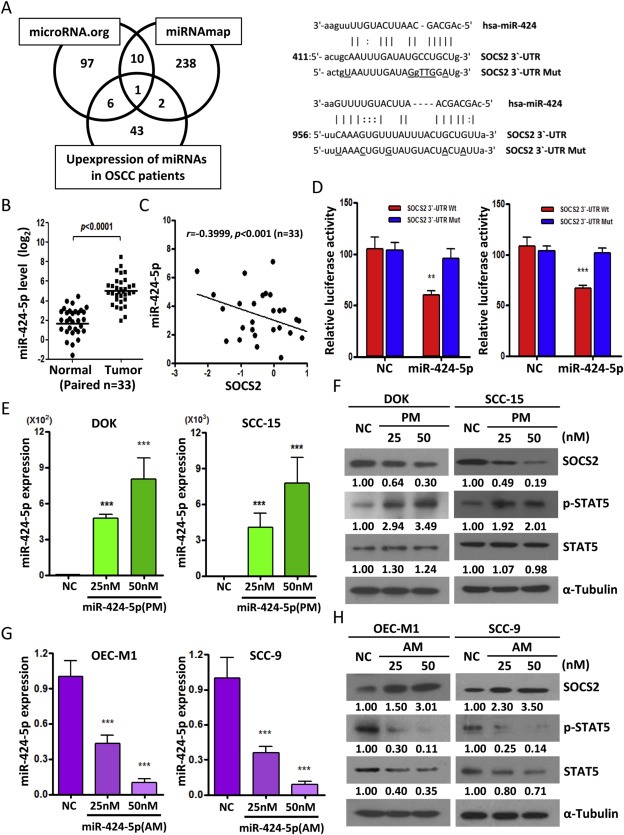
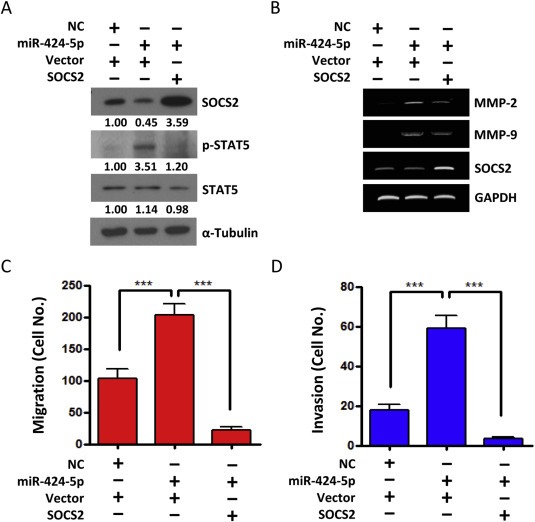
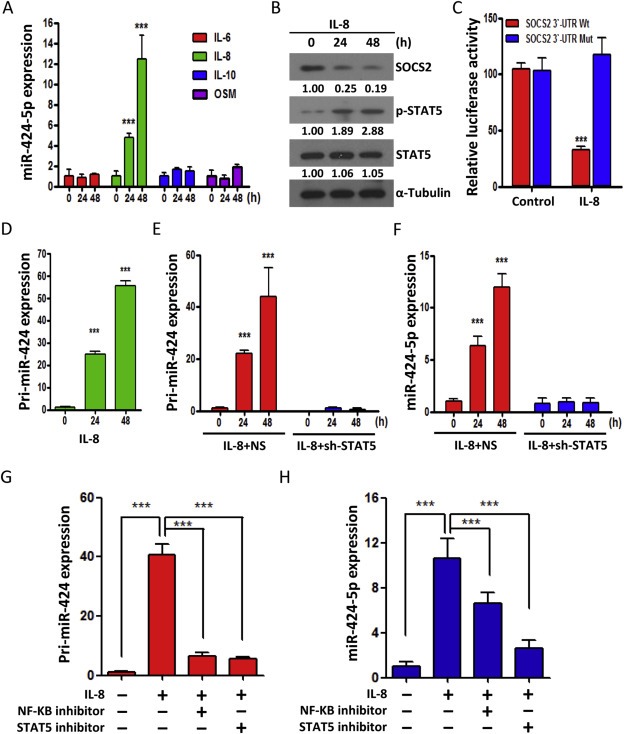
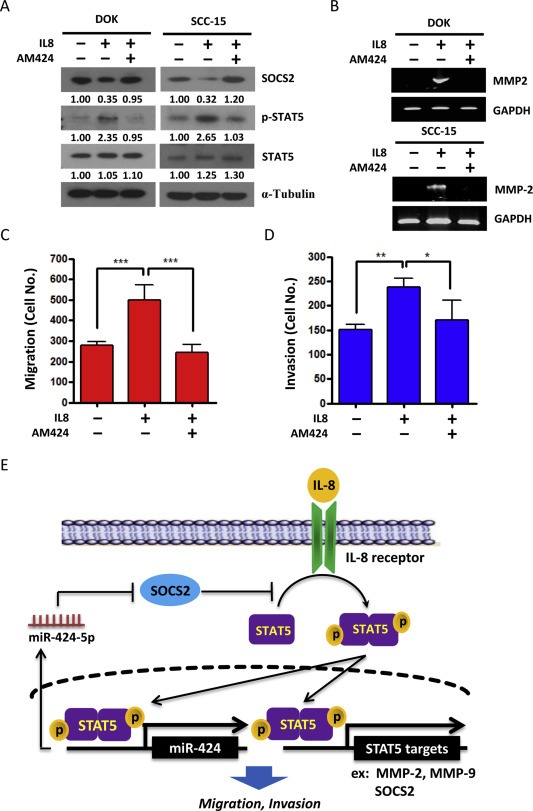
Suppressor of cytokine signaling (SOCS) proteins are negative feedback regulators of the Janus kinase/signal transducer and activator of transcription (JAK/STAT) pathway. Dysregulation of SOCS protein expression in cancers can be one of the mechanisms that maintain STAT activation, but this mechanism is still poorly understood in oral squamous cell carcinoma (OSCC). Here, we report that SOCS2 protein is significantly downregulated in OSCC patients and its levels are inversely correlated with miR-424-5p expression. We identified the SOCS2 protein, which modulates STAT5 activity, as a direct target of miR-424-5p. The miR-424-5p-induced STAT5 phosphorylation, matrix metalloproteinases (MMPs) expression, and cell migration and invasion were blocked by SOCS2 restoration, suggesting that miR-424-5p exhibits its oncogenic activity through negatively regulating SOCS2 levels. Furthermore, miR-424-5p expression could be induced by the cytokine IL-8 primarily through enhancing STAT5 transcriptional activity rather than NF-κB signaling. Antagomir-mediated inactivation of miR-424-5p prevented the IL-8-induced cell migration and invasion, indicating that miR-424-5p is required for IL-8-induced cellular invasiveness. Taken together, these data indicate that STAT5-dependent expression of miR-424-5p plays an important role in mediating IL-8/STAT5/SOCS2 feedback loop, and scavenging miR-424-5p function using antagomir may have therapeutic potential for the treatment of OSCC.

Keywords: IL-8; Invasion; Oral squamous cell carcinoma; SOCS2; microRNA.


Figures

Figure 1
Figure 1
The aberrant expression of SOCS2 in OSCC. A: Microarray analysis of SOCS2 expression level in OSCC tumors (n = 40) compared with their own adjacent normal tissues or compared with patients' stage (one‐way ANOVA, p = 0.3779). SOCS2 expression levels are expressed as the log2 ratios. B: Immunohistochemical analysis of SOCS2 in oral cancer tissue microarray. Bars in the right lower corners of all photos are equivalent to 50 μm. C: Bar charts show the percentage of SOCS2 staining score for the oral specimens in the tissue microarray, including 9 cases of normal tissue and 22 cases of OSCC. The SOCS2 staining intensity was scored as follows: 0 = negative, 1 = mild, 2 = moderate and 3 = intense.
Figure 2
Figure 2
The effects of dysregulated SOCS2 in STAT5 activity and invasion ability. A: Western blot analysis of the STAT1, 3, 5 and their phosphorylation form after transfection of SOCS2 for 48 h in OEC‐M1 and SCC‐9 cells. α‐Tubulin was used as protein loading control. Numerical values for protein band intensities are shown below the gels. The values were quantitated by densitometry and normalized to α‐tubulin. B: The effect of SOCS2 on the transcriptional activity of the construct (pGL3) containing the STAT5 binding sequence. The relative luciferase activities are the ratios of Renilla luciferase normalized to the control mimics. The data are represented as mean ± SD; **, p < 0.01 versus vector control. C: Whole cell lysates from DOK and SCC‐15 cells transfected with plasmids expressing two target‐specific SOCS2 shRNA (#1 or #2, respectively) or non‐targeting shRNA plasmid (NS) were analyzed for STAT5 and phosphor‐STAT5 protein for 48 h by western blot. α‐Tubulin was used as protein loading control. The numerical values for protein band intensities were corrected with the values for the loading control α‐tubulin bands. D: Relative invasion ability of OEC‐M1 cells transfected with SOCS2 or shSTAT5 plasmids for 24 h. The data are represented as mean ± SE; **, p < 0.01; ***, p < 0.001 versus vector control. Western blot data showed that STAT5 protein level in OEC‐M1 cells after transfecting the shSTAT5 plasmid (sh) or control vector (Ve). E: RT‐PCR analysis of MMP‐2 transcript after transfection of SOCS2 or shSTAT5 plasmids for 48 h in OEC‐M1 and SCC‐9 cells. GAPDH was used as an internal control.
Figure 3
Figure 3
SOCS2 is a direct target of miR‐424‐5p. A: Left, Venn diagram of predicted miRNA which targets SOCS2 3′‐UTR in silico using two independent algorithms (microRNA.org and miRNAmap) combined with our patients' miRNA array data (GSE45238). Right, Schematic representation of the putative miR‐424‐5p binding sequence in the 3′‐UTR of SOCS2 with wild‐type form (SOCS2 3′‐UTR Wt) and mutant form (SOCS2 3′‐UTR Mut). The mutated nucleotides are labeled with underline. B: qRT‐PCR analysis to validate the miR‐424‐5p expression pattern in tumors versus their normal adjacent tissues for another OSCC cohort samples (n = 33). C: Correlation analysis of miR‐424‐5p and SOCS2 in human OSCC patients (n = 33) by qRT‐PCR analysis. D: The effect of miR‐424‐5p mimics (PM, 25 nM) on the luciferase activities of the constructs containing the wild‐type or mutant‐type 3′‐UTR in DOK (left) and SCC‐15 (right) cells. The relative luciferase activity of each sample is measured at 48 h after transfection and normalized to Renilla luciferase activity. E: qRT–PCR analysis showing the expression level of miR‐424‐5p in DOK and SCC‐15 cell lines after transfection with 25 nM or 50 nM of miR‐424‐5p mimics (PM) for 48 h. F: Western blot analysis of the SOCS2, STAT5 and phosphor‐STAT5 after transfection of miR‐424‐5p mimics (PM) with 25 nM or 50 nM for 48 h in DOK and SCC‐15 cells. G: qRT–PCR analysis showing the expression level of miR‐424‐5p in OEC‐M1 and SCC‐9 cells after transfection with indicated concentration of miR‐424‐5p inhibitors (AM) for 48 h. H: Western blot analysis of the SOCS2, STAT5 and phosphor‐STAT5 after transfection of miR‐424‐5p inhibitors (AM) with indicated concentration for 48 h OEC‐M1 and SCC‐9 cells. All data are presented as mean ± SE; **, p < 0.01; ***, p < 0.001 versus scramble control (NC). α‐Tubulin was used as protein loading control. Numerical values for protein band intensities are shown below the gels. The values were quantitated by densitometry and normalized to α‐tubulin.
Figure 4
Figure 4
miR‐424‐5p promotes invasion and migration through SOCS2. SCC‐15 cells were transfected with miR‐424‐5p mimics or scramble control (NC) for 24 h and then transfected with SOCS2 expression vector (without 3′‐UTR) or control vector for another 24 h. A: Western blot analysis of the SOCS2, STAT5 and phosphor‐STAT5. α‐Tubulin was used as protein loading control. Numerical values for protein band intensities are shown below the gels. The values were quantitated by densitometry and normalized to α‐tubulin. B: RT‐PCR analysis of SOCS2, MMP‐2 and MMP‐9. GAPDH was used as an internal control. C: Migration assay and D: Invasion assay using Boyden Chamber system. All data are presented as mean ± SE; ***, p < 0.001, one‐way ANOVA p < 0.0001.
Figure 5
Figure 5
miR‐424‐5p disrupts IL‐8/STAT5/SOCS2 feedback loop. A: qRT–PCR analysis showing the expression level of miR‐424‐5p in SCC‐15 cells treated with various cytokines, including IL‐6, IL‐8, IL‐10 and OSM (each for 10 ng/ml) for indicated time periods. B: Western blot analysis of the SOCS2, STAT5 and phosphor‐STAT5 in SCC‐15 cells after addition of IL‐8 (10 ng/ml) for 24 and 48 h. The numerical values for protein band intensities were corrected with the values for the loading control α‐Tubulin bands. C: The effect of IL‐8 (10 ng/ml) on the luciferase activities of the constructs containing the wild‐type or mutant‐type SOCS2 3′‐UTR in SCC‐15 cells. The relative luciferase activity of each sample is measured at 48 h after transfection and normalized to Renilla luciferase activity. D: qRT–PCR analysis of primary miR‐424 (pri‐miR‐424) expression in SCC‐15 cells treated with IL‐8 (10 ng/ml). E–F: qRT–PCR analysis of primary miR‐424 (pri‐miR‐424) (E) and mature miR‐424 (miR‐424‐5p) (F) in SCC‐15 cells transfected with control (NS) or STAT5 shRNAs for 24 h and subsequently treated with IL‐8 for 24 or 48 h. G–H: qRT–PCR analysis of primary miR‐424 (pri‐miR‐424) (G) and mature miR‐424 (miR‐424‐5p) (H) in SCC‐15 cells treated with NF‐kB inhibitor or STAT inhibitor for 16 h and subsequently treated with IL‐8 (10 ng/ml) for 48 h. All data are presented as mean ± SE; ***, p < 0.001, one‐way ANOVA p < 0.0001.
Figure 6
Figure 6
IL‐8 induces invasion and migration of OSCC cells through induction of miR‐424‐5p. DOK and SCC‐15 cells were transfected with miR‐424‐5p specific inhibitors (AM424) for 24 h, followed by addition of IL‐8 (10 ng/ml) for 48 h. A: Western blot analysis of the SOCS2, STAT5 and phosphor‐STAT5. α‐Tubulin was used as protein loading control. The numerical values for protein band intensities were corrected with the values for the loading control α‐tubulin bands. B: RT‐PCR analysis of MMP‐2 expression. GAPDH was used as an internal control. C: Migration assay using Boyden Chamber system. The data are represented as mean ± SE; ***, p < 0.001 versus vector control, one‐way ANOVA p = 0.0067. D: Invasion assay using Boyden Chamber system. The data are presented as mean ± SE; *, p < 0.05; **, p < 0.01; one‐way ANOVA p = 0.0022. E: Schematic representation of the proposed hypothesis that miR‐424‐5p disrupts IL‐8/STAT5/SOCS2 feedback loop in OSCC model.

Similar articles

Cited by

References

    1. Agrawal, N. , Frederick, M.J. , Pickering, C.R. , Bettegowda, C. , Chang, K. , Li, R.J. , Fakhry, C. , Xie, T.X. , Zhang, J. , Wang, J. , Zhang, N. , El-Naggar, A.K. , Jasser, S.A. , Weinstein, J.N. , Trevino, L. , Drummond, J.A. , Muzny, D.M. , Wu, Y. , Wood, L.D. , Hruban, R.H. , Westra, W.H. , Koch, W.M. , Califano, J.A. , Gibbs, R.A. , Sidransky, D. , Vogelstein, B. , Velculescu, V.E. , Papadopoulos, N. , Wheeler, D.A. , Kinzler, K.W. , Myers, J.N. , 2011. Exome sequencing of head and neck squamous cell carcinoma reveals inactivating mutations in NOTCH1. Science. 333, 1154–1157. - PMC - PubMed
    1. Ahomadegbe, J.C. , Barrois, M. , Fogel, S. , Le Bihan, M.L. , Douc-Rasy, S. , Duvillard, P. , Armand, J.P. , Riou, G. , 1995. High incidence of p53 alterations (mutation, deletion, overexpression) in head and neck primary tumors and metastases; absence of correlation with clinical outcome. Frequent protein overexpression in normal epithelium and in early non-invasive lesions. Oncogene. 10, 1217–1227. - PubMed
    1. Benekli, M. , Baer, M.R. , Baumann, H. , Wetzler, M. , 2003. Signal transducer and activator of transcription proteins in leukemias. Blood. 101, 2940–2954. - PubMed
    1. Britschgi, A. , Andraos, R. , Brinkhaus, H. , Klebba, I. , Romanet, V. , Muller, U. , Murakami, M. , Radimerski, T. , Bentires-Alj, M. , 2012. JAK2/STAT5 inhibition circumvents resistance to PI3K/mTOR blockade: a rationale for cotargeting these pathways in metastatic breast cancer. Cancer cell. 22, 796–811. - PubMed
    1. Calin, G.A. , Croce, C.M. , 2006. MicroRNA-cancer connection: the beginning of a new tale. Cancer Res. 66, 7390–7394. - PubMed

Publication types

MeSH terms