. 2016 Jun:166:169-180.
doi: 10.1016/j.ajo.2016.03.030. Epub 2016 Mar 30.

Outer Retinal Structural Alternation and Segmentation Errors in Optical Coherence Tomography Imaging in Patients With a History of Retinopathy of Prematurity

Affiliations

Outer Retinal Structural Alternation and Segmentation Errors in Optical Coherence Tomography Imaging in Patients With a History of Retinopathy of Prematurity

Yi-Hsing Chen et al. Am J Ophthalmol. 2016 Jun.

Abstract

Purpose: To evaluate retinal anatomy and segmentation errors from spectral-domain optical coherence tomography (SD-OCT) imaging in school-aged children.

Design: A prospective cohort study in a referral medical center.

Methods: One hundred thirty-three eyes of 133 patients were enrolled. Patients were grouped as those who were treated for retinopathy of prematurity (ROP) (ROP-Tx group); those with spontaneously regressed ROP (ROP-non-Tx group); other premature patients (premature group); and full-term age-matched children (full-term group). Anatomy and segmentation errors of retina were evaluated by SD-OCT.

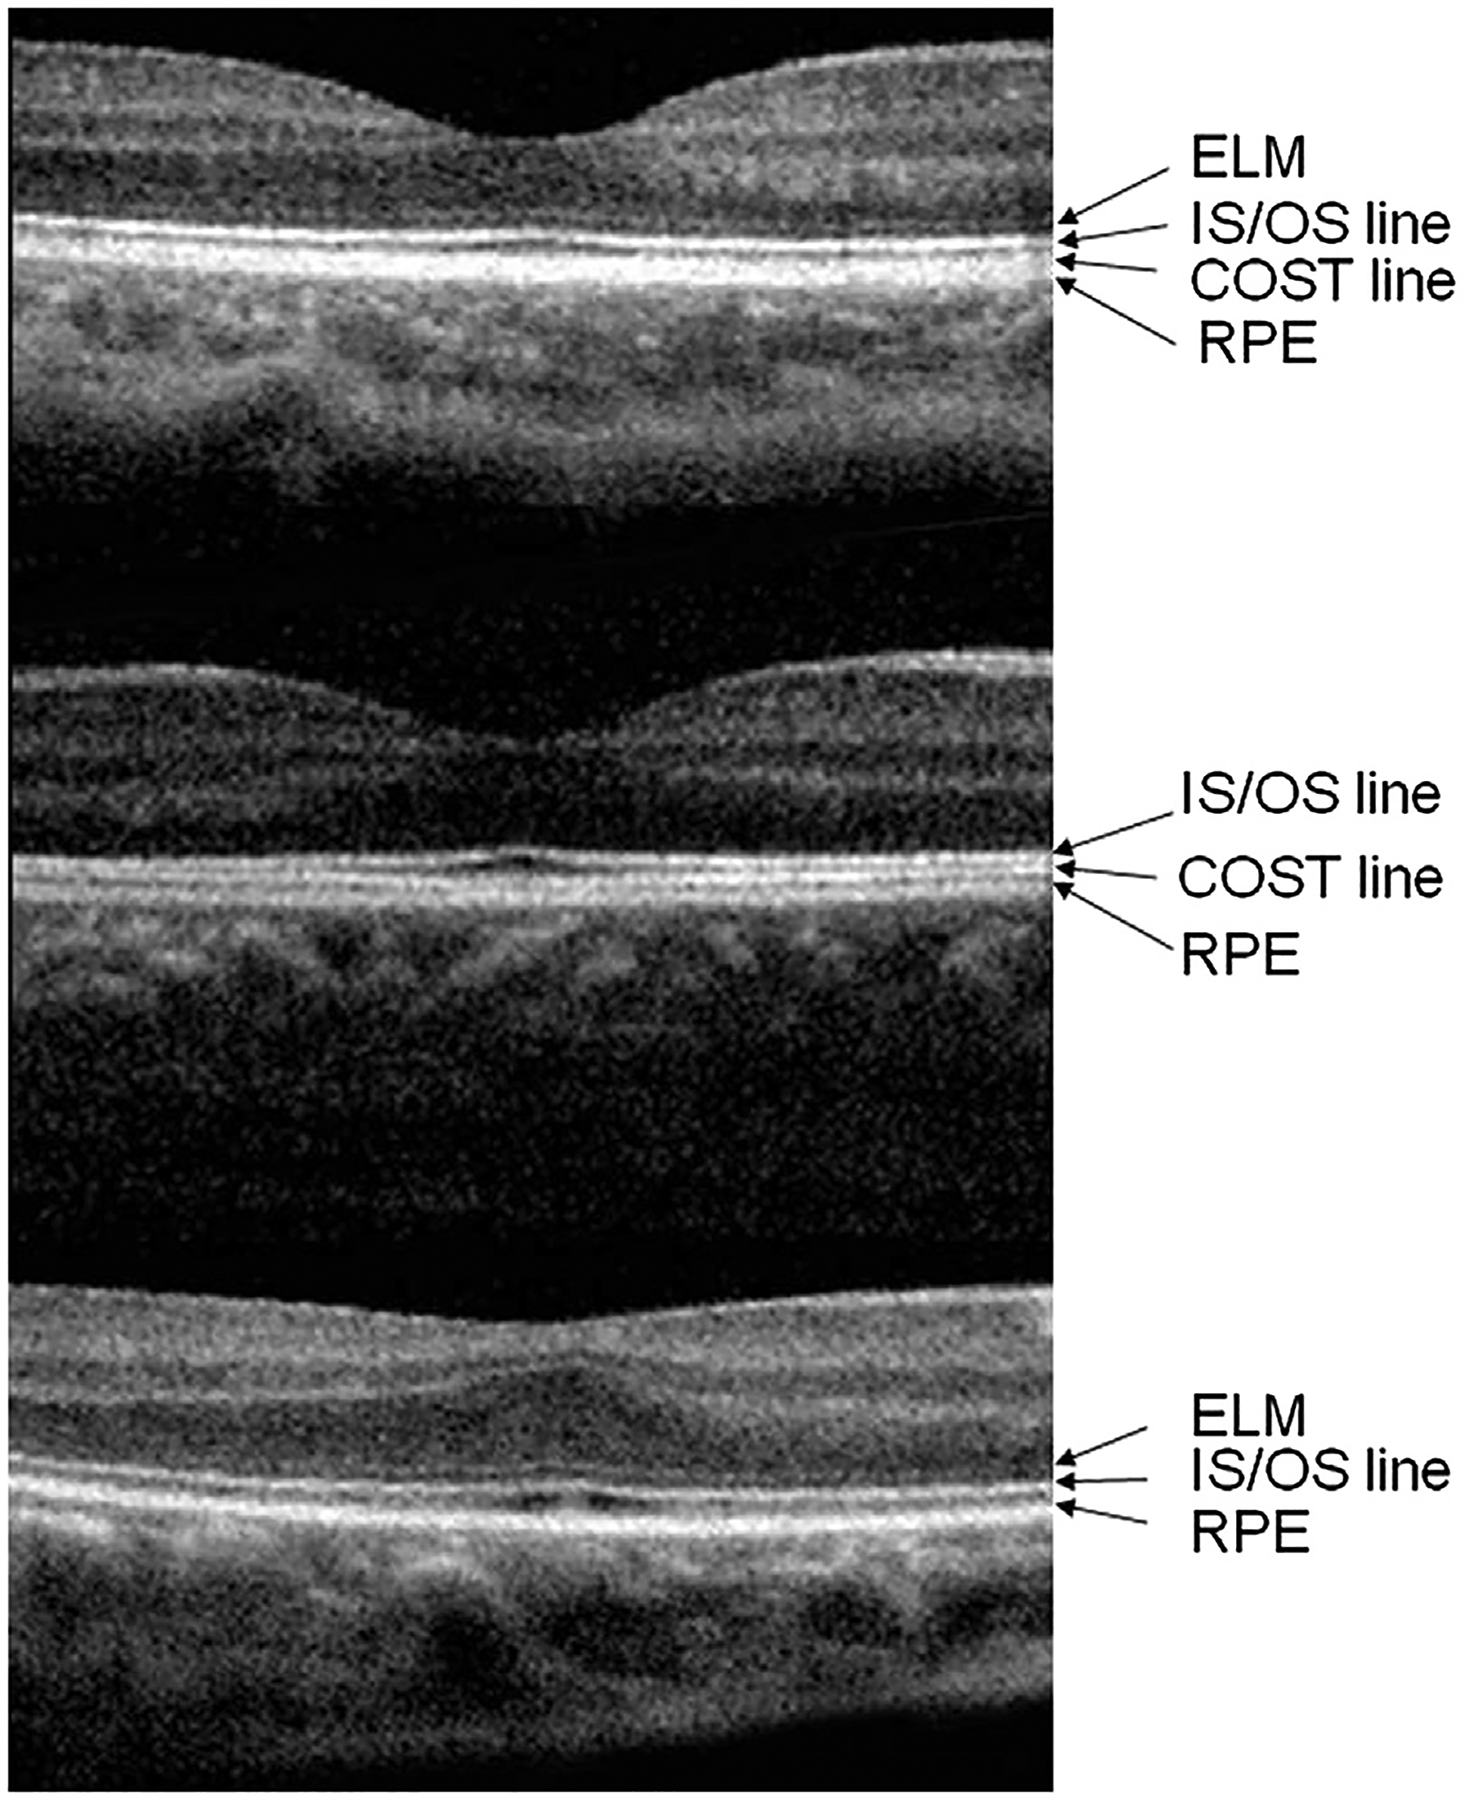
Results: The mean age at assessment was 9.5 years (range, 4-16 years). The external limiting membrane (ELM) and the cone outer segment tips (COST) line were least frequently identified in patients of the ROP-Tx group (65.2% and 47.8%, P = .002 and P < .001, respectively). The visual acuity of the patients did not correlate significantly with the absence of COST line (P = .140) but correlated with the absence of ELM (P < .001). The presence of artifacts, including misidentification of the inner retina, misidentification of the outer retina, out-of-register artifacts, off-center scans, and degraded scan images, was observed to range from 0.6% to 50.0% in 4 groups of patients. All types of errors occurred more frequently in the ROP-Tx group than in the full-term group (all P < .05).

Conclusions: Outer retinal abnormalities were commonly observed in the ROP-Tx group. The higher segmentation errors in the ROP-Tx group might be related to fine structural abnormalities in the outer retina. Future studies are needed to investigate the mechanisms for these structural changes.


Figures

FIGURE 1.
FIGURE 1.
Example RTVue-100 spectral-domain optical coherence tomography (OCT) volume scan output display. (Top) Cross-line image of the fovea of a normal eye. The RTvue-100 OCT identified the inner retinal boundary that corresponds to the internal limiting membrane (yellow arrows) and identified the outer retinal boundary at the external limit of the retinal pigment epithelium (white arrows). (Bottom left) Corresponding thickness measurements and thickness map as defined by the Early Treatment Diabetic Retinopathy Study. (Bottom right) Fundus image showed scanned area of the entire volume scan and location of the cross-line output.
FIGURE 2.
FIGURE 2.
Example of the missing external limiting membrane (ELM) or cone outer segment tips (COST) line in retinopathy of prematurity (ROP) patients. (Top) The patient, from the full-term group, was born at gestational age (GA) 39 weeks and the birthweight (BW) was 3120 g. The spectral-domain optical coherence tomography (SD-OCT) demonstrated a clearly observable ELM, inner segment and outer segment (IS/OS) line, COST line, and retinal pigment epithelium (RPE). The signal strength index (SSI) was 67.5. (Middle) The patient, from the ROP-Tx group, was born at GA 25 weeks and the BW was 560 g. She developed threshold ROP and received cryotherapy. The RTVue-100 SDOCT demonstrated a clearly observable IS/OS line, COST line, and RPE. The ELM layer was not clearly identified. The SSI was 57.8. (Bottom) The patient was born at GA 26 weeks and the BW was 846 g. He developed stage 3 ROP over zone II and received laser treatment (ROP-Tx group patient). The RTVue-100 SD-OCT demonstrated clearly observed ELM, IS/OS line, and RPE. However, the COST line was not clearly observed. The SSI was 59.6.
FIGURE 3.
FIGURE 3.
Examples of the “inner retina misidentification” and “outer retina misidentification” by RTVue-100 spectral-domain optical coherence tomography (SDOCT). The patient was born at gestational age 28 weeks, and the birthweight was 960 g. The patient had previously threshold retinopathy of prematurity (ROP) in both eyes and had laser treatment. The examination was performed at 11 years old. The best-corrected vision was 20/800 and the spherical equivalent was −11.75 diopters in the right eye. The signal strength index was 52.4. (Top) This is a cross-sectional, center vertical scan image. The inner retina was misidentified as the yellow arrows. The true inner retina was at the white arrows. The outer retina was misidentified as the red arrows. (Bottom left) Corresponding central 1-mm subfield retinal thickness was inaccurately measured as 170 μm, as shown in the Early Treatment Diabetic Retinopathy Study subfields. (Bottom right) Fundus photography showed a normal-appearing disc, with tessellated fundus appearance.
FIGURE 4.
FIGURE 4.
Examples of “out-of-register” artifact by RTVue-100 spectral-domain optical coherence tomography. The patient was born at gestational age 39 weeks and the birthweight was 3300 g. The signal strength index was 69.9. The examination was conducted at 8 years of age. The best-corrected visual acuity was 20/25 in the right eye and the spherical equivalent was +0.25 diopter. (Top) A cross-sectional, center horizontal scan image. The image was “out of register” owing to a superior shifted scan and the inner retina was misidentified (yellow arrows). The true inner retina was identified as the white arrows. (Bottom left) Corresponding central 1-mm subfield retinal thickness was measured as 155 μm, as shown in the ETDRS subfields. (Bottom right) The fundus was normal in appearance.
FIGURE 5.
FIGURE 5.
Example “off-center” scans from RTVue-100 spectral-domain optical coherence tomography. The patient was born at gestational age 35 weeks and the birthweight was 2930 g. The signal strength index was 69.2. The patient did not develop retinopathy of prematurity. The examination was conducted at 8 years of age. The best-corrected vision was 20/25 in the right eye and the spherical equivalent was −4.25 diopters. (Top) The cross-sectional, center horizontal scan image showed an off-center fovea depression. (Bottom left) Retinal thickness map from RTVue-100 volume scan with centration error. Note how the blue foveal pit (white arrow) is not located at the center of the scan (intersection of the white horizontal and vertical lines). (Bottom right) The fundus photography of the patient was normal.
FIGURE 6.
FIGURE 6.
Example “degraded artifact” from RTVue-100 spectral-domain optical coherence tomography (OCT). The patient was born at gestational age 26 weeks and the birthweight was 1214 g. The signal strength index was 69.9. The patient developed threshold retinopathy of prematurity and received cryotherapy. The examination was conducted at 13 years of age. The best-corrected vision was 20/25 in the right eye and the spherical equivalent was −3.75 diopters. (Top) The cross-sectional OCT scan showed a degraded image. Retinal details are not visible. The degraded image makes it impossible for the computer software to identify the inner retina. (Bottom left) The calculated central retinal thickness measurement was inaccurate (293 μm). (Bottom right) The fundus photography demonstrated a normal disc and macula. However, on clinical examination, the patient had multiple scars from cryotherapy at the peripheral retina.

Similar articles

Cited by

References

    1. Browning DJ, McOwen MD, Bowen RM Jr, O’Marah TL. Comparison of the clinical diagnosis of diabetic macular edema with diagnosis by optical coherence tomography. Ophthalmology 2004;111(4):712–715. - PubMed
    1. Apushkin MA, Fishman GA, Janowicz MJ. Monitoring cystoid macular edema by optical coherence tomography in patients with retinitis pigmentosa. Ophthalmology 2004;111(10):1899–1904. - PubMed
    1. Chen TC, Cense B, Pierce MC, et al. Spectral domain optical coherence tomography: ultra-high speed, ultra-high resolution ophthalmic imaging. Arch Ophthalmol 2005;123(12):1715–1720. - PubMed
    1. Gabriele ML, Ishikawa H, Wollstein G, et al. Peripapillary nerve fiber layer thickness profile determined with high speed, ultrahigh resolution optical coherence tomography high-density scanning. Invest Ophthalmol Vis Sci 2007;48(7):3154–3160. - PMC - PubMed
    1. Sadda SR, Wu Z, Walsh AC, et al. Errors in retinal thickness measurements obtained by optical coherence tomography. Ophthalmology 2006;113(2):285–293. - PubMed

Publication types

LinkOut - more resources