. 2016 Apr 2:17:151.
doi: 10.1186/s12859-016-0999-4.

Reproducibility of Illumina platform deep sequencing errors allows accurate determination of DNA barcodes in cells

Affiliations

Reproducibility of Illumina platform deep sequencing errors allows accurate determination of DNA barcodes in cells

Joost B Beltman et al. BMC Bioinformatics. .

Abstract

Background: Next generation sequencing (NGS) of amplified DNA is a powerful tool to describe genetic heterogeneity within cell populations that can both be used to investigate the clonal structure of cell populations and to perform genetic lineage tracing. For applications in which both abundant and rare sequences are biologically relevant, the relatively high error rate of NGS techniques complicates data analysis, as it is difficult to distinguish rare true sequences from spurious sequences that are generated by PCR or sequencing errors. This issue, for instance, applies to cellular barcoding strategies that aim to follow the amount and type of offspring of single cells, by supplying these with unique heritable DNA tags.

Results: Here, we use genetic barcoding data from the Illumina HiSeq platform to show that straightforward read threshold-based filtering of data is typically insufficient to filter out spurious barcodes. Importantly, we demonstrate that specific sequencing errors occur at an approximately constant rate across different samples that are sequenced in parallel. We exploit this observation by developing a novel approach to filter out spurious sequences.

Conclusions: Application of our new method demonstrates its value in the identification of true sequences amongst spurious sequences in biological data sets.

Keywords: Cellular barcoding; Illumina; Lineage tracing; Next generation sequencing; PCR error; Sequencing error.


Figures
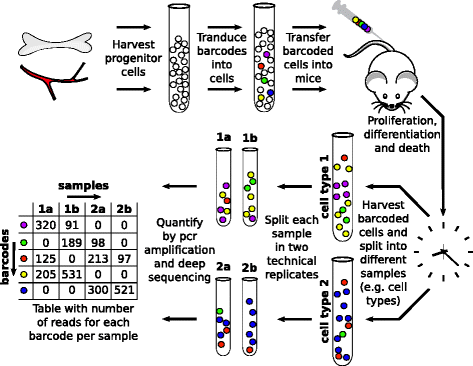
Fig. 1
Fig. 1
Overview of experimental barcoding technology and barcode quantification. In brief, progenitor cells isolated from organs (e.g. bone marrow) are labeled with unique, heritable barcodes (represented by differently coloured cells). Barcoded cells are injected into animals, after which cellular proliferation, differentiation and death occurs. Different cell types are then harvested, DNA is extracted, and the resulting samples are split into technical replicates. These undergo PCR amplification and deep sequencing, resulting in a table with the number of reads for each barcode in each sample
Fig. 2
Fig. 2
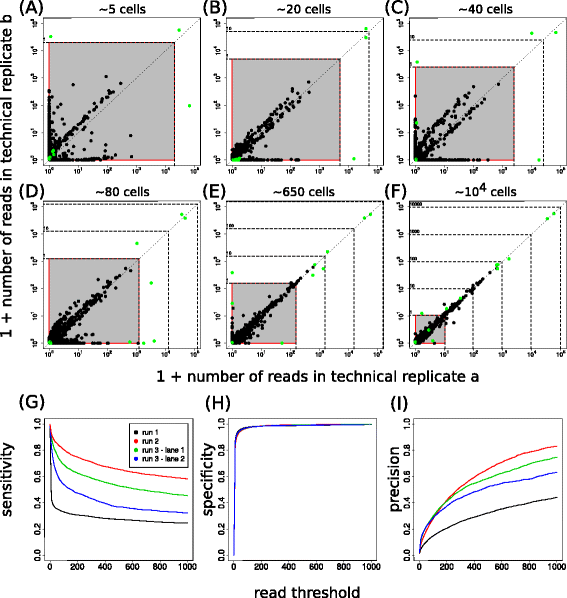
A read threshold is insufficient to remove spurious barcodes. a-f Experiments with 19 clones of known barcodes, mixed in different frequencies and then diluted such that the expected total cell number per technical replicate varies from ~5 cells to ~104 cells for all clones combined. Plots show number of reads in each of two technical replicates after normalization to 105 reads per replicate. Green dots denote barcodes that were true, black dots denote spurious barcodes. The grey region with red border approximates a cell count of one or less, i.e., the frequency of barcode reads within this range is below what is expected for a single cell. Dashed horizontal and vertical lines and numbers alongside denote the approximate number of cells to which the normalized read numbers correspond. g-i Quantification of the performance of filtering based on a fixed read threshold (without prior normalization) when considering reference-list-based filtering as a gold standard, applied to barcode sequencing data on T cell differentiation (8) and haematopoiesis (9). Sensitivity (g), specificity (h) and precision (i) are shown as a function of the applied read threshold for four sequencing lanes (denoted by the different colors)
Fig. 3
Fig. 3
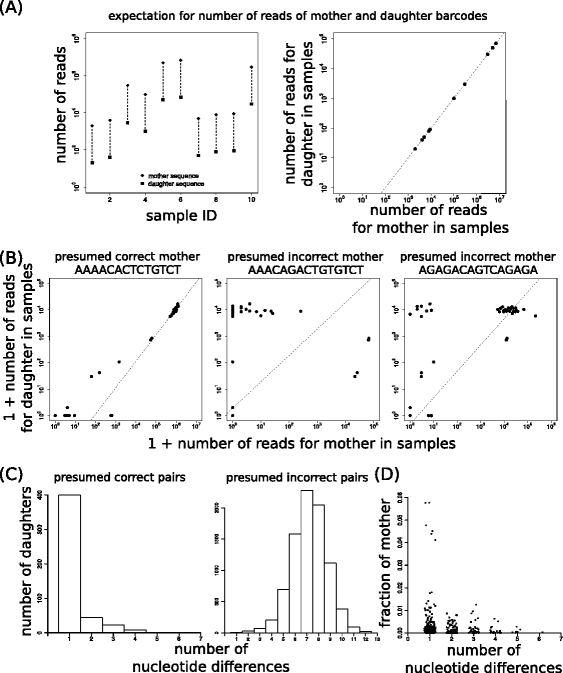
The frequency of sequencing errors is highly predictable across samples within a single lane. (a) Artificial data from a hypothetical sequencing lane with read numbers for one mother barcode and an associated daughter barcode, derived by sequencing error, in ten samples. Read numbers for mother and daughter barcode are either plotted as a function of sample ID (left panel) or against each other (right panel). b Examples of the read counts of three potential mother barcodes and of one particular spurious barcode plotted against each other, for presumed correct (left panel) and incorrect (other panels) mother-daughter pairs. Each dot represents one technical replicate, lines denote the prediction based on total frequencies of mother and daughter barcodes. Note that only for one of the pairs the frequency of errors is quite predictable across the samples, strongly suggesting that the spurious barcode derives from that mother. c, d The 500 most frequent spurious barcodes were compared to all 19 mother barcodes and the presumed mother was selected based on predictability of sequencing errors across samples by visual inspection. The number of nucleotide sequence differences was determined for each presumed mother-daughter pair (c, left panel) and for every other possible pair (c, right panel). For the presumed mother-daughter pairs the fraction of reads of the daughter sequence relative to the mother sequence was also determined (d)
Fig. 4
Fig. 4
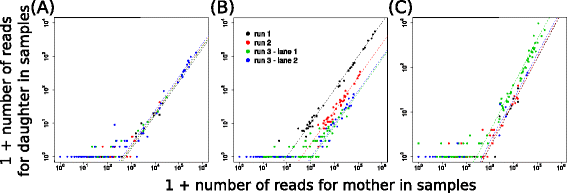
Predictability of the frequency of sequencing errors in complex biological samples. a-c Examples of the number of reads of presumed mother and daughter sequences plotted against each other. Each dot represents one technical replicate, lines denote the prediction based on total frequencies of mother and daughter barcodes. Colors denote in which run or lane a sample was sequenced. Examples are shown for pairs which have an approximately equal error frequency across runs and lanes (a), which have different error frequencies across runs yet similar frequencies across lanes of the same run (b), and which have different error frequencies across lanes of the same run yet similar frequencies across runs (c)
Fig. 5
Fig. 5
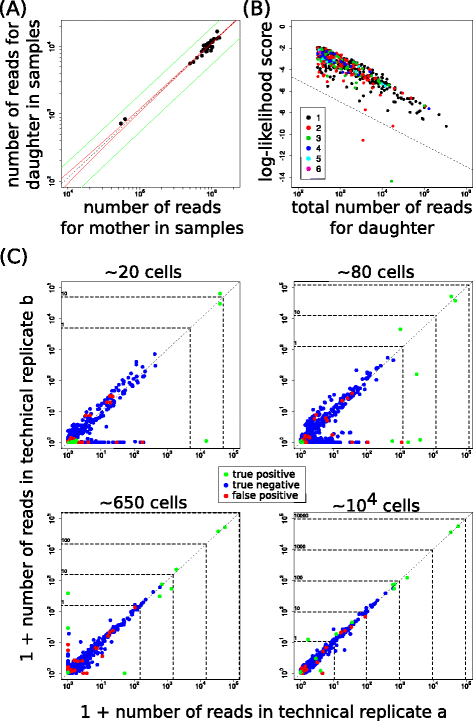
Predictability of sequence error frequency allows for detection of spurious barcodes. a Example of zoom-in of read numbers of potential mother and daughter sequences plotted against each other. Each dot represents one (half)-sample, dashed black line denotes the prediction based on total frequencies of mother and daughter barcodes, solid lines denote 95 % confidence band when assuming that errors are described by a binomial distribution (red) or a beta-binomial distribution (green). b ‘Log-likelihood score’ of presumed mother-daughter pairs as identified by visual inspection, as a function of the total read number of the daughter barcode. Each dot denotes one pair and its color denotes their number of nucleotide differences. Dashed line represents the threshold above which pairs are subsequently considered correct. c Result of cleaning procedure on data with different dilutions of 19 known barcode clones (expected cell numbers per technical replicate denoted above panels). Dots represent read number in each of the two replicates, colors denote whether the barcode was a true positive, a true negative, or a false positive. Note that there are no false negatives in this simple data set. Dashed horizontal and vertical lines and numbers alongside denote the approximate number of cells to which the normalized read numbers correspond
Fig. 6
Fig. 6
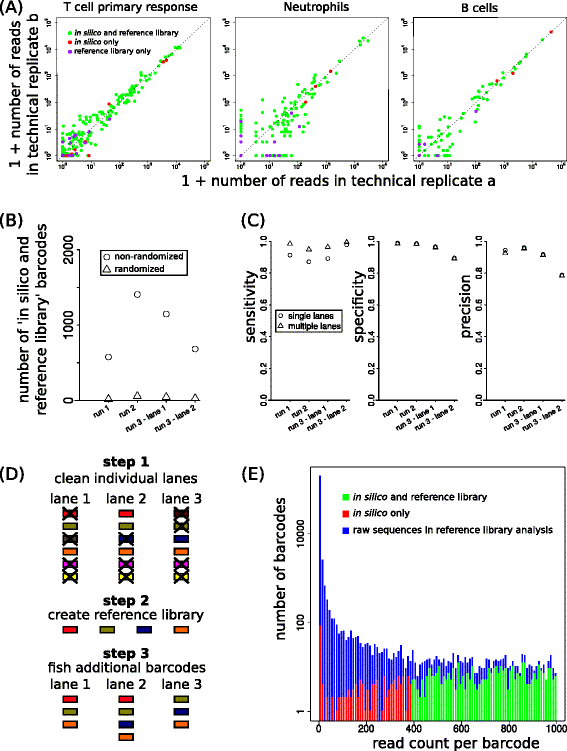
Ability to distinguish true and spurious barcodes in complex data sets. a Examples of results of clean-up procedure on barcoding data from four different sequencing lanes on T cell differentiation and haematopoiesis. Dots represent read numbers in each of the two technical replicates and their colors denote whether the barcode was identified as true by both the in silico clean-up procedure and by reference-library-based filtering, was in-silico-identified only or reference-library-identified only (barcodes filtered out by both approaches not plotted). b Number of barcodes left after cleaning that are also present in the reference library, either with or without prior randomization of both the barcodes and the samples. c Comparison of clean-up procedure to the barcodes that are true according to the reference list of the viral barcode library. Considering the reference list as a gold standard, the sensitivity (left panel), specificity (middle panel) and precision (right panel) are shown for the clean-up algorithm for each of the four individual lanes (denoted by ‘single lanes’), and when using the in silico created reference library based on the use of the clean-up algorithm on the separate lanes (denoted by ‘multiple lanes’). d Sketch explaining the concept of constructing an in silico reference library that can be used to combine information from multiple lanes during cleaning. Each colored symbol denotes a distinct barcode. e Histogram of the number of reads per barcode in the independent sequencing of the barcode reference library, after zoom-in on infrequent barcodes. Barcodes occurring in the experimental data (at least one of the four lanes) are highlighted in green and red

Similar articles

Cited by

References

    1. Chen J, Li Y, Yu TS, McKay RM, Burns DK, Kernie SG, Parada LF. A restricted cell population propagates glioblastoma growth after chemotherapy. Nature. 2012;488:522–6. doi: 10.1038/nature11287. - DOI - PMC - PubMed
    1. Driessens G, Beck B, Caauwe A, Simons BD, Blanpain C. Defining the mode of tumour growth by clonal analysis. Nature. 2012;488:527–30. doi: 10.1038/nature11344. - DOI - PMC - PubMed
    1. Schepers AG, Snippert HJ, Stange DE, Van Den Born M, Van Es JH, Van De Wetering M, Clevers H. Lineage tracing reveals Lgr5 + stem cell activity in mouse intestinal adenomas. Science. 2012;337:730–5. doi: 10.1126/science.1224676. - DOI - PubMed
    1. Zomer A, Ellenbroek SI, Ritsma L, Beerling E, Vrisekoop N, Van Rheenen J. Intravital imaging of cancer stem cell plasticity in mammary tumors. Stem Cells. 2013;31:602–6. doi: 10.1002/stem.1296. - DOI - PMC - PubMed
    1. Brady T, Roth SL, Malani N, Wang GP, Berry CC, Leboulch P, Hacein-Bey-Abina S, Cavazzana-Calvo M, Papapetrou EP, Sadelain M, Savilahti H, Bushman FD. A method to sequence and quantify DNA integration for monitoring outcome in gene therapy. Nucleic Acids Res. 2011;39 doi: 10.1093/nar/gkr140. - DOI - PMC - PubMed

Publication types