

The spatial distribution of gender differences in obesity prevalence differs from overall obesity prevalence among US adults
- PMID: 27039046
- PMCID: PMC4901384
- DOI: 10.1016/j.annepidem.2016.02.010
The spatial distribution of gender differences in obesity prevalence differs from overall obesity prevalence among US adults
Abstract
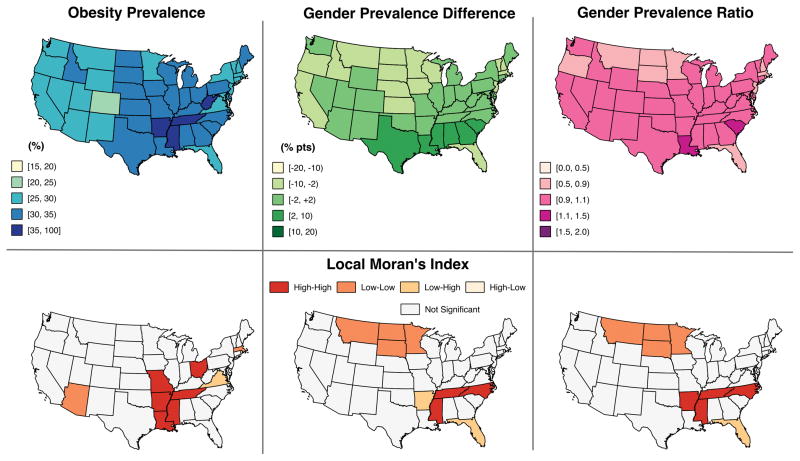
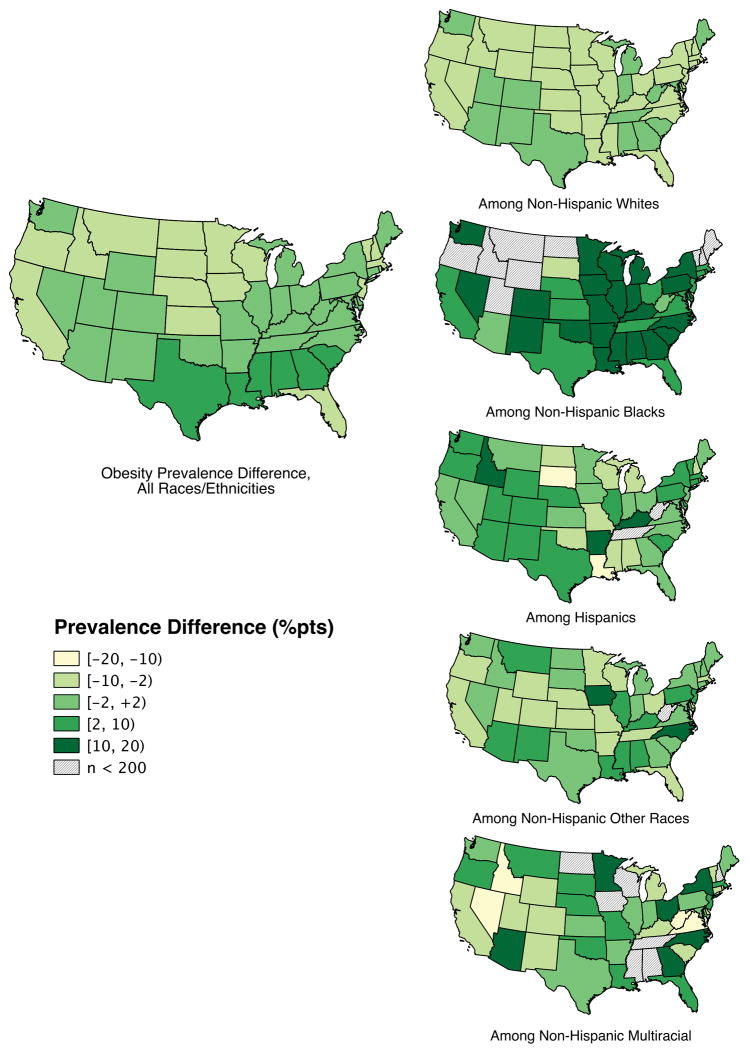
Purpose: Although obesity disparities between racial and socioeconomic groups have been well characterized, those based on gender and geography have not been as thoroughly documented. This study describes obesity prevalence by state, gender, and race and/or ethnicity to (1) characterize obesity gender inequality, (2) determine if the geographic distribution of inequality is spatially clustered, and (3) contrast the spatial clustering patterns of obesity gender inequality with overall obesity prevalence.
Methods: Data from the Centers for Disease Control and Prevention's 2013 Behavioral Risk Factor Surveillance System were used to calculate state-specific obesity prevalence and gender inequality measures. Global and local Moran's indices were calculated to determine spatial autocorrelation.
Results: Age-adjusted, state-specific obesity prevalence difference and ratio measures show spatial autocorrelation (z-score = 4.89, P-value < .001). Local Moran's indices indicate the spatial distributions of obesity prevalence and obesity gender inequalities are not the same. High and low values of obesity prevalence and gender inequalities cluster in different areas of the United States.
Conclusions: Clustering of gender inequality suggests that spatial processes operating at the state level, such as occupational or physical activity policies or social norms, are involved in the etiology of the inequality and necessitate further attention to the determinates of obesity gender inequality.
Keywords: Behavioral risk factor surveillance; Continental population groups; Environment; Ethnic groups; Female; Male; Obesity; Social environment; Spatial analysis; United States.
Copyright © 2016 Elsevier Inc. All rights reserved.
Conflict of interest statement
Figures
References
-
- Flegal KM, Carroll MD, Kit BK, Ogden CL. Prevalence of obesity and trends in the distribution of body mass index among US adults, 1999–2010. JAMA : the journal of the American Medical Association. 2012;307(5):491–7. - PubMed
-
- Harper S, Lynch J. Measuring Health Inequalities. In: Oakes JMK, Jay S, editors. Methods in Social Epidemiology. San Francisco, CA: John Wiley & Sons, Inc; 2006. pp. 134–68.
-
- Slack T, Myers CA, Martin CK, Heymsfield SB. The geographic concentration of US adult obesity prevalence and associated social, economic, and environmental factors. Obesity (Silver Spring, Md) 2014;22(3):868–74. - PubMed
MeSH terms
Grants and funding
LinkOut - more resources
Full Text Sources
Other Literature Sources
Medical
