Metabolomic network analysis of estrogen-stimulated MCF-7 cells: a comparison of overrepresentation analysis, quantitative enrichment analysis and pathway analysis versus metabolite network analysis
- PMID: 27039105
- PMCID: PMC5047848
- DOI: 10.1007/s00204-016-1695-x
Metabolomic network analysis of estrogen-stimulated MCF-7 cells: a comparison of overrepresentation analysis, quantitative enrichment analysis and pathway analysis versus metabolite network analysis
Abstract
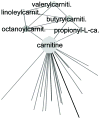
In the context of the Human Toxome project, mass spectroscopy-based metabolomics characterization of estrogen-stimulated MCF-7 cells was studied in order to support the untargeted deduction of pathways of toxicity. A targeted and untargeted approach using overrepresentation analysis (ORA), quantitative enrichment analysis (QEA) and pathway analysis (PA) and a metabolite network approach were compared. Any untargeted approach necessarily has some noise in the data owing to artifacts, outliers and misidentified metabolites. Depending on the chemical analytical choices (sample extraction, chromatography, instrument and settings, etc.), only a partial representation of all metabolites will be achieved, biased by both the analytical methods and the database used to identify the metabolites. Here, we show on the one hand that using a data analysis approach based exclusively on pathway annotations has the potential to miss much that is of interest and, in the case of misidentified metabolites, can produce perturbed pathways that are statistically significant yet uninformative for the biological sample at hand. On the other hand, a targeted approach, by narrowing its focus and minimizing (but not eliminating) misidentifications, renders the likelihood of a spurious pathway much smaller, but the limited number of metabolites also makes statistical significance harder to achieve. To avoid an analysis dependent on pathways, we built a de novo network using all metabolites that were different at 24 h with and without estrogen with a p value <0.01 (53) in the STITCH database, which links metabolites based on known reactions in the main metabolic network pathways but also based on experimental evidence and text mining. The resulting network contained a "connected component" of 43 metabolites and helped identify non-endogenous metabolites as well as pathways not visible by annotation-based approaches. Moreover, the most highly connected metabolites (energy metabolites such as pyruvate and alpha-ketoglutarate, as well as amino acids) showed only a modest change between proliferation with and without estrogen. Here, we demonstrate that estrogen has subtle but potentially phenotypically important alterations in the acyl-carnitine fatty acids, acetyl-putrescine and succinoadenosine, in addition to likely subtle changes in key energy metabolites that, however, could not be verified consistently given the technical limitations of this approach. Finally, we show that a network-based approach combined with text mining identifies pathways that would otherwise neither be considered statistically significant on their own nor be identified via ORA, QEA, or PA.
Keywords: Bioinformatics; Computational toxicology; Endocrine disruption; Estrogen; Metabolomics; Pathway analysis.
Figures


Similar articles
-
Metabolomic profiling for identification of metabolites and relevant pathways for taurine in hepatic stellate cells.World J Gastroenterol. 2017 Aug 21;23(31):5713-5721. doi: 10.3748/wjg.v23.i31.5713. World J Gastroenterol. 2017. PMID: 28883696 Free PMC article.
-
Enantioselective Effects of Metalaxyl Enantiomers on Breast Cancer Cells Metabolic Profiling Using HPLC-QTOF-Based Metabolomics.Int J Mol Sci. 2017 Jan 12;18(1):142. doi: 10.3390/ijms18010142. Int J Mol Sci. 2017. PMID: 28085117 Free PMC article.
-
[A novel method for efficient screening and annotation of important pathway-associated metabolites based on the modified metabolome and probe molecules].Se Pu. 2022 Sep;40(9):788-796. doi: 10.3724/SP.J.1123.2022.03025. Se Pu. 2022. PMID: 36156625 Free PMC article. Chinese.
-
How unbiased is non-targeted metabolomics and is targeted pathway screening the solution?Curr Pharm Biotechnol. 2011 Jul;12(7):1053-66. doi: 10.2174/138920111795909078. Curr Pharm Biotechnol. 2011. PMID: 21466457 Review.
-
Integrating bioinformatics approaches for a comprehensive interpretation of metabolomics datasets.Curr Opin Biotechnol. 2018 Dec;54:1-9. doi: 10.1016/j.copbio.2018.01.010. Epub 2018 Feb 6. Curr Opin Biotechnol. 2018. PMID: 29413745 Free PMC article. Review.
Cited by
-
Metabolomic profiling for identification of metabolites and relevant pathways for taurine in hepatic stellate cells.World J Gastroenterol. 2017 Aug 21;23(31):5713-5721. doi: 10.3748/wjg.v23.i31.5713. World J Gastroenterol. 2017. PMID: 28883696 Free PMC article.
-
Human IPSC 3D brain model as a tool to study chemical-induced dopaminergic neuronal toxicity.Neurobiol Dis. 2022 Jul;169:105719. doi: 10.1016/j.nbd.2022.105719. Epub 2022 Apr 7. Neurobiol Dis. 2022. PMID: 35398340 Free PMC article.
-
Quantitative Comparison of Statistical Methods for Analyzing Human Metabolomics Data.Metabolites. 2022 Jun 4;12(6):519. doi: 10.3390/metabo12060519. Metabolites. 2022. PMID: 35736452 Free PMC article.
-
Autophagy-Related Genes in Atherosclerosis.J Healthc Eng. 2021 Jul 2;2021:6402206. doi: 10.1155/2021/6402206. eCollection 2021. J Healthc Eng. 2021. PMID: 34306596 Free PMC article.
-
Metabolomics in Preclinical Drug Safety Assessment: Current Status and Future Trends.Metabolites. 2024 Jan 31;14(2):98. doi: 10.3390/metabo14020098. Metabolites. 2024. PMID: 38392990 Free PMC article. Review.
References
-
- Aittokallio T, Kurki M, Nevalainen O, Nikula T, West A, Lahesmaa R. Computational strategies for analyzing data in gene expression microarray experiments. J Bioinform Comput Biol. 2003;1:541–586. - PubMed
Publication types
MeSH terms
Substances
Grants and funding
LinkOut - more resources
Full Text Sources
Other Literature Sources

