

Mind-body interactions in the regulation of airway inflammation in asthma: A PET study of acute and chronic stress
- PMID: 27039241
- PMCID: PMC5045317
- DOI: 10.1016/j.bbi.2016.03.024
Mind-body interactions in the regulation of airway inflammation in asthma: A PET study of acute and chronic stress
Erratum in
-
Corrigendum to "Mind-body interactions in the regulation of airway inflammation in asthma: A PET study of acute and chronic stress" [Brain Behav. Immun. 58 (2016) 18-30].Brain Behav Immun. 2018 Jan;67:398-401. doi: 10.1016/j.bbi.2017.08.009. Epub 2017 Aug 20. Brain Behav Immun. 2018. PMID: 28835333 Free PMC article. No abstract available.
Abstract
Background: Psychological stress has long been recognized as a contributing factor to asthma symptom expression and disease progression. Yet, the neural mechanisms that underlie this relationship have been largely unexplored in research addressing the pathophysiology and management of asthma. Studies that have examined the mechanisms of this relationship in the periphery suggest that it is the superimposition of acute stress on top of chronic stress that is of greatest concern for airway inflammation.
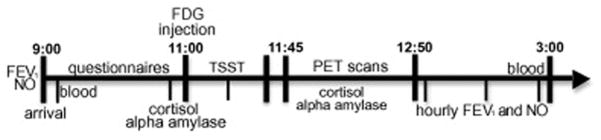
Methods: We compared asthmatic individuals with high and low levels of chronic life stress in their neural and peripheral physiological responses to the Trier Social Stress Test and a matched control task. We used FDG-PET to measure neural activity during performance of the two tasks. We used both circulating and airway-specific markers of asthma-related inflammation to assess the impact of acute stress in these two groups.
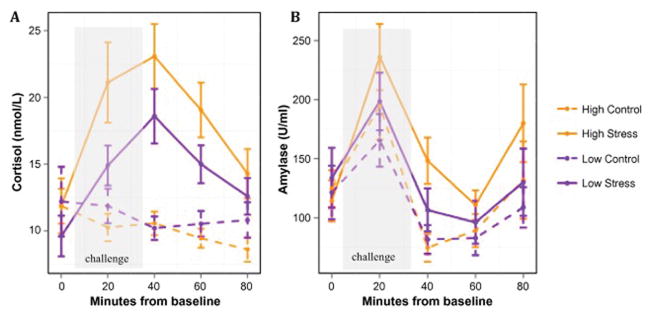
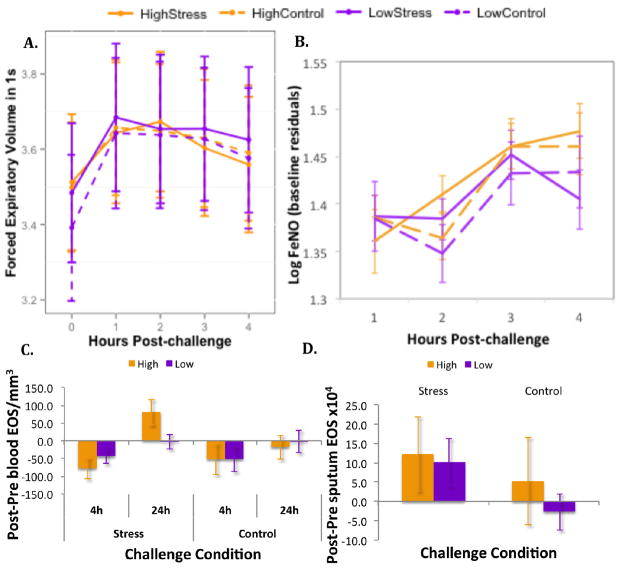
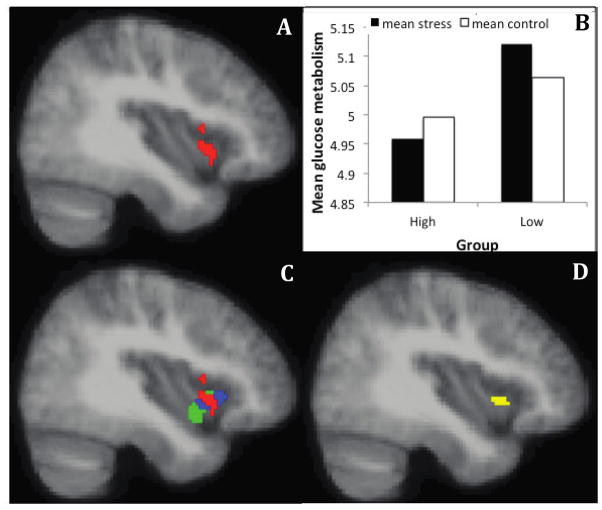
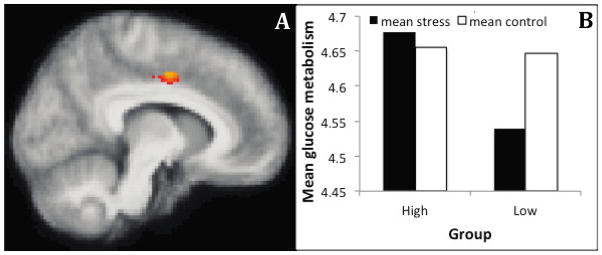
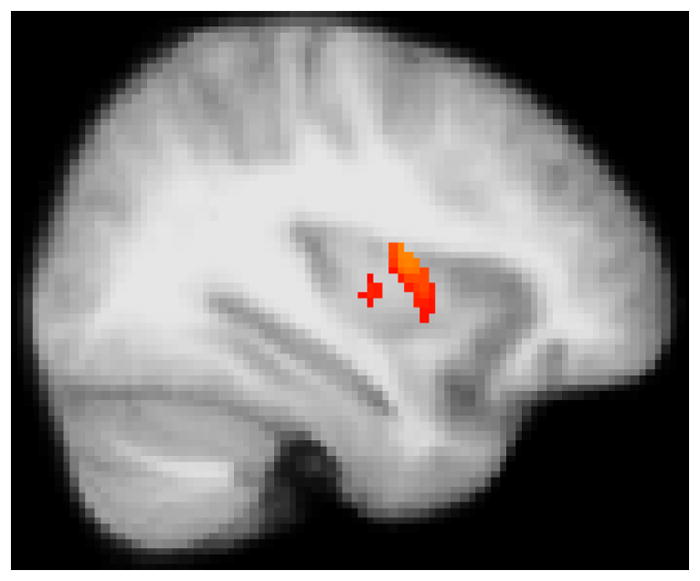
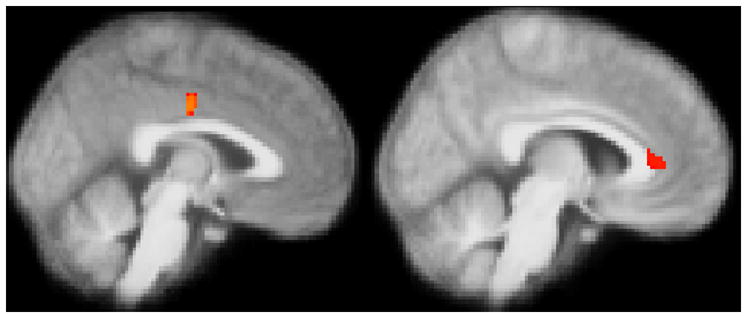
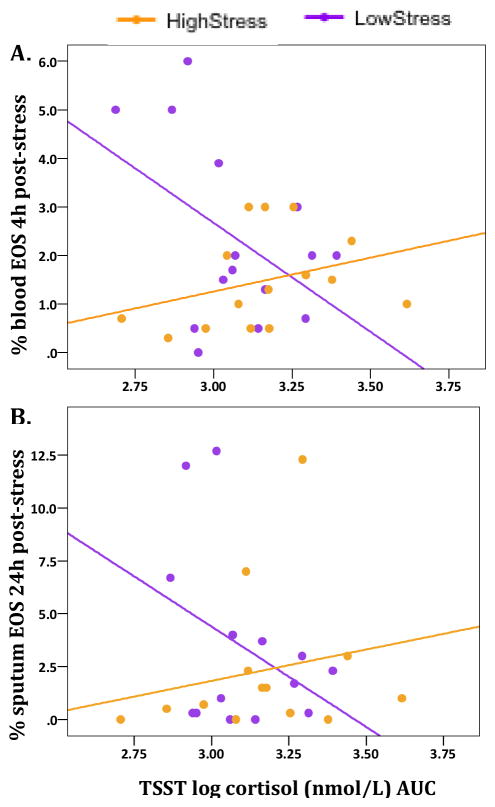
Results: Asthmatics under chronic stress had a larger HPA-axis response to an acute stressor, which failed to show the suppressive effects on inflammatory markers observed in those with low chronic stress. Moreover, our PET data suggest that greater activity in the anterior insula during acute stress may reflect regulation of the effect of stress on inflammation. In contrast, greater activity in the mid-insula and perigenual anterior cingulate seems to reflect greater reactivity and was associated with greater airway inflammation, a more robust alpha amylase response, and a greater stress-induced increase in proinflammatory cytokine mRNA expression in airway cells.
Conclusions: Acute stress is associated with increases in markers of airway inflammation in asthmatics under chronic stress. This relationship may be mediated by interactions between the insula and anterior cingulate cortex, that determine the salience of environmental cues, as well as descending regulatory influence of inflammatory pathways in the periphery.
Keywords: ACC; Asthma; Cortisol; IL-1; IL-17; Inflammation; Insula; PET; Stress; TSST.
Copyright © 2016 Elsevier Inc. All rights reserved.
Figures
Similar articles
-
Fueling the fire in the lung-brain axis: The salience network connects allergen-provoked TH17 responses to psychological stress in asthma.Brain Behav Immun. 2025 Aug;128:276-288. doi: 10.1016/j.bbi.2025.04.004. Epub 2025 Apr 8. Brain Behav Immun. 2025. PMID: 40209864
-
Acute stress-induced increases in exhaled nitric oxide in asthma and their association with endogenous cortisol.Am J Respir Crit Care Med. 2011 Jan 1;183(1):26-30. doi: 10.1164/rccm.201005-0691OC. Epub 2010 Aug 13. Am J Respir Crit Care Med. 2011. PMID: 20709818
-
Reduced stress and inflammatory responsiveness in experienced meditators compared to a matched healthy control group.Psychoneuroendocrinology. 2016 Jun;68:117-25. doi: 10.1016/j.psyneuen.2016.02.013. Epub 2016 Feb 20. Psychoneuroendocrinology. 2016. PMID: 26970711 Free PMC article.
-
The brain and asthma: what are the linkages?Chem Immunol Allergy. 2012;98:14-31. doi: 10.1159/000336495. Epub 2012 Jun 26. Chem Immunol Allergy. 2012. PMID: 22767055 Review.
-
[Bronchial asthma and psychological stress].Rinsho Byori. 2010 Mar;58(3):292-9. Rinsho Byori. 2010. PMID: 20408448 Review. Japanese.
Cited by
-
Clinically relevant effects of Mindfulness-Based Stress Reduction in individuals with asthma.Brain Behav Immun Health. 2022 Sep 14;25:100509. doi: 10.1016/j.bbih.2022.100509. eCollection 2022 Nov. Brain Behav Immun Health. 2022. PMID: 36177306 Free PMC article.
-
Anxiety and noneosinophilic asthma among adults in the United States.J Allergy Clin Immunol Pract. 2019 Apr;7(4):1367-1369.e1. doi: 10.1016/j.jaip.2018.10.039. Epub 2018 Nov 3. J Allergy Clin Immunol Pract. 2019. PMID: 30395990 Free PMC article. No abstract available.
-
Resting state functional connectivity changes following mindfulness-based stress reduction predict improvements in disease control for patients with asthma.Brain Behav Immun. 2024 Jan;115:480-493. doi: 10.1016/j.bbi.2023.10.026. Epub 2023 Nov 2. Brain Behav Immun. 2024. PMID: 37924961 Free PMC article. Clinical Trial.
-
Individual differences in glucocorticoid regulation: Does it relate to disease risk and resilience?Front Neuroendocrinol. 2020 Jan;56:100803. doi: 10.1016/j.yfrne.2019.100803. Epub 2019 Nov 4. Front Neuroendocrinol. 2020. PMID: 31697962 Free PMC article.
-
IDENTIFYING INDIVIDUAL STRESS SUSCEPTIBILITY USING GENOMIC AND IMMUNE BIOMARKERS.Trans Am Clin Climatol Assoc. 2019;130:235-245. Trans Am Clin Climatol Assoc. 2019. PMID: 31516188 Free PMC article.
References
-
- Akdeniz C, Tost H, Streit F, Haddad L, Wüst S, Schäfer A, Schneider M, Rietschel M, Kirsch P, Meyer-Lindenberg A. Neuroimaging Evidence for a Role of Neural Social Stress Processing in Ethnic Minority–Associated Environmental Risk. JAMA Psychiatry. 2014;71:672. doi: 10.1001/jamapsychiatry.2014.35. - DOI - PubMed
MeSH terms
Substances
Grants and funding
LinkOut - more resources
Full Text Sources
Other Literature Sources
Medical
