

Power estimation for non-standardized multisite studies
- PMID: 27039700
- PMCID: PMC5656257
- DOI: 10.1016/j.neuroimage.2016.03.051
Power estimation for non-standardized multisite studies
Abstract
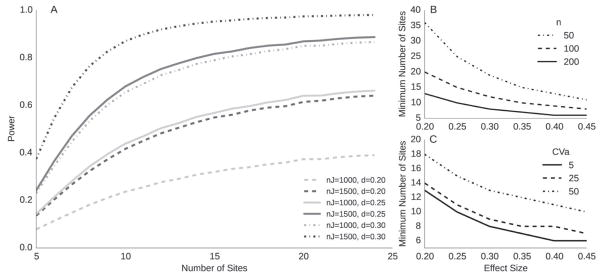
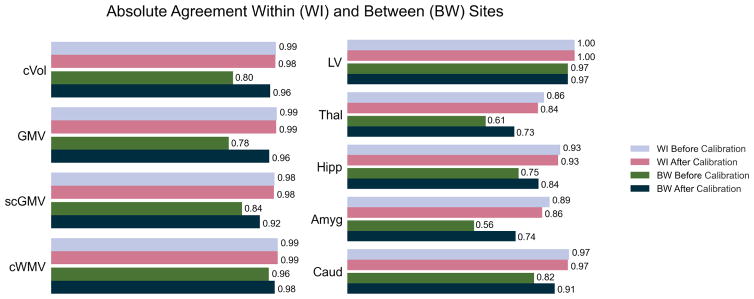
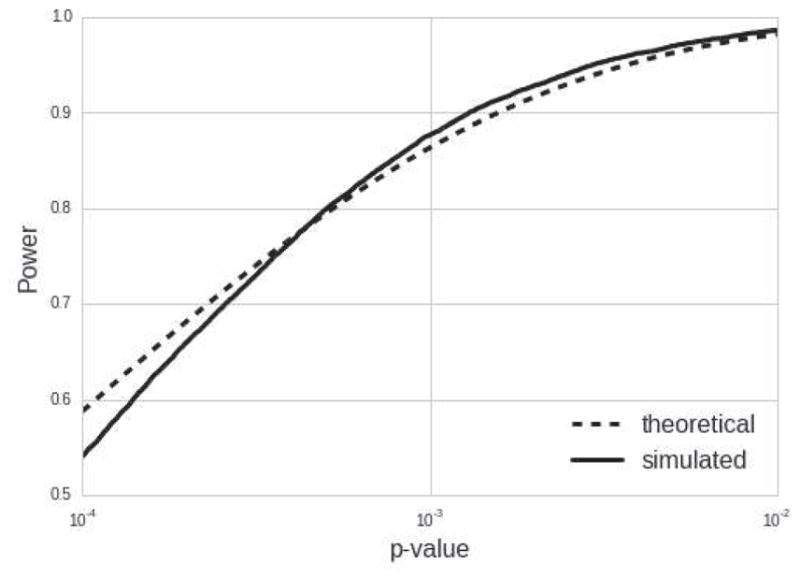
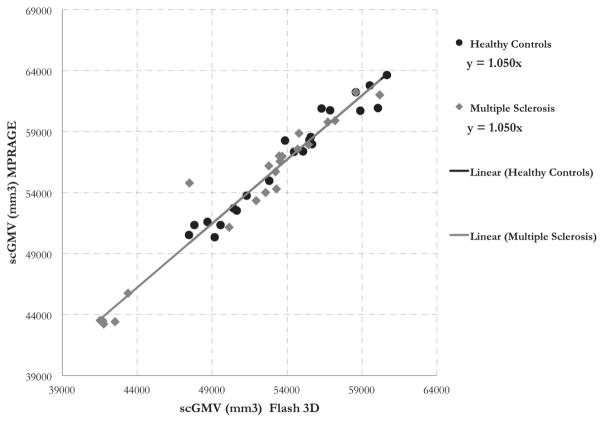
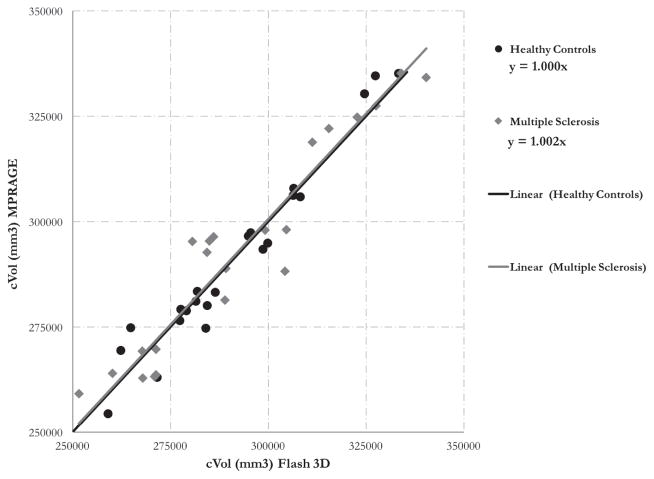
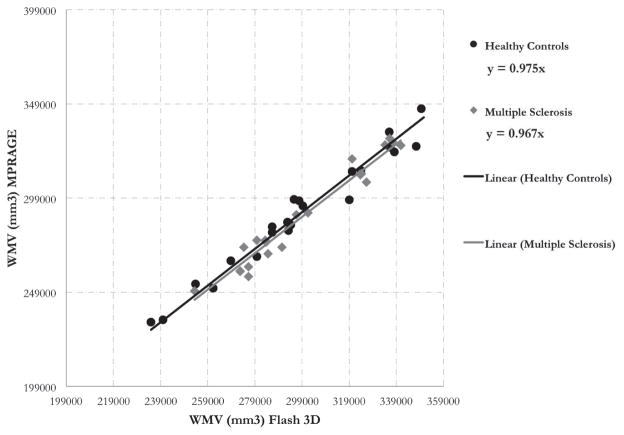
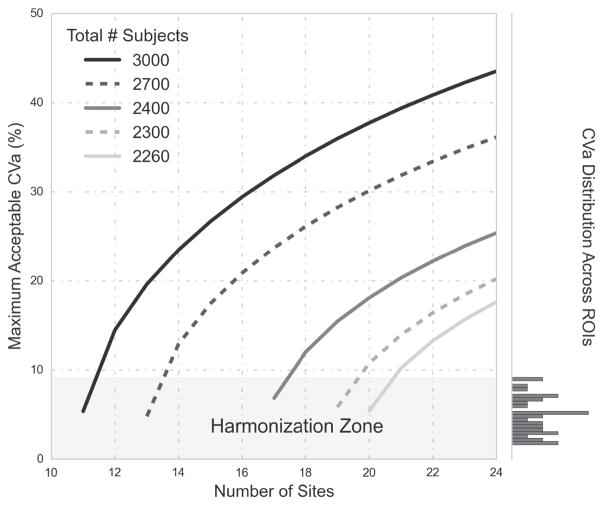
A concern for researchers planning multisite studies is that scanner and T1-weighted sequence-related biases on regional volumes could overshadow true effects, especially for studies with a heterogeneous set of scanners and sequences. Current approaches attempt to harmonize data by standardizing hardware, pulse sequences, and protocols, or by calibrating across sites using phantom-based corrections to ensure the same raw image intensities. We propose to avoid harmonization and phantom-based correction entirely. We hypothesized that the bias of estimated regional volumes is scaled between sites due to the contrast and gradient distortion differences between scanners and sequences. Given this assumption, we provide a new statistical framework and derive a power equation to define inclusion criteria for a set of sites based on the variability of their scaling factors. We estimated the scaling factors of 20 scanners with heterogeneous hardware and sequence parameters by scanning a single set of 12 subjects at sites across the United States and Europe. Regional volumes and their scaling factors were estimated for each site using Freesurfer's segmentation algorithm and ordinary least squares, respectively. The scaling factors were validated by comparing the theoretical and simulated power curves, performing a leave-one-out calibration of regional volumes, and evaluating the absolute agreement of all regional volumes between sites before and after calibration. Using our derived power equation, we were able to define the conditions under which harmonization is not necessary to achieve 80% power. This approach can inform choice of processing pipelines and outcome metrics for multisite studies based on scaling factor variability across sites, enabling collaboration between clinical and research institutions.
Copyright © 2016 The Authors. Published by Elsevier Inc. All rights reserved.
Figures
References
-
- Cannon TD, Cadenhead K, Cornblatt B, Woods SW, Addington J, Walker E, Seidman LJ, Perkins D, Tsuang M, McGlashan T, et al. Reliability of neuroanatomical measurements in a multisite longitudinal study of youth at risk for psychosis. Human Brain Mapping. 2014;35(5):2424–2434. doi: 10.1002/hbm.22338. URL http://dx.doi.org/10.1002/hbm.22338. - DOI - DOI - PMC - PubMed
-
- Ewers M, Teipel S, Dietrich O, Schönberg S, Jessen F, Heun R, Scheltens P, van de Pol L, Freymann N, Moeller H-J, et al. Multicenter assessment of reliability of cranial MRI. Neurobiology of Aging. 2006;27(8):1051–1059. - PubMed
-
- Jovicich J, Czanner S, Greve D, Haley E, van der Kouwe A, Gollub R, Kennedy D, Schmitt F, Brown G, MacFall J, Fischl B, Dale A. Reliability in multi-site structural MRI studies: Effects of gradient non-linearity correction on phantom and human data. Neuro Image. 2006;30(2):436– 443. doi: 10.1016/j.neuroimage.2005.09.046. URL http://www.sciencedirect.com/science/article/B6WNP-4HM7S0B-2/2/4fa5ff26c.... - DOI - PubMed
-
- Boccardi M, Bocchetta M, Ganzola R, Robitaille N, Redolfi A, Duchesne S, Jack C, Jr, Frisoni G. EADC-ADNI Working Group on The Harmonized Protocol for Hippocampal Volumetry and for the Alzheimer’s Disease Neuroimaging Initiative: Operationalizing protocol differences for EADC-ADNI manual hippocampal segmentation. Alzheimers Dement - PubMed
Publication types
MeSH terms
Grants and funding
LinkOut - more resources
Full Text Sources
Other Literature Sources
Medical
