. 2017 Jun:153:346-358.
doi: 10.1016/j.neuroimage.2016.03.063. Epub 2016 Apr 1.

Dynamics of scene representations in the human brain revealed by magnetoencephalography and deep neural networks

Affiliations

Dynamics of scene representations in the human brain revealed by magnetoencephalography and deep neural networks

Radoslaw Martin Cichy et al. Neuroimage. 2017 Jun.

Abstract

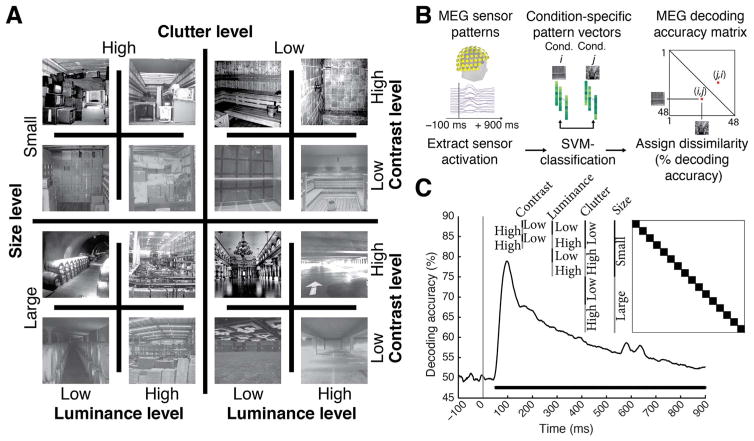
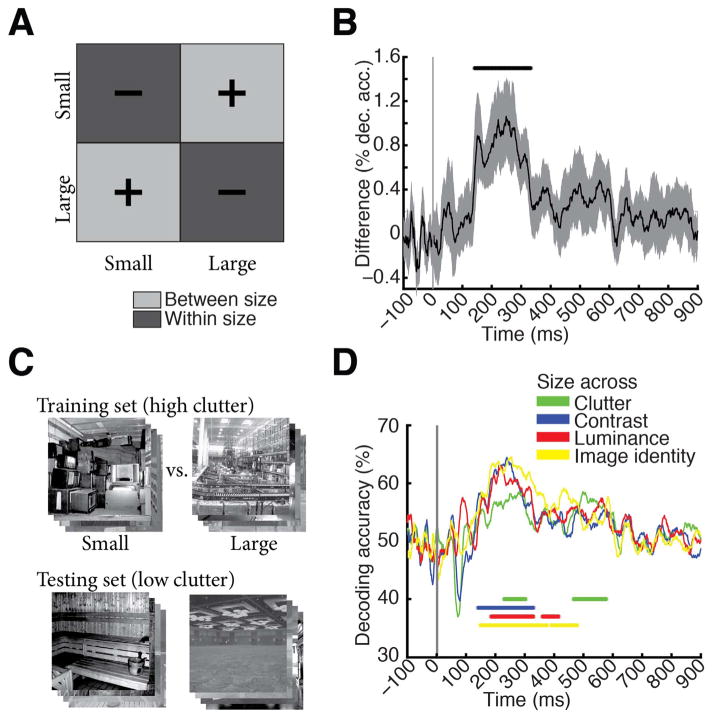
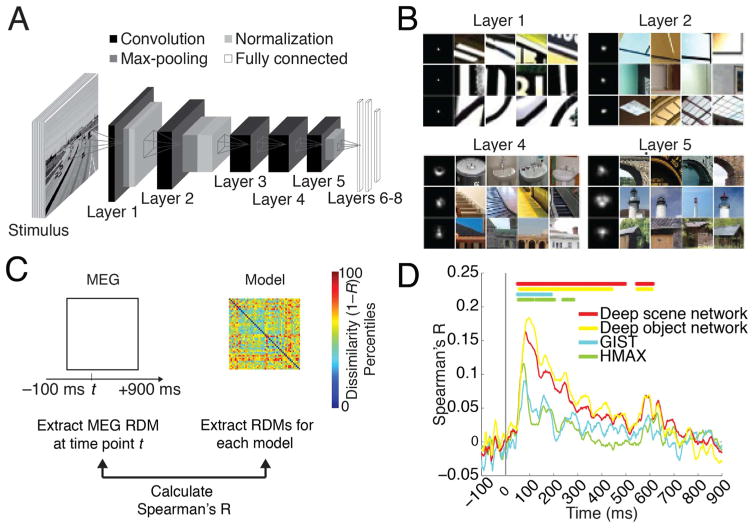
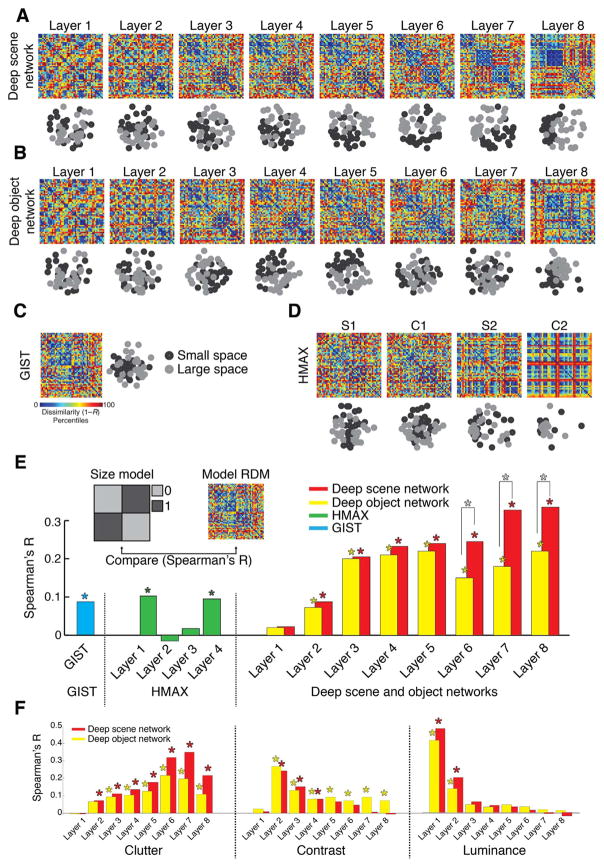
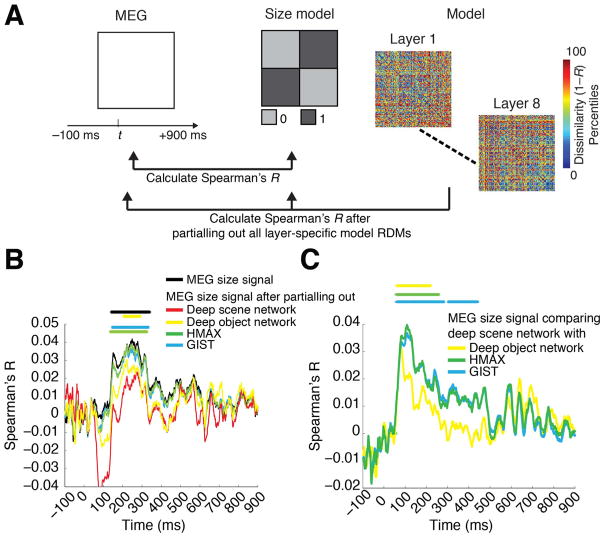
Human scene recognition is a rapid multistep process evolving over time from single scene image to spatial layout processing. We used multivariate pattern analyses on magnetoencephalography (MEG) data to unravel the time course of this cortical process. Following an early signal for lower-level visual analysis of single scenes at ~100ms, we found a marker of real-world scene size, i.e. spatial layout processing, at ~250ms indexing neural representations robust to changes in unrelated scene properties and viewing conditions. For a quantitative model of how scene size representations may arise in the brain, we compared MEG data to a deep neural network model trained on scene classification. Representations of scene size emerged intrinsically in the model, and resolved emerging neural scene size representation. Together our data provide a first description of an electrophysiological signal for layout processing in humans, and suggest that deep neural networks are a promising framework to investigate how spatial layout representations emerge in the human brain.

Keywords: Deep neural network; Magnetoencephalography; Representational similarity analysis; Scene perception; Spatial layout.


Figures

Fig. 1
Fig. 1. Image set and single-image decoding
A) The stimulus set comprised 48 indoor scene images differing in the size of the space depicted (small vs. large), as well as clutter, contrast, and luminance level; here each experimental factor combination is exemplified by one image. The image set was based on behaviorally validated images of scenes differing in size and clutter level, de-correlating factors size and clutter explicitly by experimental design (Park et al., 2015). Note that size refers to the size of the real-world space depicted on the image, not the stimulus parameters; all images subtended 8 visual angle during the experiment. B) Time-resolved (1 ms steps from −100 to +900 ms with respect to stimulus onset) pairwise support vector machine classification of experimental conditions based on MEG sensor level patterns. Classification results were stored in time-resolved 48×48 MEG decoding matrices. C) Decoding results for single scene classification independent of other experimental factors. Decoding results were averaged across the dark blocks (matrix inset), to control for luminance, contrast, clutter level and scene size differences. Inset shows indexing of matrix by image conditions. Horizontal line below curve indicates significant time points (n=15, cluster-definition threshold P < 0.05, corrected significance level P < 0.05); gray vertical line indicates image onset.
Fig. 2
Fig. 2. Scene size is discriminated by visual representations
A) To determine the time course of scene size processing we determined when visual representations clustered by scene size. For this we subtracted mean within-size decoding accuracies (dark gray, −) from between-size decoding accuracies (light gray, +). B) Scene size was discriminated by visual representations late in time (onset of significance at 141ms (118–156 ms), peak at 249 ms (150–274 ms). Gray shaded area indicates 95% confidence intervals determined by bootstrapping participants. C) Cross-classification analysis, exemplified for cross-classification of scene size across clutter level. A classifier was trained to discriminate scene size on high clutter images, and tested on low clutter images. Results were averaged following an opposite assignment of clutter images to training and testing sets. Before entering cross-classification analysis, MEG trials were grouped by clutter and size level respectively independent of image identity. A similar cross-classification analysis was applied for other image and scene properties. D) Results of cross-classification analysis indicated robustness of scene size visual representations to changes in other scene and image properties (scene clutter, luminance, contrast and image identity). Horizontal lines indicate significant time points (n=15, cluster-definition threshold P < 0.05, corrected significance level P < 0.05); gray vertical line indicates image onset. For result curves with 95% confidence intervals see Supplementary Fig. 2.
Fig. 3
Fig. 3. Predicting emerging neural representations of single scene images by computational models
A) Architecture of deep convolutional neural network trained on scene categorization (deep scene network). B) Receptive field (RF) of example deep scene neurons in layers 1, 2, 4, and 5. Each row represents one neuron. The left column indicates size of RF, and the remaining columns indicate image patches most strongly activating these neurons. Lower layers had small RFs with simple Gabor filter-like sensitivity, whereas higher layers had increasingly large RFs sensitive to complex forms. RFs for whole objects, texture, and surface layout information emerged although these features were not explicitly taught to the deep scene model. C) We used representational dissimilarity analysis to compare visual representations in brains with models. For every time point, we compared subject-specific MEG RDMs (Spearman’s R) to model RDMs and results were averaged across subjects. D) All investigated models significantly predicted emerging visual representations in the brain, with superior performance for the deep neural networks compared to HMAX and GIST. Horizontal lines indicate significant time points (n=15, cluster-definition threshold P < 0.05, corrected significance level P < 0.05); gray vertical line indicates image onset.
Fig. 4
Fig. 4. Representation of scene size in computational models of object and scene categorization
A–D) Layer-specific RDMs and corresponding 2D multidimensional scaling (MDS) plots for a deep scene network, deep object network, GIST, and HMAX. MDS plots are color-coded by scene size (small = black; large = gray). E) Quantifying the representation of scene size in computational models. We compared (Spearman’s R) each model’s RDMs with an explicit size model (RDM with entries 0 for images of similar size, 1 for images of dissimilar size). Results are color-coded for each model. F) Similar to (E) for clutter, contrast and luminance (results shown only for deep scene and object networks). While representations of the abstract scene properties size and clutter emerged with increasing layer number, the low-level image properties contrast and luminance successively abstracted away. Stars above bars indicate statistical significance. Stars between bars indicate significant differences between the corresponding layers of the deep scene vs. object network. Complete layer-wise comparisons available in Supplementary Fig. 7 (n=48; label permutation tests for statistical inference, P < 0.05, FDR-corrected for multiple comparisons).
Fig. 5
Fig. 5. The deep scene model accounts for more of the MEG size signal than other models
A) We combined representational similarity with partial correlation analysis to determine which computational models explained emerging representations of scene size in the brain. For each time point separately, we calculated the correlation of the MEG RDM with the size model RDM, partialling out all layer-wise RDMs of a computational model. B) MEG representations of scene size (termed MEG size signal) before (black) and after (color-coded by model) partialling out the effect of different computational models. Only partialling out the effect of the deep scene network abolished the MEG size signal. Note that the negative correlation observed between ~50 −150 ms when regressing out the deep scene network was not significant, and did not overlap with the scene size effect. This effect is known as suppression in partial correlations: the MEG RDMs and the size model are mostly uncorrelated during this time (black curve), but partialling out the DNN RDM induces a relationship (negative correlation) because it accounts for residuals left by the original model. C) Difference in amount of variance partialled out from the size signal: comparing all models to the deep scene network. The deep scene network accounted for more MEG size signal than all other models (n=15; cluster-definition threshold P < 0.05, significance threshold P < 0.05; results corrected for multiple comparisons by 5 for panel B and 3 for panel C).

References

    1. Aguirre GK, Zarahn E, D’Esposito M. An area within human ventral cortex sensitive to “building” stimuli: evidence and implications. Neuron. 1998;21:373–383. - PubMed
    1. Allison T, Ginter H, McCarthy G, Nobre AC, Puce A, Luby M, Spencer DD. Face recognition in human extrastriate cortex. J Neurophysiol. 1994;71:821–825. - PubMed
    1. Bentin S, Allison T, Puce A, Perez E, McCarthy G. Electrophysiological Studies of Face Perception in Humans. J Cogn Neurosci. 1996;8:551–565. - PMC - PubMed
    1. Bird CM, Capponi C, King JA, Doeller CF, Burgess N. Establishing the Boundaries: The Hippocampal Contribution to Imagining Scenes. J Neurosci. 2010;30:11688–11695. - PMC - PubMed
    1. Bonnici HM, Kumaran D, Chadwick MJ, Weiskopf N, Hassabis D, Maguire EA. Decoding representations of scenes in the medial temporal lobes. Hippocampus. 2012;22:1143–1153. - PMC - PubMed

LinkOut - more resources