. 2016 Jun;24(6):1030-1041.
doi: 10.1038/mt.2016.68. Epub 2016 Apr 4.

rAAV Gene Therapy in a Canavan's Disease Mouse Model Reveals Immune Impairments and an Extended Pathology Beyond the Central Nervous System

Affiliations

rAAV Gene Therapy in a Canavan's Disease Mouse Model Reveals Immune Impairments and an Extended Pathology Beyond the Central Nervous System

Seemin Seher Ahmed et al. Mol Ther. 2016 Jun.

Abstract

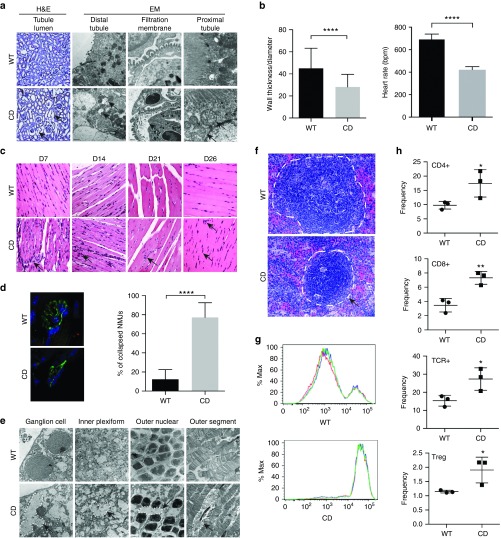
Aspartoacylase (AspA) gene mutations cause the pediatric lethal neurodegenerative Canavan disease (CD). There is emerging promise of successful gene therapy for CD using recombinant adeno-associated viruses (rAAVs). Here, we report an intracerebroventricularly delivered AspA gene therapy regime using three serotypes of rAAVs at a 20-fold reduced dose than previously described in AspA(-/-) mice, a bona-fide mouse model of CD. Interestingly, central nervous system (CNS)-restricted therapy prolonged survival over systemic therapy in CD mice but failed to sustain motor functions seen in systemically treated mice. Importantly, we reveal through histological and functional examination of untreated CD mice that AspA deficiency in peripheral tissues causes morphological and functional abnormalities in this heretofore CNS-defined disorder. We demonstrate for the first time that AspA deficiency, possibly through excessive N-acetyl aspartic acid accumulation, elicits both a peripheral and CNS immune response in CD mice. Our data establish a role for peripheral tissues in CD pathology and serve to aid the development of more efficacious and sustained gene therapy for this disease.


Figures

Figure 1
Figure 1
rAAV-mediated gene therapy delivered via intracerebroventricular injection in CD mice mimics the lethality and morphology correction seen in systemic delivery but does not restore motor function. (a) Kaplan–Meier survival curves for all groups treated with rAAV9, rAAVrh.8, and rAAVrh.10 at P0 treated intravenously (IV; top panel) and intracerebroventricularly (ICV; bottom panel). (b) Early growth rate was assessed by taking weights at 2-day intervals for the first month (top panel) and at 2-week intervals up to 24 weeks (bottom panel) and plotted as a function of time. rAAV9-treated animals were shown as a representative of the serotypes. ***P = 0.002. (c) Semiquantitative neuropathology analyses were normalized to CD animals using Image J. (d) Representative T2-weighted MRI images showing water accumulation (white) in P25 CD/PBS and P60 WT and rAAV9-treated CD animals. (e) Scotopic ERGs of overnight dark-adapted WT and CD mice (n = 4 each) to test the response of rods recorded as waveforms (µV) to flashes of light in increasing intensity called steps (upper panel, a wave; lower panel, b wave). (f) Motor functions of study groups were tested at P30 and P90 based on their performance on the rotarod moving at fixed (3 rpm) and accelerated speed (4–40 rpm in 5 minutes), balance beam, and inverted screen. The experiments had a cutoff of 120 seconds for fixed rotarod and 300 seconds for accelerated rotarod. CD/PBS, CD/rAAV, CD mice treated with PBS or rAAV, respectively; Het, heterozygote; IV and ICV, intravenous and intracerebroventricular routes of delivery; MRI, magnetic resonance imaging; rAAV, recombinant adeno-associated viruses; WT, wild-type.
Figure 2
Figure 2
Physiological impacts of aspartoacylase (AspA) deficiency in peripheral tissues in addition to CNS pathology in CD mice. (a) qPCR of aspartoacylase mRNA from fresh tissue homogenates from WT at P30 (n = 4) showing extensive expression normalized to GAPDH. (b) Ratio of the weight of peripheral organs normalized to body weight of the WT or CD animals (n = 4) from which the tissues were collected. (c) Complete differential count of blood for CD and WT mice (n = 4). Data normalized to WT animals. (d) Serum of CD and WT mice (n = 5) was tested for various biochemical markers. Data normalized to WT animals. (e) Electron microscopy sections of nerves in order of relative size (optic, vagus, and sciatic) of WT and CD mice reveal abnormalities in CD mice (arrows). Scale bar, 200 nm. CD, untreated CD; CNS, central nervous system; WT, wild-type.
Figure 3
Figure 3
Peripheral organs reveal abnormalities in morphology and functions contributing to additional pathology in CD mice. (a) Representative images from H&E-stained paraffin sections showing increased lumen size (arrow; left panel) (n = 4) and electron microscopy of the renal cortex and medulla of P21 age-matched mice showing vacuolated distal tubules, disrupted filtration membrane, and lysed organelles in the proximal tubules (arrows; n = 3 for each cohort) (right panel). (b) Quantitation of the heart wall thickness using Image J of H&E-stained sections (left panel; three sections at different levels each for n = 3 animals per cohort) and quantitation of heart rate of WT and CD mice (n = 4) at P27 via electrocardiography (ECG) showing evidence of bradycardia (right). (c) Representative H&E-stained sections through perinatal developmental ages showing increased density of nuclei in muscle fibers of the tibialis anterior (TA) muscle in CD animals over WT animals (arrows; n = 3). (d) Neuromuscular junction terminals of the TA muscle visualized by staining neurofilament (green) and bungarotoxin (red) show several collapsed NMJs in CD mice compared to WT animals (n = 3). Scale bars, 20 μm. (e) Electron microscopy of different layers of the retina in P21 age-matched mice (n = 3 for WT and CD mice) showing morphological changes in several layers including, but not limited to, shrinkage of cells, accumulation of vacuoles, and disintegration of the matrix (arrows). (f) Representative images from H&E-stained paraffin sections for spleen of WT and CD mice revealing a smaller white pulp in CD mice (dotted line). (g) Splenocyte proliferation assay using the CFSE dye in CD versus WT mice (n = 3 for CD and WT mice). The x axis is the fluorescence intensity on a log10 scale. The colored lines represent individual technical replicates. Three replicates were performed for every mouse. (h) Quantification of immune cell types in the spleen of WT and CD mice using FACS (n = 3 mice). CD, untreated CD; CFSE, carboxyfluorescein succinimidyl ester; FACS, fluorescence activated cell sorting; NMJ, neuromuscular junction; TCR, T-cell receptor; WT, wild-type.
Figure 4
Figure 4
Role of NAA-induced inflammation in contributing to CD pathology. (a) Representative images of avidin–biotin complex (ABC)-stained brain sections for CD45 (n = 3) for both WT and CD animals. Brown indicates activated microglia. (b) qPCR for AspA and the inflammatory IL6 gene in macrophages isolated from the bone marrow of P18 WT mice treated with indicated amounts of NAA (n = 3). (c) qPCR of inflammatory TNF-α in bone marrow-derived macrophage cultures of P18 WT and CD mice treated with different doses of NAA. CD mice start to show disease symptoms post P18. (d) qPCR of AspA and inflammatory genes GATA6, TNF-α in WT and CD mouse brains. CD, untreated CD; NAA, N-acetyl aspartic acid; WT, wild-type.
Figure 5
Figure 5
Contribution of different neural cells types to CD pathology. (a) Representative images of EM sections of Hb9-GFP+ motor neurons alone and added to WT or CD oligodendrocytes for coculture in the presence of 25 mmol/l NAA to simulate diseased conditions showing devastation of cells. Scale bars = 200 nm. (b) Slices of WT and CD mouse brains were stained for cleaved caspase 3 (green) for apoptosis activation, IbaI (red) for activated microglia and DAPI (blue) for nuclei, reveal an increase in apoptosis in CD mice (correlated with the presence of cleaved caspase 3). Scale bars = 20 μm. (c) qPCR shows a decrease in mRNA expression of Bcl2 in untreated CD mice brains normalized to β-actin levels. (d) Cortical brain slices of CD mice were stained for activated microglia and the numbers were normalized relative to WT mice. (e) Electron microscopy of mitochondria on primary cultures of hippocampal neurons and oligodendrocytes reveal abnormal mitochondrial morphology in neurons and oligodendrocytes (arrows). Scale bars = 200 nm. (f) Primary cultures of hippocampal neurons and oligodendrocytes were stained for NeuN or MBP (green) and aspartoacylase (AspA) A (red) to determine localization. Scale bars = 50 µm. NAA, N-acetyl aspartic acid; WT, wild-type.

References

    1. Traeger, EC and Rapin, I (1998). The clinical course of Canavan disease. Pediatr Neurol 18: 207–212. - PubMed
    1. Kaul, R, Gao, GP, Balamurugan, K and Matalon, R (1993). Cloning of the human aspartoacylase cDNA and a common missense mutation in Canavan disease. Nat Genet 5: 118–123. - PubMed
    1. Matalon, R, Michals, K, Sebesta, D, Deanching, M, Gashkoff, P and Casanova, J (1988). Aspartoacylase deficiency and N-acetylaspartic aciduria in patients with Canavan disease. Am J Med Genet 29: 463–471. - PubMed
    1. Birnbaum, SM, Levintow, L, Kingsley, RB and Greenstein, JP (1952). Specificity of amino acid acylases. J Biol Chem 194: 455–470. - PubMed
    1. Mehta, V and Namboodiri, MA (1995). N-acetylaspartate as an acetyl source in the nervous system. Brain Res Mol Brain Res 31: 151–157. - PubMed

Publication types