. 2016 Apr 21;165(3):551-65.
doi: 10.1016/j.cell.2016.03.008. Epub 2016 Mar 31.

Personalized Immunomonitoring Uncovers Molecular Networks that Stratify Lupus Patients

Affiliations

Personalized Immunomonitoring Uncovers Molecular Networks that Stratify Lupus Patients

Romain Banchereau et al. Cell. .

Erratum in

  • Personalized Immunomonitoring Uncovers Molecular Networks that Stratify Lupus Patients.
    Banchereau R, Hong S, Cantarel B, Baldwin N, Baisch J, Edens M, Cepika AM, Acs P, Turner J, Anguiano E, Vinod P, Khan S, Obermoser G, Blankenship D, Wakeland E, Nassi L, Gotte A, Punaro M, Liu YJ, Banchereau J, Rossello-Urgell J, Wright T, Pascual V. Banchereau R, et al. Cell. 2016 Jun 2;165(6):1548-1550. doi: 10.1016/j.cell.2016.05.057. Cell. 2016. PMID: 27259156 No abstract available.

Abstract

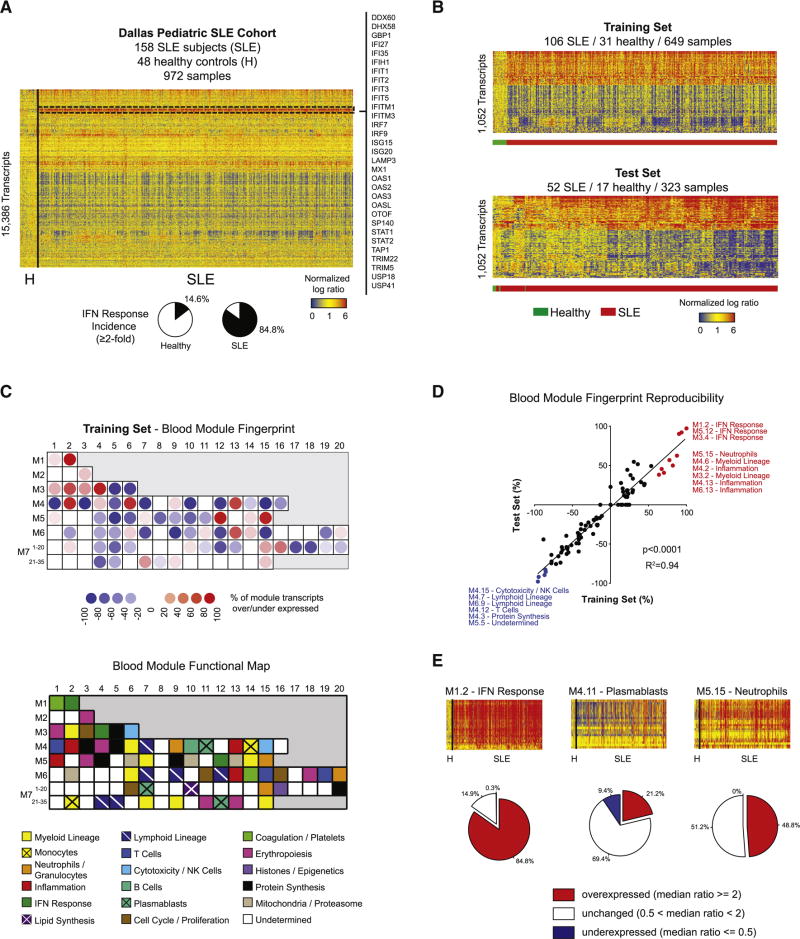
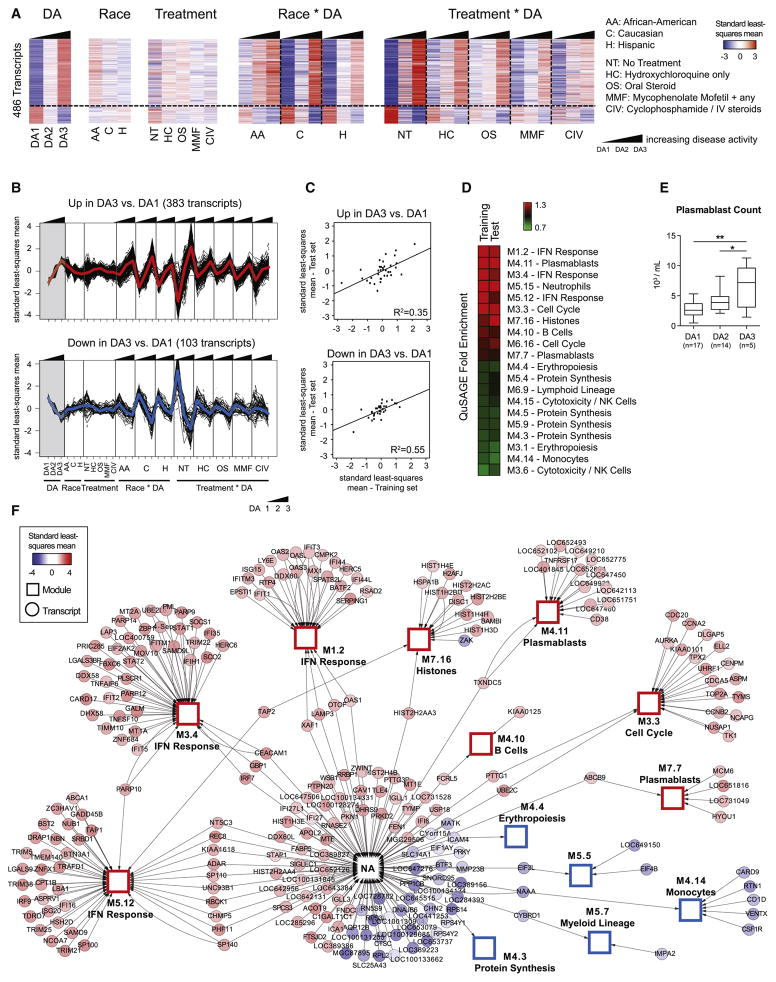
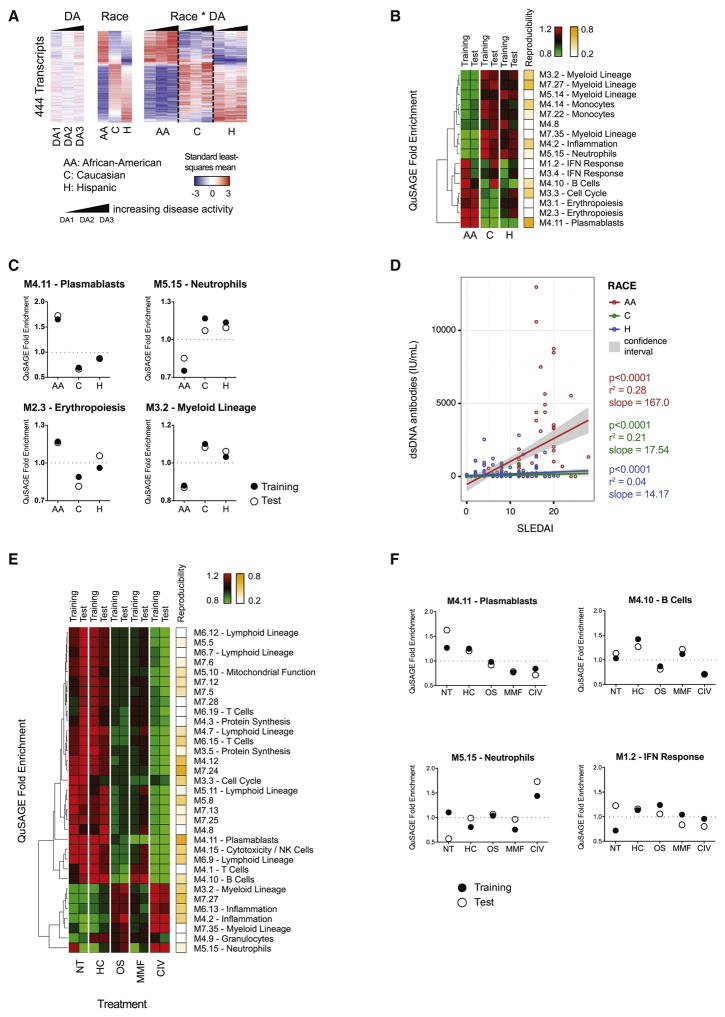
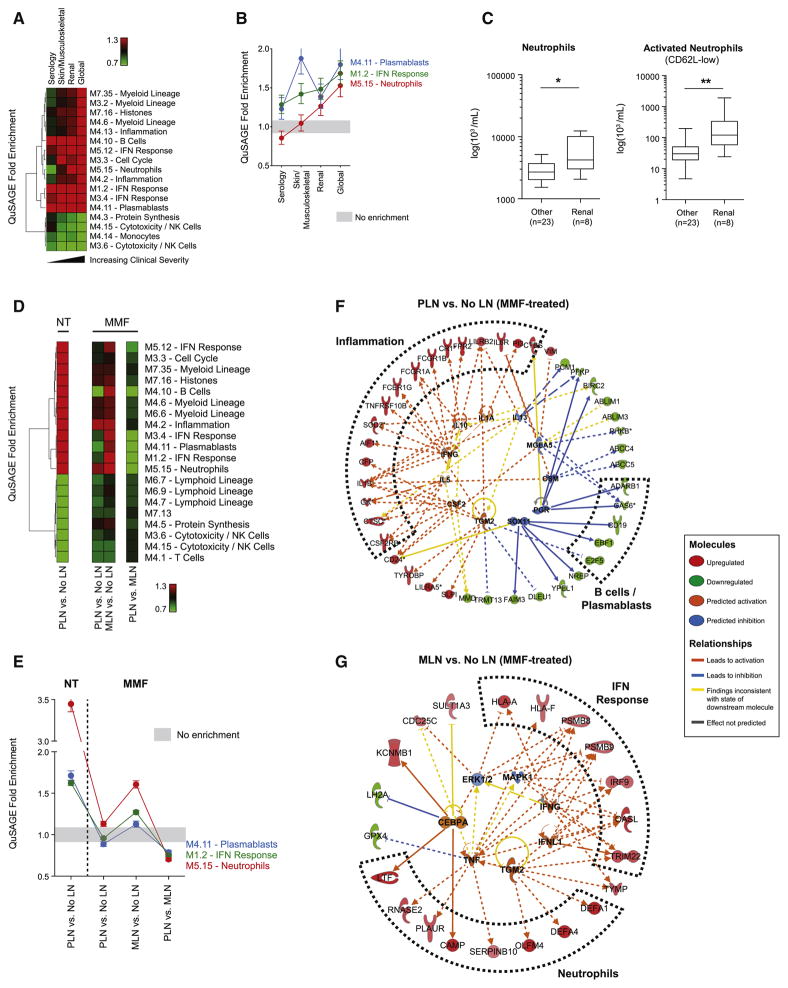
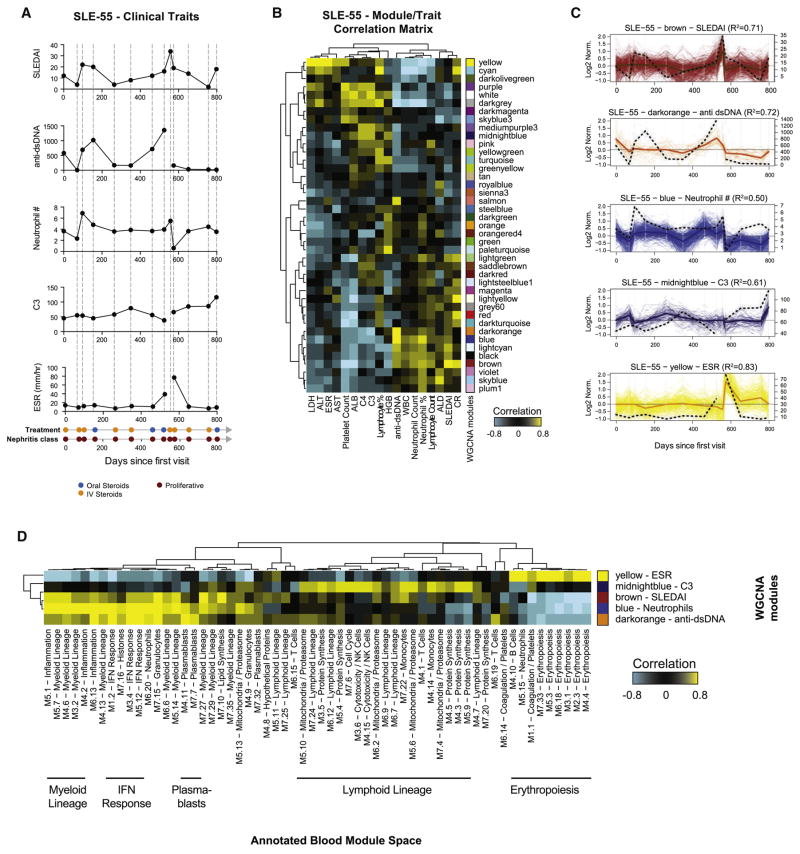
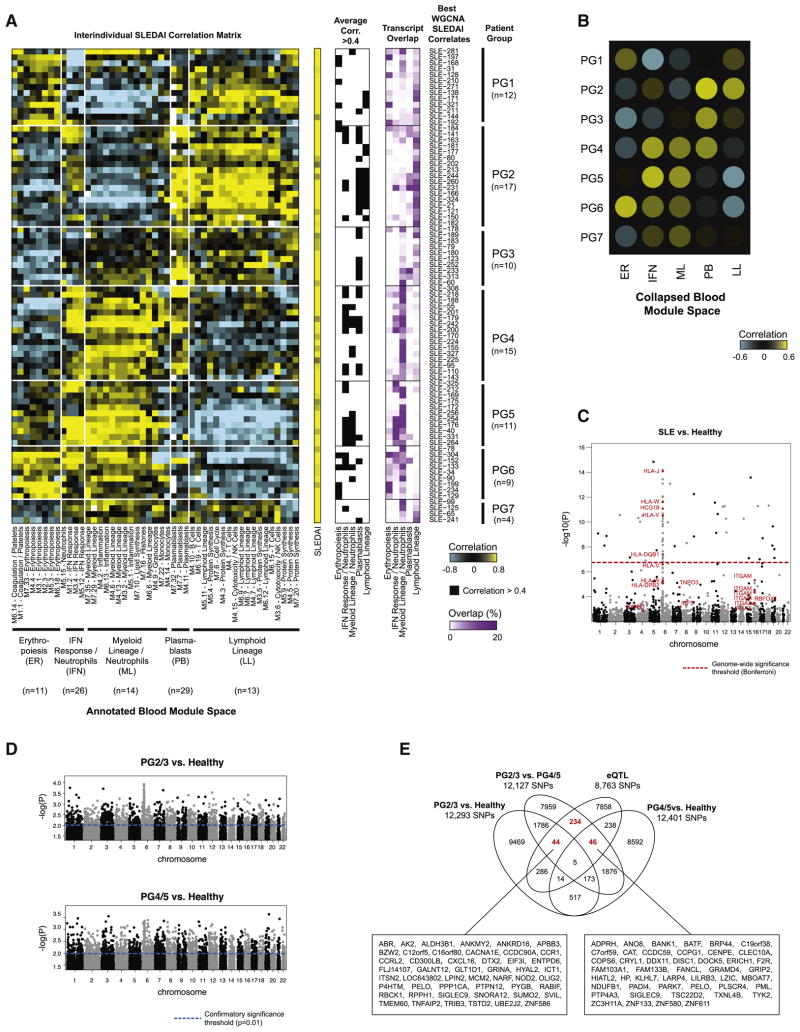
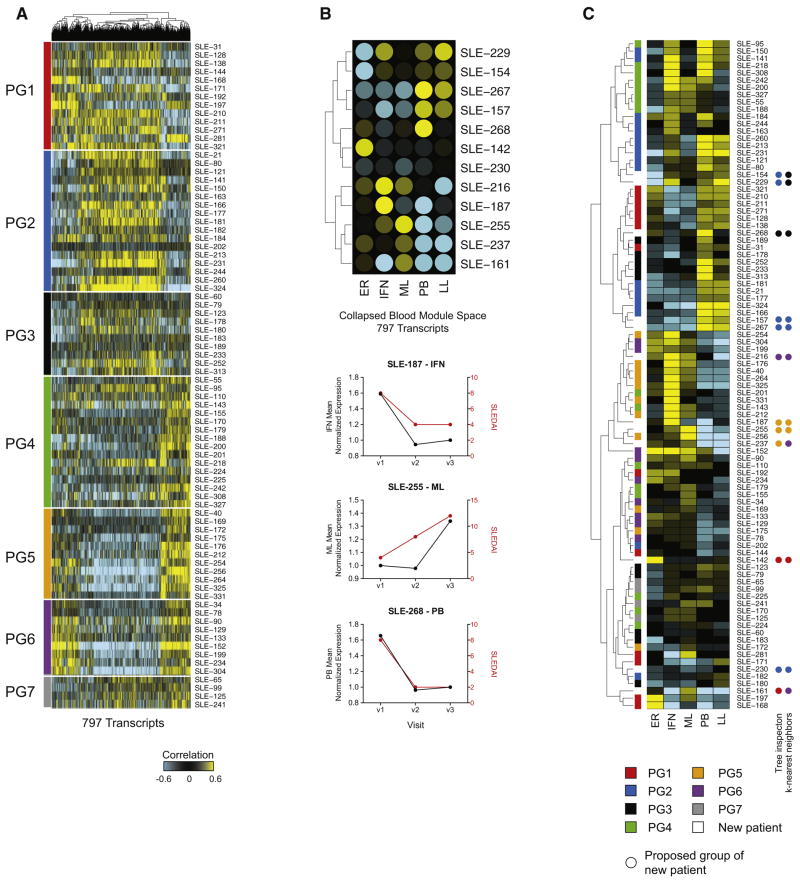
Systemic lupus erythematosus (SLE) is an autoimmune disease characterized by loss of tolerance to nucleic acids and highly diverse clinical manifestations. To assess its molecular heterogeneity, we longitudinally profiled the blood transcriptome of 158 pediatric patients. Using mixed models accounting for repeated measurements, demographics, treatment, disease activity (DA), and nephritis class, we confirmed a prevalent IFN signature and identified a plasmablast signature as the most robust biomarker of DA. We detected gradual enrichment of neutrophil transcripts during progression to active nephritis and distinct signatures in response to treatment in different nephritis subclasses. Importantly, personalized immunomonitoring uncovered individual correlates of disease activity that enabled patient stratification into seven groups, supported by patient genotypes. Our study uncovers the molecular heterogeneity of SLE and provides an explanation for the failure of clinical trials. This approach may improve trial design and implementation of tailored therapies in genetically and clinically complex autoimmune diseases. PAPERCLIP.


Figures

Figure 1
Figure 1. The SLE blood transcriptional fingerprint
A. Hierarchical clustering of the 15,386 transcripts detected across the 972 samples composing the Dallas pediatric SLE cohort. The IFN response is highlighted in the dashed rectangle, and representative transcripts are listed. B. Heatmap representing the 1,052 DETs between healthy and SLE in the training (upper panel) and test (lower panel) sets. C. Upper panel: Blood module fingerprint of SLE in the training set. Lower panel: Blood modules functional annotation key. D. Linear regression of blood module expression in the training (x-axis) and test (y-axis) sets. E. Frequency of over/under-expression of IFN, plasmablast and neutrophil signatures in SLE samples. See also Figure S1.
Figure 2
Figure 2. Transcriptional correlates of disease activity
A. Hierarchical clustering of the 486 DETs between DA3 and DA1, organized by DA, race, treatment and interaction terms. B. Line charts displaying the transcripts over- (upper panel) or under- (lower panel) expressed in DA3 vs. DA1. C. Linear regressions between training and test sets for over- and under-expressed transcripts. D. Heatmap representing the QuSAGE fold enrichment for these transcripts using blood modules as gene sets. E. Box plots representing the absolute count of circulating plasmablasts by FACS in a subset of patients, grouped by DA level. Plasmablast counts were found significantly different in DA3 vs. DA1 (p=0.0069) and DA3 vs. DA2 (p=0.045) by a mixed model that adjusted for age and treatment (*: p<0.05; **: p<0.01). F. Cytoscape network displaying the connectivity of DETs in DA3 vs. DA1 with blood modules, which are represented as hubs (squares). Genes not connected to a blood module are linked to the “NA” hub. Nodes are colored by the standard least-squares mean expression of the transcript in DA3. See also Figure S2.
Figure 3
Figure 3. Influence of race and treatment on the SLE blood transcriptional fingerprint
A. Hierarchical clustering of the 444 DETs between the three race groups, organized by DA, race, treatment and interaction terms. B. Heatmap representing the QuSAGE fold enrichment of each group using blood modules as gene sets. The reproducibility of each module between training and test sets is displayed on the right. C. Dot plots representing the QuSAGE fold enrichment for four modules from B, with training and test set results combined. D. X-Y plot representing the linear regressions of SLEDAI vs. anti-dsDNA antibody titers by race group. E. Heatmap representing the QuSAGE fold enrichment for each treatment group versus others combined. Reproducibility between training and test sets is also displayed. F. Dot plots representing the QuSAGE fold enrichment for neutrophil, B cell, plasmablast and IFN modules. See also Figure S3.
Figure 4
Figure 4. A neutrophil signature associates with lupus nephritis
A. Heatmap representing the QuSAGE fold enrichment for each SLEDAI component group as compared to None. B. Line chart of the QuSAGE fold enrichment for IFN response, plasmablast and neutrophil modules. Whiskers represent the 95% confidence intervals. C. Box plots representing the absolute counts of bulk (left panel) and activated CD62L-low (right panel) neutrophils by FACS in a subset of patients with (n=8) or without (n=23) active LN. (*: p<0.05; **: p<0.01). Data were adjusted for age through a mixed model. Whiskers represent the minimum and maximum values. D. Heatmap representing the QuSAGE fold enrichment for PLN and MLN either compared to no nephritis (No LN) or directly to each other, with (MMF) or without (NT) treatment. E. Line chart representing the QuSAGE fold enrichment for IFN response, plasmablast and neutrophil modules across the four comparisons. Whiskers represent the 95% confidence intervals. F–G. Ingenuity Pathway Analysis (IPA) networks of DETs from the estimates of PLN vs. no LN and MLN vs. no LN treated with MMF. DETs are represented on the outer circle and colored by fold change (red: overexpressed; green: underexpressed). Predicted upstream and downstream regulators (absolute z-score > 1) are represented on the inner circle.
Figure 5
Figure 5. Individual immunomonitoring by WGNCA
A. Clinical summary for patient SLE-55. SLEDAI, anti-dsDNA antibody titers, neutrophil count, C3 and ESR are displayed as line charts as a function of days since the first visit (x-axis). Treatment and nephritis class are also displayed. B. Hierarchical clustering of the module/trait correlation matrix for SLE-55. C. Line charts representing the modules that best correlate with SLEDAI, anti-dsDNA antibody titers, neutrophil count, C3 and ESR. The profile of the clinical trait is overlaid on the plot and represented as an interrupted black line. D. Hierarchical clustering of the correlation matrix between WGCNA and blood module eigengenes for SLE-155. See also Figure S4.
Figure 6
Figure 6. Stratification of SLE patients based on transcriptional correlates of SLEDAI
A. Left panel: hierarchical clustering of the interindividual correlation matrix between the SLEDAI WGCNA modules for 80 patients (rows) and blood modules (columns). Center panel: correlation of blood modules averaged by immune group for each SLEDAI WGCNA module. A black square indicates a correlation ≥0.4. Right panel: transcript overlap between each WGCNA module and the combined list of blood module transcripts from the five groups (PG: patient group). B. Summary heatmap of patient stratification based on SLEDAI correlates. (ER: erythropoiesis; IFN: IFN response/neutrophils; ML: myeloid lineage/neutrophils; PB: plasmablasts; LL: lymphoid lineage). C–D. Manhattan plots representing the results from the comparative SNP analysis between SLE (n=80), PG2/3 (n=27) or PG4/5 (n=26) and healthy controls. Loci related to genes previously associated with SLE are highlighted in red. E. Venn diagram of overlapping SNPs between PG2/3 vs. healthy, PG4/5 vs. healthy, PG2/3 vs. PG4/5 and eQTLs (p<0.05). Genes in cis with these SNPs are displayed in boxes for relevant lists. See also Figure S6 and Tables S2, S3 and S4.
Figure 7
Figure 7. A targeted panel for SLE patient stratification
A. Hierarchical clustering of the 797 transcripts differentially correlating with SLEDAI between the seven patient groups. B. Upper panel: summary heatmap of immune signatures correlating with the SLEDAI of 12 independent patients with three to four visits. Lower panel: Linecharts representing the mean normalized expression of immune signatures (left Y-axis) and SLEDAI (right Y-axis) for three representative patients. C. Hierarchical cluster of the 92 SLE patients considered, according to individual SLEDAI correlation profile in the collapsed blood module space. Patients are colored by PG classification. PG assignment of the 12 new patients is highlighted by colored dots. See also Table S5.

Comment in

Similar articles

Cited by

References

    1. Arbuckle MR, McClain MT, Rubertone MV, Scofield RH, Dennis GJ, James JA, Harley JB. Development of autoantibodies before the clinical onset of systemic lupus erythematosus. The New England journal of medicine. 2003;349:1526–1533. - PubMed
    1. Baechler EC, Batliwalla FM, Karypis G, Gaffney PM, Ortmann WA, Espe KJ, Shark KB, Grande WJ, Hughes KM, Kapur V, et al. Interferon-inducible gene expression signature in peripheral blood cells of patients with severe lupus. Proceedings of the National Academy of Sciences of the United States of America. 2003;100:2610–2615. - PMC - PubMed
    1. Bennett L, Palucka AK, Arce E, Cantrell V, Borvak J, Banchereau J, Pascual V. Interferon and granulopoiesis signatures in systemic lupus erythematosus blood. The Journal of experimental medicine. 2003;197:711–723. - PMC - PubMed
    1. Bentham J, Morris DL, Cunninghame Graham DS, Pinder CL, Tombleson P, Behrens TW, Martin J, Fairfax BP, Knight JC, Chen L, et al. Genetic association analyses implicate aberrant regulation of innate and adaptive immunity genes in the pathogenesis of systemic lupus erythematosus. Nature genetics 2015 - PMC - PubMed
    1. Bernatsky S, Boivin JF, Joseph L, Manzi S, Ginzler E, Gladman DD, Urowitz M, Fortin PR, Petri M, Barr S, et al. Mortality in systemic lupus erythematosus. Arthritis and rheumatism. 2006;54:2550–2557. - PubMed

Associated data