. 2016 Apr 21;165(3):742-53.
doi: 10.1016/j.cell.2016.03.007. Epub 2016 Mar 31.

TRIBE: Hijacking an RNA-Editing Enzyme to Identify Cell-Specific Targets of RNA-Binding Proteins

Affiliations

TRIBE: Hijacking an RNA-Editing Enzyme to Identify Cell-Specific Targets of RNA-Binding Proteins

Aoife C McMahon et al. Cell. .

Abstract

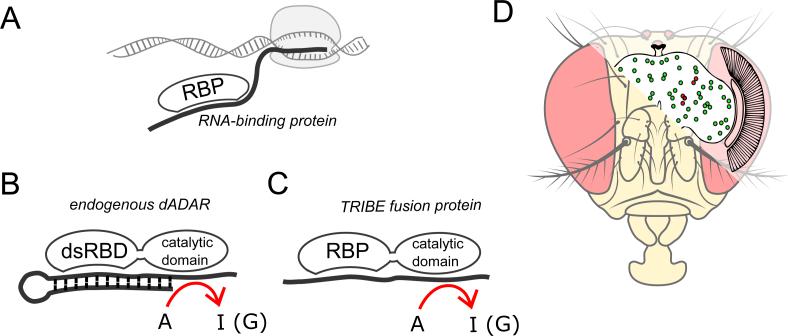
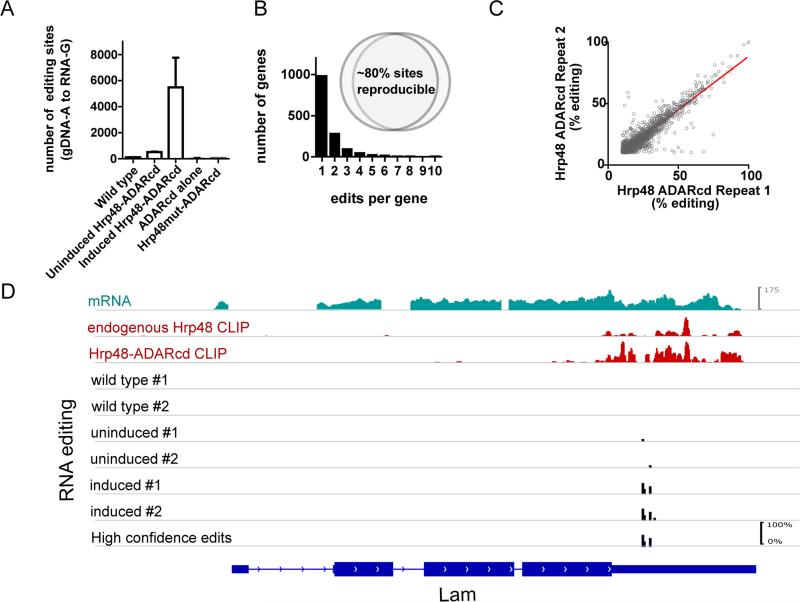
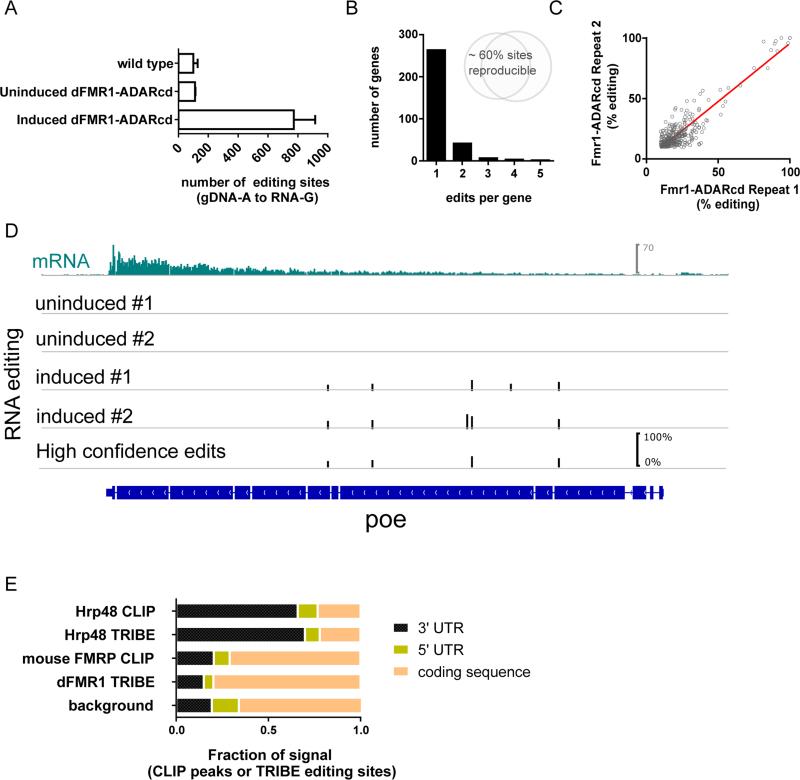
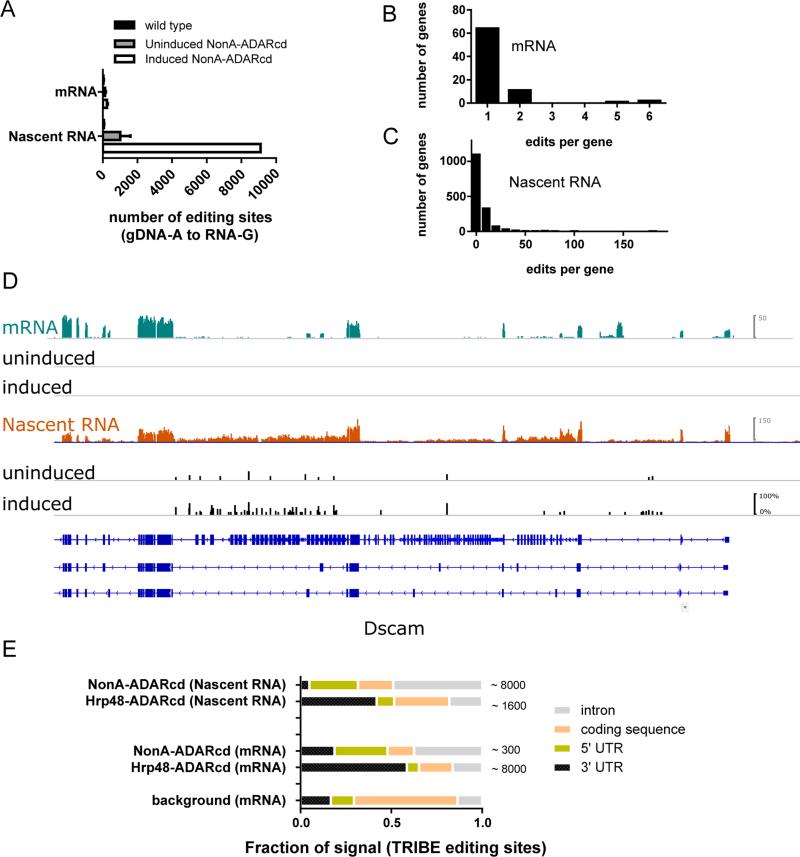
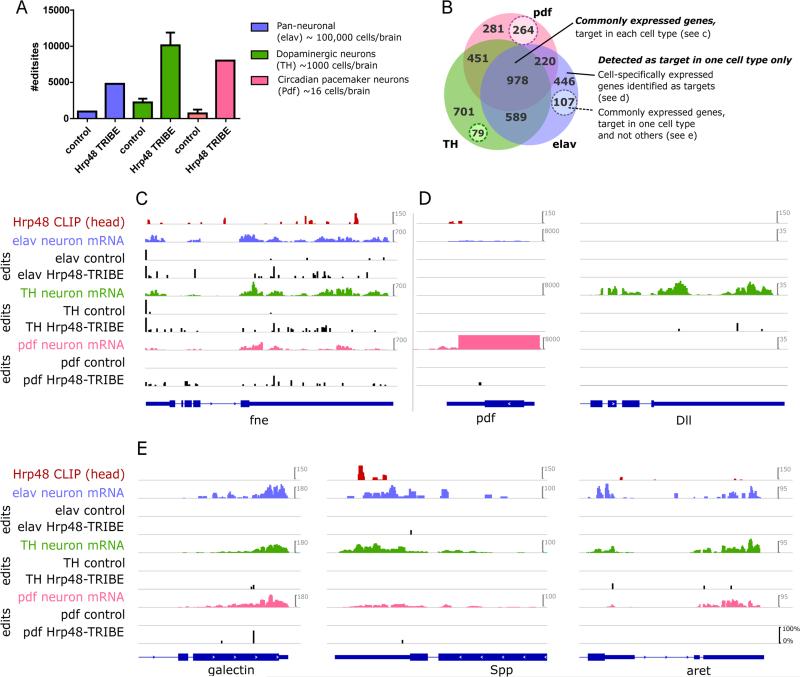
RNA transcripts are bound and regulated by RNA-binding proteins (RBPs). Current methods for identifying in vivo targets of an RBP are imperfect and not amenable to examining small numbers of cells. To address these issues, we developed TRIBE (targets of RNA-binding proteins identified by editing), a technique that couples an RBP to the catalytic domain of the Drosophila RNA-editing enzyme ADAR and expresses the fusion protein in vivo. RBP targets are marked with novel RNA editing events and identified by sequencing RNA. We have used TRIBE to identify the targets of three RBPs (Hrp48, dFMR1, and NonA). TRIBE compares favorably to other methods, including CLIP, and we have identified RBP targets from as little as 150 specific fly neurons. TRIBE can be performed without an antibody and in small numbers of specific cells.


Figures

Figure 1
Figure 1. Targets of RNA-binding proteins Identified By Editing (TRIBE): A fusion protein of an RNA-binding protein and the catalytic domain of ADAR will edit the target transcripts of the RNA-binding protein
A) The aim of this technique is to identify the binding target transcripts of a specific RNA-binding protein (RBP). B) Native Drosophila ADAR is composed of two double stranded RNA-binding domains (dsRBDs) that mediates its target specificity, and a deaminase domain that catalyzes adenosine to inosine conversion. C) The dsRBDs of ADAR are replaced with the RBP of interest. The editing specificity of the fusion protein is determined by the RNA recognition features of the RBP and the target transcript is permanently marked by a novel editing event. D) Cell-specific expression of the fusion protein will allow identification of targets in discrete populations of cells in vivo. Co-expression of a fluorescent protein allows for enrichment of RNA from the cells of interest. Examples of Drosophila neuronal subsets examined here are the core circadian pacemaker neurons (pdf expressing, ~ 16 cell/brain (red)) and dopaminergic neurons (tyrosine hydroxylase expressing, ~1000 cells/brain (green)).
Figure 2
Figure 2. The TRIBE fusion protein reproducibly edits certain sites
(A) An increase in A to G editing events is observed upon induction of the fusion protein in S2 cells. No increase in editing sites are observed when an ADAR catalytic domain alone is expressed, or when Hrp48mut-ADARcd (Hrp48 with mutated RNA-binding domains). The same genes and the same sites are reproducibly edited across biological replicates at similar efficiencies (B inset, C). A frequency histogram of number of edits per target genes show that most genes have only one editing site but the TRIBE protein has strong specificity for certain sites (B), and that those sites are edited to a similar degree between biological repeats (R2 = 0.859). D) Endogenous and fusion protein have similar binding patterns and TRIBE editing reflects the pattern of the CLIP signal. An example gene, Lam, showing mRNA expression and CLIP signal (top three panels), and editing tracks for wild type cells, stable cells lines (Hrp48-TRIBE) without and with induction of expression of the fusion protein. Editing events are indicated by black bars, the height of the bar indicates the percentage editing at that site. See also Figure S1, and Tables S1, S2 and S5
Figure 3
Figure 3. TRIBE demonstrates Hrp48 preferentially binds the 3’ UTR of transcripts
A) Both CLIP signal and editing sites are enriched in the 3'UTR. Metagene quantification of the location of either CLIP peaks or TRIBE edits. Background indicates the proportion of the fly transcriptome composed of the indicated regions. The majority of TRIBE editing sites are near CLIP peaks (B). The fraction of editing sites within a certain distance of a CLIP peak was quantified for both endogenous Hrp48 and Hrp48-TRIBE. 0 indicates that the editing site was within the bounds of a CLIP peak. C) TRIBE targets are a subset of CLIP targets. Venn diagram overlap of genes between all expressed genes, all TRIBE target genes and all genes with at least one statistically significant CLIP peak. D) TRIBE targets are more CLIP enriched. Frequency distribution of per gene CLIP enrichments of all CLIP target genes and TRIBE genes that have CLIP signal. The overlap between the top 25% ranked CLIP targets (highlighted in pink) and TRIBE targets is inset. See also Figures S2, S3, and S7, and Tables S1, S2 and S5
Figure 4
Figure 4. TRIBE demonstrates dFMR1 preferentially binds the coding sequence of transcripts
A) The dFMR1-TRIBE protein retains deaminase activity, an increase in A to G editing events is observed upon induction of the fusion protein in S2 cells. The same genes and the same sites are reproducibly edited across biological replicates at similar efficiencies (B,C). A frequency histogram of number of edits per target genes show that most genes have only one editing site but the TRIBE protein has strong specificity for certain sites (B), and that those sites are edited to a similar degree between biological repeats (R2 = 0.86) (C). D) An example gene, poe, showing mRNA expression (top panel), and editing tracks for stable cells lines (dFMR1-TRIBE) without and with induction of expression of the fusion protein. Editing events are indicated by black bars, the height of the bar indicates the percentage editing at that site. E) Metagene quantification of the location of either CLIP peaks or TRIBE edits. Background indicates the proportion of the fly transcriptome composed of the indicated regions. Intronic sites are excluded from the analysis here to allow direct comparison to mouse FMRP CLIP data from Darnell et al. (2011). See also Figure S4, and Tables S1, S2 and S5
Figure 5
Figure 5. TRIBE demonstrates NonA preferentially binds the introns of transcripts
The NonA-TRIBE protein retains deaminase activity, (A) an increase in A to G editing events is observed upon induction of the fusion protein in S2 cells. NonA TRIBE induces very few sites in mRNA but many sites are present in nascently transcribed RNA. B,C) Frequency histograms of number of edits per target genes show that most genes have only one editing site in mRNA, but in nascent RNA many genes have many more edits (median=2, 75th percentile=6, maximum=181 edits per gene). D) An example gene, Dscam, showing mRNA (top) and nascent RNA (middle) expression and editing tracks without and with induction of expression of the fusion protein. Editing events are indicated by black bars, the height of the bar indicates the percentage editing at that site. The full annotation of Dscam is shown above two example splice variants likely expressed in these S2 cells (bottom). E) Metagene quantification of the location of TRIBE edits (NonA-TRIBE and Hrp48-TRIBE) in both mRNA and nascent RNA. Total number of editing sites are marked next to bars. Background indicates the proportion of the fly transcriptome composed of the indicated regions. See also Figure S5, S6 and S7, and Tables S1, S2 and S5
Figure 6
Figure 6. Hrp48-TRIBE can identify RBP targets in specific subsets of cells
A) The number of editing sites detected in RNA isolated from specific subsets of neurons expressing the Hrp48-TRIBE protein (bars labelled TRIBE) is significantly greater than the background number of endogenous editing sites (bars labelled control). Cell types examined were the core circadian pdf neuropeptide expressing cells (pdf-Gal4), dopaminergic neurons (TH-Gal4) and generic neurons (elav-Gal4). B) Venn diagram of the genes that are identified as Hrp48 targets by TRIBE in different cell types. Example genes from three categories of targets are shown 3 in (C,D,E). C) Many commonly expressed genes are identified as targets in each of the three cell types. D, E) Some genes are identified as targets in only one (or a combination of two) cell types. D) Genes that are expressed only in certain cell types are identified as targets and (E) commonly expressed genes may be identified as a target in one cell type and not the others (dashed insets in B). Note that ‘expression’ here is classified as sufficient sequencing depth at the editing site location, and as such the numbers of cell-specifically expressed genes are likely an overestimation. (C,D,E) Tracks shown are; RNA-seq and Hrp48 CLIP from whole fly heads, RNA-seq and Hrp48-TRIBE editing tracks from indicated isolated neuron subtype, either GFP expressing control (labelled pdf, TH, elav) or Hrp48-TRIBE expressing cells (labelled pdf, TH, elav-TRIBE). Editing events are indicated by black bars, and the height of the bar indicates the percentage editing at that site. The scale for mRNA-seq is constant for each gene, resulting in truncation of signal of pdf in pdf cells. See also Tables S1, S2 and S5.
Figure 7
Figure 7. Identification of dFMR1 targets in excitatory and inhibitory neurons
(A) The number of editing sites detected in RNA isolated from specific subsets of neurons expressing the dFMR1-TRIBE protein (bars labelled TRIBE) is greater than the background number of endogenous editing sites (bars labelled control). Cell types examined were excitatory neurons (cholinergic; Cha-Gal4) and inhibitory neurons (GABA-ergic; GAD-Gal4). (B) Frequency histograms of number of edits per target genes. (C) Venn diagram of the genes that are identified as dFMR1 targets by TRIBE in different cell types. Target editing sites that have sufficient sequencing depth in both cell types are outlined with a dashed line. (D-F) Example genes are shown. (E) Many commonly expressed genes are identified as targets in each of the both cell types, and some genes (D and F) are identified as targets in either one or the other cell type, despite being expressed in both. Tracks shown are; RNA-seq and dFMR1-ADARcd TRIBE editing tracks from the indicated isolated neuron subtype, either GFP expressing control or dFMR1-ADARcd expressing cells. Editing events are indicated by black bars, and the height of the bar indicates the percentage editing at that site. See also Figure S4 and Tables S1, S2 and S5.

References

    1. Abruzzi K, Chen X, Nagoshi E, Zadina A, Rosbash M. RNA-seq profiling of small numbers of Drosophila neurons. Methods in enzymology. 2015;551:369–386. - PubMed
    1. Ascano M, Jr., Mukherjee N, Bandaru P, Miller JB, Nusbaum JD, Corcoran DL, Langlois C, Munschauer M, Dewell S, Hafner M, Williams Z, Ohler U, Tuschl T. FMRP targets distinct mRNA sequence elements to regulate protein expression. Nature. 2012;492:382–386. - PMC - PubMed
    1. Bashirullah A, Halsell SR, Cooperstock RL, Kloc M, Karaiskakis A, Fisher WW, Fu W, Hamilton JK, Etkin LD, Lipshitz HD. Joint action of two RNA degradation pathways controls the timing of maternal transcript elimination at the midblastula transition in Drosophila melanogaster. The EMBO journal. 1999;18:2610–2620. - PMC - PubMed
    1. Bass BL, Weintraub H. An unwinding activity that covalently modifies its double-stranded RNA substrate. Cell. 1988;55:1089–1098. - PubMed
    1. Blanchette M, Green RE, Brenner SE, Rio DC. Global analysis of positive and negative pre-mRNA splicing regulators in Drosophila. Genes & development. 2005;19:1306–1314. - PMC - PubMed

Publication types

MeSH terms