

Obesity-initiated metabolic syndrome promotes urinary voiding dysfunction in a mouse model
- PMID: 27040645
- PMCID: PMC4946024
- DOI: 10.1002/pros.23185
Obesity-initiated metabolic syndrome promotes urinary voiding dysfunction in a mouse model
Abstract
Objective: Accumulating evidences suggests that obesity and metabolic syndrome (MetS) contribute towards lower urinary tract symptoms (LUTS) through alterations in the phenotype of bladder and prostate gland. Clinical studies indicate a link between MetS and LUTS. Nevertheless, there is lack of suitable animal model(s) which could illustrate an association linking obesity to LUTS. We examined the lower urinary tract function in an obesity-initiated MetS mouse model.
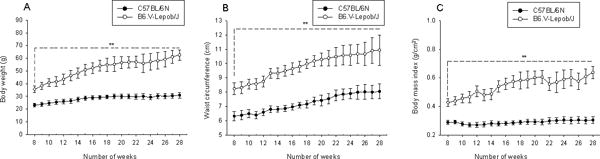
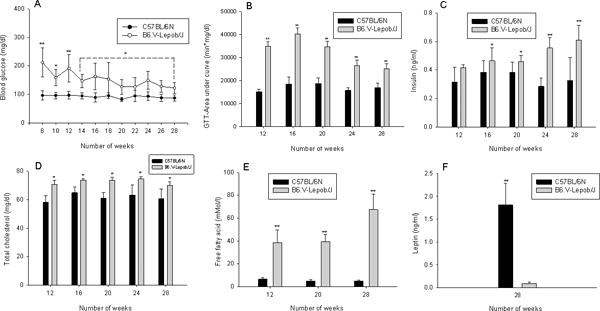
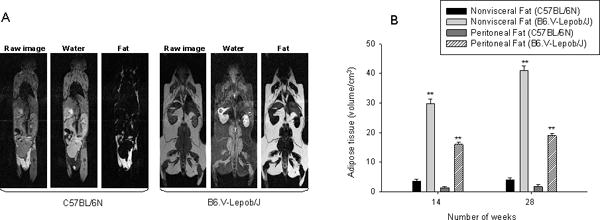
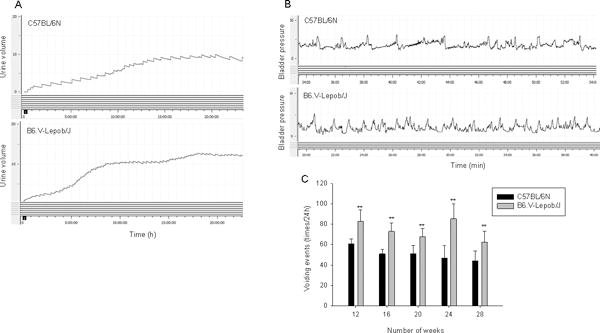
Methods: Male C57BL/6N wild-type and obese B6.V-Lepob/J maintained on regular diet for 28 weeks were subjected to the assessment of body weight (BW), body length (BL), waist circumference (WC), body mass index (BMI), blood glucose (BG), plasma insulin (INS), plasma leptin (LEP), total cholesterol (CHO), free fatty acid (FFA), and measurement of urinary functions. Whole animal peritoneal and subcutaneous adipose tissue measurements as well as prostate and bladder volumes were analyzed by MRI followed by histological evaluation. These parameters were used to draw correlations between MetS and LUTS.
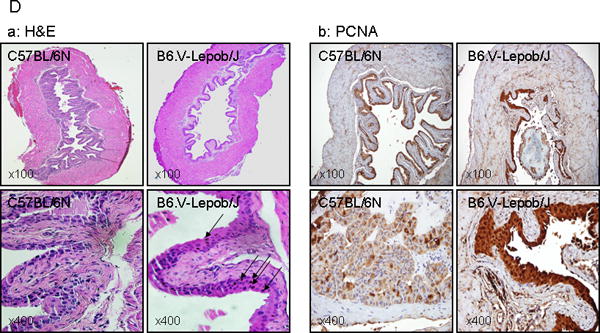
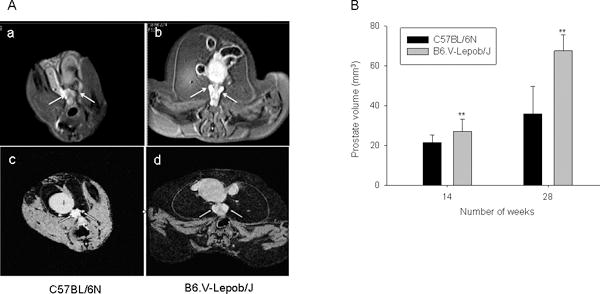
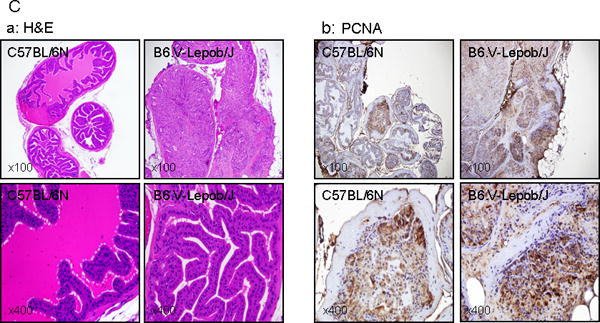
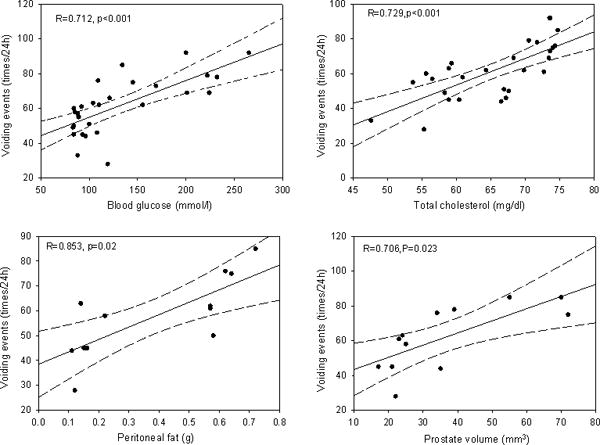
Results: Obesity parameters such as BW, WC, and BMI were significantly higher in B6.V-Lepob/J mice compared to C57BL/6N mice (P < 0.01). Higher levels of total CHO and FFA were noted in B6.V-Lepob/J mice than C57BL/6N mice (P < 0.05). These results were concurrent with frequency, lower average urine volume and other urinary voiding dysfunctions in B6.V-Lepob/J mice. MRI assessments demonstrate marked increase in body fat and prostate volume in these mice. Compared to C57BL/6N mice, histological analysis of the prostate from B6.V-Lepob/J mice showed increased proliferation, gland crowding, and infiltration of immune cells in the stroma; whereas the bladder urothelium was slightly thicker and appears more proliferative in these mice. The regression and correlation analysis indicate that peritoneal fat (R = 0.853; P < 0.02), CHO (R = 0.729; P < 0.001), BG (R = 0.712; P < 0.001) and prostate volume (R = 0.706; P < 0.023) strongly correlate with LUTS whereas BMI, WC, INS, and FFA moderately correlate with the prevalence of bladder dysfunction.
Conclusion: Our results suggest that LUTS may be attributable in part to obesity and MetS. Validation of an in vivo model may lead to understand the underlying pathophysiological mechanisms of obesity-related LUTS in humans. Prostate 76:964-976, 2016. © 2016 Wiley Periodicals, Inc.
Keywords: lower urinary tract symptoms; metabolic syndrome; overactive bladder; prostate hyperplasia; urinary incontinence.
© 2016 Wiley Periodicals, Inc.
Conflict of interest statement
Figures
Similar articles
-
Metabolic syndrome and male lower urinary tract symptoms.Panminerva Med. 2022 Sep;64(3):329-336. doi: 10.23736/S0031-0808.21.04496-7. Epub 2021 Dec 3. Panminerva Med. 2022. PMID: 34859639 Review.
-
Obesity-induced diabetes and lower urinary tract fibrosis promote urinary voiding dysfunction in a mouse model.Prostate. 2013 Jul;73(10):1123-33. doi: 10.1002/pros.22662. Epub 2013 Mar 26. Prostate. 2013. PMID: 23532836 Free PMC article.
-
Central obesity as measured by waist circumference is predictive of severity of lower urinary tract symptoms.BJU Int. 2012 Aug;110(4):540-5. doi: 10.1111/j.1464-410X.2011.10819.x. Epub 2012 Jan 13. BJU Int. 2012. PMID: 22243806
-
Effect of Metabolic Syndrome on Anatomy and Function of the Lower Urinary Tract Assessed on MRI.Urology. 2022 Jan;159:176-181. doi: 10.1016/j.urology.2021.09.006. Epub 2021 Sep 24. Urology. 2022. PMID: 34571092 Free PMC article.
-
A guideline for the management of bladder dysfunction in Parkinson's disease and other gait disorders.Neurourol Urodyn. 2016 Jun;35(5):551-63. doi: 10.1002/nau.22764. Epub 2015 Mar 25. Neurourol Urodyn. 2016. PMID: 25810035 Review.
Cited by
-
The relationship between prevalence and severity of lower urinary tract symptoms (LUTS), and body mass index and mid-abdominal circumference in men in a resource-poor community in Southeast Nigeria: a cross-sectional survey.BMC Urol. 2019 Feb 21;19(1):15. doi: 10.1186/s12894-019-0444-x. BMC Urol. 2019. PMID: 30791899 Free PMC article.
-
Chronic high-fat diet decreased detrusor mitochondrial respiration and increased nerve-mediated contractions.Neurourol Urodyn. 2019 Aug;38(6):1524-1532. doi: 10.1002/nau.24015. Epub 2019 May 10. Neurourol Urodyn. 2019. PMID: 31074529 Free PMC article.
-
Longitudinal Changes in Adiposity and Lower Urinary Tract Symptoms Among Older Men.J Gerontol A Biol Sci Med Sci. 2022 Oct 6;77(10):2102-2109. doi: 10.1093/gerona/glab227. J Gerontol A Biol Sci Med Sci. 2022. PMID: 34375402 Free PMC article.
-
Methylglyoxal and Advanced Glycation End Products (AGEs): Targets for the Prevention and Treatment of Diabetes-Associated Bladder Dysfunction?Biomedicines. 2024 Apr 23;12(5):939. doi: 10.3390/biomedicines12050939. Biomedicines. 2024. PMID: 38790901 Free PMC article. Review.
-
Oxidative Stress: A Putative Link Between Lower Urinary Tract Symptoms and Aging and Major Chronic Diseases.Front Med (Lausanne). 2022 Mar 10;9:812967. doi: 10.3389/fmed.2022.812967. eCollection 2022. Front Med (Lausanne). 2022. PMID: 35360727 Free PMC article. Review.
References
-
- Alberti K, Eckel RH, Grundy SM, Zimmet PZ, Cleeman JI, Donato KA, et al. Harmonizing the Metabolic Syndrome A Joint Interim Statement of the International Diabetes Federation Task Force on Epidemiology and Prevention; National Heart, Lung, and Blood Institute; American Heart Association; World Heart Federation; International Atherosclerosis Society; and International Association for the Study of Obesity. Circulation. 2009;120(16):1640–5. - PubMed
-
- Freedland SJ, Terris MK, Presti JR, Amling CL, Kane CJ, Trock B, et al. Obesity and biochemical outcome following radical prostatectomy for organ confined disease with negative surgical margins. The Journal of urology. 2004;172(2):520–4. - PubMed
-
- Kasturi S, Russell S, McVary KT. Metabolic syndrome and lower urinary tract symptoms secondary to benign prostatic hyperplasia. Current Prostate Reports. 2006;4(3):127–31. - PubMed
-
- Ozden C, Ozdal OL, Urgancioglu G, Koyuncu H, Gokkaya S, Memis A. The correlation between metabolic syndrome and prostatic growth in patients with benign prostatic hyperplasia. European urology. 2007;51(1):199–206. - PubMed
Publication types
MeSH terms
Substances
Grants and funding
LinkOut - more resources
Full Text Sources
Other Literature Sources
Medical
Miscellaneous
