

Cryptic Amyloidogenic Elements in the 3' UTRs of Neurofilament Genes Trigger Axonal Neuropathy
- PMID: 27040688
- PMCID: PMC4833435
- DOI: 10.1016/j.ajhg.2016.02.022
Cryptic Amyloidogenic Elements in the 3' UTRs of Neurofilament Genes Trigger Axonal Neuropathy
Abstract
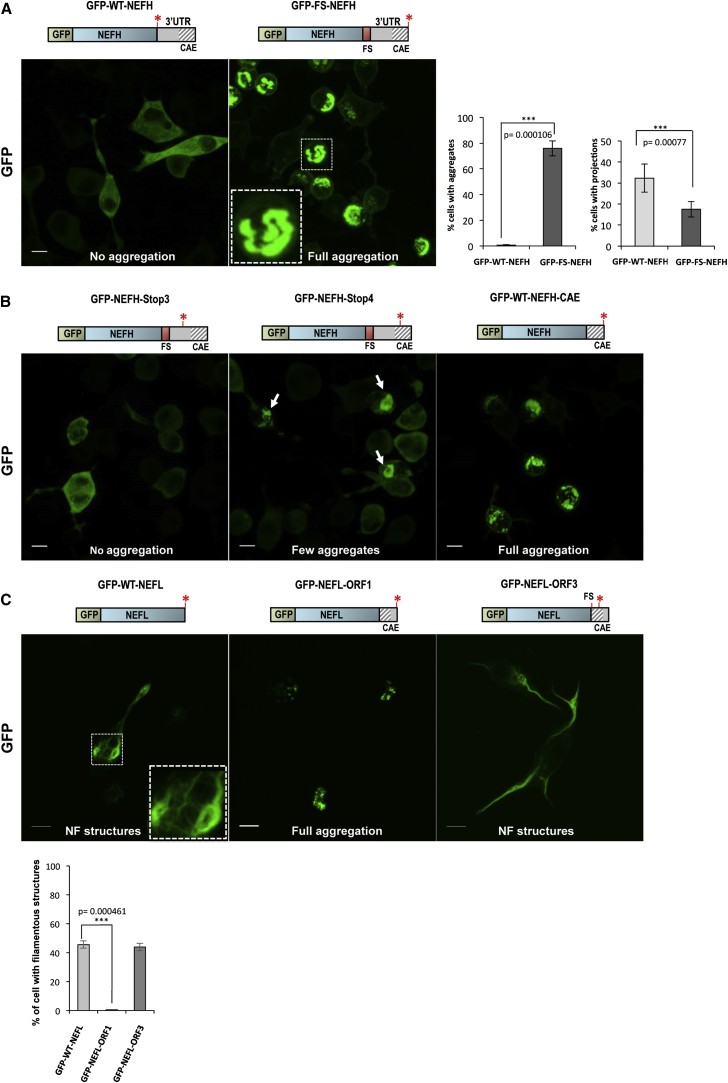
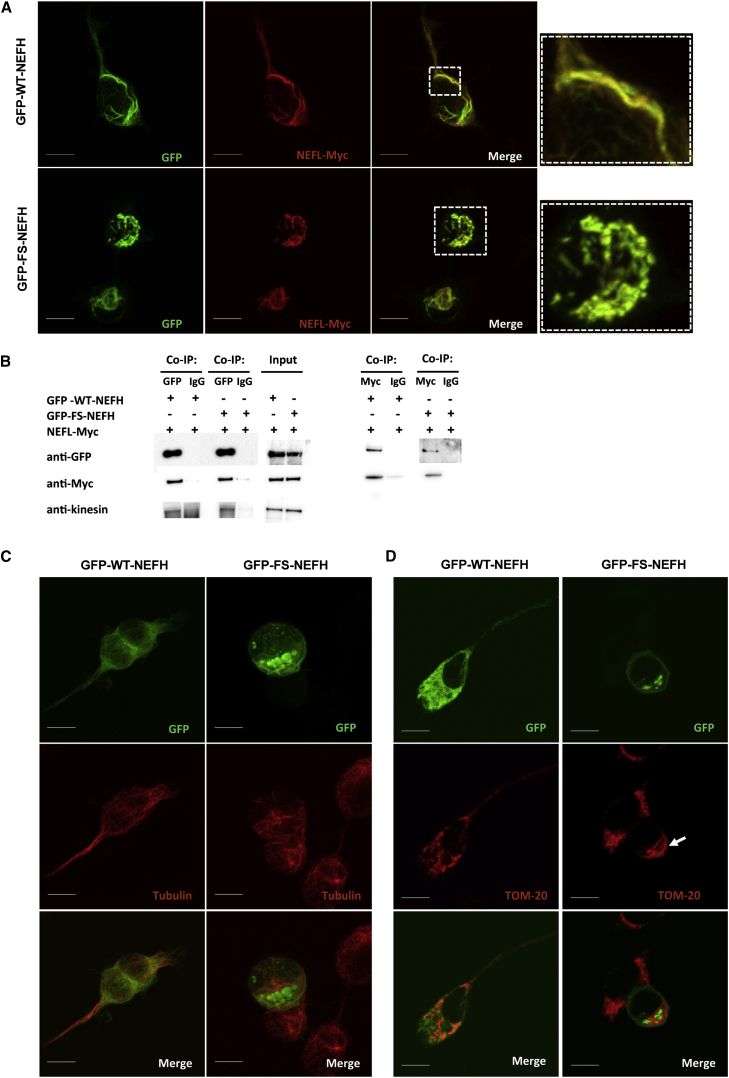
Abnormal protein aggregation is observed in an expanding number of neurodegenerative diseases. Here, we describe a mechanism for intracellular toxic protein aggregation induced by an unusual mutation event in families affected by axonal neuropathy. These families carry distinct frameshift variants in NEFH (neurofilament heavy), leading to a loss of the terminating codon and translation of the 3' UTR into an extra 40 amino acids. In silico aggregation prediction suggested the terminal 20 residues of the altered NEFH to be amyloidogenic, which we confirmed experimentally by serial deletion analysis. The presence of this amyloidogenic motif fused to NEFH caused prominent and toxic protein aggregates in transfected cells and disrupted motor neurons in zebrafish. We identified a similar aggregation-inducing mechanism in NEFL (neurofilament light) and FUS (fused in sarcoma), in which mutations are known to cause aggregation in Charcot-Marie-Tooth disease and amyotrophic lateral sclerosis, respectively. In summary, we present a protein-aggregation-triggering mechanism that should be taken into consideration during the evaluation of stop-loss variants.
Copyright © 2016 The American Society of Human Genetics. Published by Elsevier Inc. All rights reserved.
Figures


Similar articles
-
Whole-Genome Linkage Analysis with Whole-Exome Sequencing Identifies a Novel Frameshift Variant in NEFH in a Chinese Family with Charcot-Marie-Tooth 2: A Novel Variant in NEFH for Charcot-Marie-Tooth 2.Neurodegener Dis. 2018;18(2-3):74-83. doi: 10.1159/000487754. Epub 2018 Mar 27. Neurodegener Dis. 2018. PMID: 29587262
-
Axonal Charcot-Marie-Tooth neuropathy concurrent with distal and proximal weakness by translational elongation of the 3' UTR in NEFH.J Peripher Nerv Syst. 2017 Sep;22(3):200-207. doi: 10.1111/jns.12223. J Peripher Nerv Syst. 2017. PMID: 28544463
-
Charcot-Marie-Tooth disease type 2CC due to NEFH variants causes a progressive, non-length-dependent, motor-predominant phenotype.J Neurol Neurosurg Psychiatry. 2022 Jan;93(1):48-56. doi: 10.1136/jnnp-2021-327186. Epub 2021 Sep 13. J Neurol Neurosurg Psychiatry. 2022. PMID: 34518334 Free PMC article.
-
The role of neurofilament aggregation in neurodegeneration: lessons from rare inherited neurological disorders.Mol Neurodegener. 2019 May 16;14(1):19. doi: 10.1186/s13024-019-0318-4. Mol Neurodegener. 2019. PMID: 31097008 Free PMC article. Review.
-
A review and analysis of the clinical literature on Charcot-Marie-Tooth disease caused by mutations in neurofilament protein L.Cytoskeleton (Hoboken). 2021 Mar;78(3):97-110. doi: 10.1002/cm.21676. Epub 2021 Jun 3. Cytoskeleton (Hoboken). 2021. PMID: 33993654 Free PMC article. Review.
Cited by
-
Cryptic amyloidogenic elements in mutant NEFH causing Charcot-Marie-Tooth 2 trigger aggresome formation and neuronal death.Acta Neuropathol Commun. 2017 Jul 14;5(1):55. doi: 10.1186/s40478-017-0457-1. Acta Neuropathol Commun. 2017. PMID: 28709447 Free PMC article.
-
Clinical and Genetic Survey for Charcot-Marie-Tooth Neuropathy Based on the Findings in Turkey, a Country with a High Rate of Consanguineous Marriages.Balkan Med J. 2022 Jan 25;39(1):3-11. doi: 10.4274/balkanmedj.galenos.2021.2021-11-13. Balkan Med J. 2022. PMID: 35325986 Free PMC article.
-
Protein products of nonstop mRNA disrupt nucleolar homeostasis.Cell Stress Chaperones. 2021 May;26(3):549-561. doi: 10.1007/s12192-021-01200-w. Epub 2021 Feb 22. Cell Stress Chaperones. 2021. PMID: 33619693 Free PMC article.
-
Anterograde Axonal Transport in Neuronal Homeostasis and Disease.Front Mol Neurosci. 2020 Sep 18;13:556175. doi: 10.3389/fnmol.2020.556175. eCollection 2020. Front Mol Neurosci. 2020. PMID: 33071754 Free PMC article. Review.
-
Novel mutations in dystonin provide clues to the pathomechanisms of HSAN-VI.Neurology. 2017 May 30;88(22):2132-2140. doi: 10.1212/WNL.0000000000003992. Epub 2017 May 3. Neurology. 2017. PMID: 28468842 Free PMC article.
References
-
- Ross C.A., Poirier M.A. Protein aggregation and neurodegenerative disease. Nat. Med. 2004;10(Suppl):S10–S17. - PubMed
-
- Aguzzi A., O’Connor T. Protein aggregation diseases: pathogenicity and therapeutic perspectives. Nat. Rev. Drug Discov. 2010;9:237–248. - PubMed
-
- Li S.H., Li X.J. Aggregation of N-terminal huntingtin is dependent on the length of its glutamine repeats. Hum. Mol. Genet. 1998;7:777–782. - PubMed
-
- LaFerla F.M., Oddo S. Alzheimer’s disease: Abeta, tau and synaptic dysfunction. Trends Mol. Med. 2005;11:170–176. - PubMed
Publication types
MeSH terms
Substances
Grants and funding
- G1001253/MRC_/Medical Research Council/United Kingdom
- G108/638/MRC_/Medical Research Council/United Kingdom
- P 23223/FWF_/Austrian Science Fund FWF/Austria
- G0802760/MRC_/Medical Research Council/United Kingdom
- U54NS09209/NS/NINDS NIH HHS/United States
- R01NS075764/NS/NINDS NIH HHS/United States
- U54 NS065712/NS/NINDS NIH HHS/United States
- G0601943/MRC_/Medical Research Council/United Kingdom
- U54 NS092091/NS/NINDS NIH HHS/United States
- MR/J004758/1/MRC_/Medical Research Council/United Kingdom
- U54NS065712/NS/NINDS NIH HHS/United States
- R01 NS075764/NS/NINDS NIH HHS/United States
- P 27634/FWF_/Austrian Science Fund FWF/Austria
LinkOut - more resources
Full Text Sources
Other Literature Sources
Molecular Biology Databases
