. 2016 May:128:69-74.
doi: 10.1016/j.cmpb.2016.02.011. Epub 2016 Feb 27.

InterSIM: Simulation tool for multiple integrative 'omic datasets'

Affiliations

InterSIM: Simulation tool for multiple integrative 'omic datasets'

Prabhakar Chalise et al. Comput Methods Programs Biomed. 2016 May.

Abstract

Background and objective: Integrative approaches for the study of biological systems have gained popularity in the realm of statistical genomics. For example, The Cancer Genome Atlas (TCGA) has applied integrative clustering methodologies to various cancer types to determine molecular subtypes within a given cancer histology. In order to adequately compare integrative or "systems-biology"-type methods, realistic and related datasets are needed to assess the methods. This involves simulating multiple types of 'omic data with realistic correlation between features of the same type (e.g., gene expression for genes in a pathway) and across data types (e.g., "gene silencing" involving DNA methylation and gene expression).

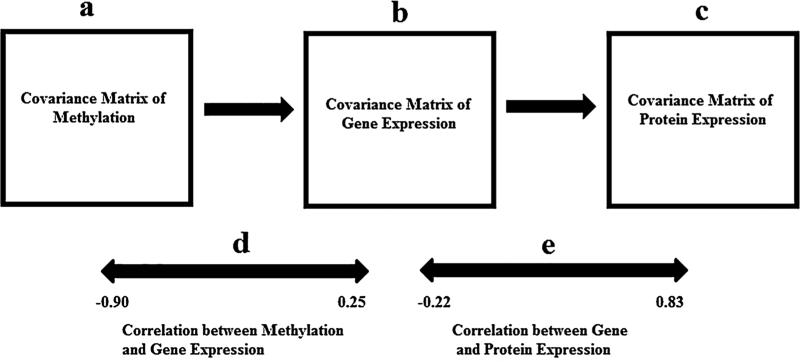
Methods: We present the software application tool InterSIM for simulating multiple interrelated data types with realistic intra- and inter-relationships based on the DNA methylation, mRNA gene expression, and protein expression from the TCGA ovarian cancer study.

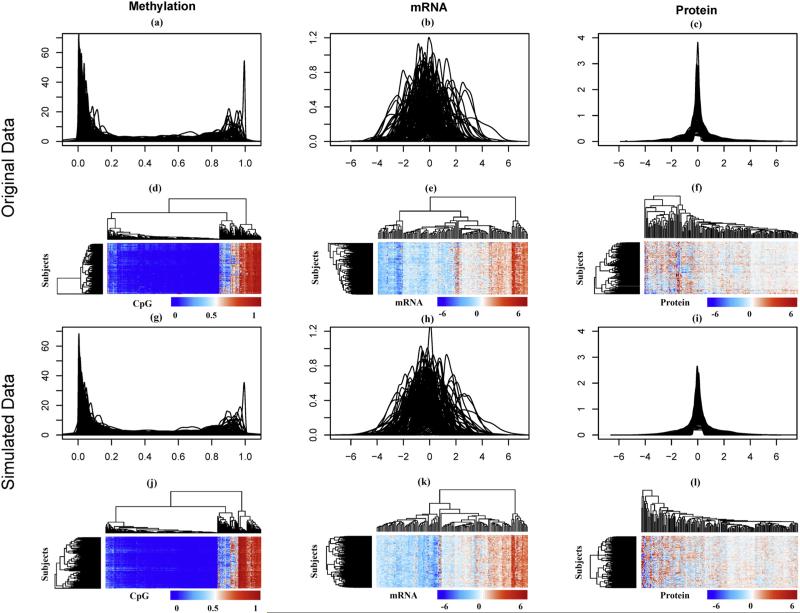
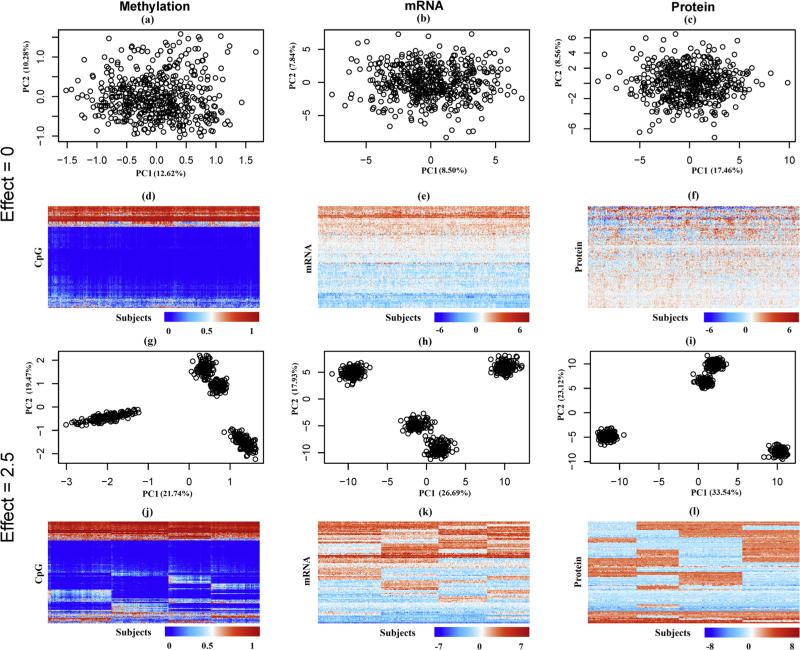
Results: The resulting simulated datasets can be used to assess and compare the operating characteristics of newly developed integrative bioinformatics methods to existing methods. Application of InterSIM is presented with an example of heatmaps of the simulated datasets.

Conclusions: InterSIM allows researchers to evaluate and test new integrative methods with realistically simulated interrelated genomic datasets. The software tool InterSIM is implemented in R and is freely available from CRAN.

Keywords: Clustering; Integrative; NMF; Simulation.


Figures

Fig. 1
Fig. 1
Diagram showing the intra- and inter-correlation structure among the features used in the simulation within and between (a) methylation, (b) gene expression and (c) protein expression data from the TCGA studies on ovarian cancer; (d) represents the correlation between the gene level summary of methylation profile and corresponding gene expression (102 pairs were negatively correlated with minimum value of −0.91 and 29 pairs were positively correlated with maximum value of 0.25); (e) represents correlation between the protein expression and corresponding mapped gene expression (14 pairs were negatively correlated with minimum value of −0.22 and 146 pairs were positively correlated with maximum value of 0.83).
Fig. 2
Fig. 2
Comparison of original and simulated data (without cluster-shift effect). (a) and (g) represent the density plots of CpGs in the original data and simulated data respectively; similarly (b)–(h) and (c)–(i) represent the density plots of mRNAs and proteins in the original and simulated data; (d), (e) and (f) represent the heatmaps of the original data and (j), (k) and (l) represent the heatmaps of the simulated data by data type.
Fig. 3
Fig. 3
Example of two sets of simulated data with and without cluster shift effect; (a) and (g) represent the plot between first and second principal components of the methylation data. The numbers in parentheses represent the percentage of variation explained by the first and second principal components; similarly (b)–(h) and (c)–(i) represent the principal components plot of mRNA and protein data respectively; (d), (e) and (f) represent the heatmaps of the first set of simulated data and (j), (k) and (l) represent the heatmaps of the second set of simulated data by data type. The proportion of subjects in the clusters was assigned as 0.20, 0.30, 0.27 and 0.23. The percentages in the parenthesis of the plots (a)–(c) and (g)–(i) represent the percentage of variation explained by the first and second principal components.

References

    1. Sorlie T, et al. Gene expression patterns of breast cancer carcinomas distinguish tumor subclasses with clinical implications. PNAS. 2001;98:10869–10874. - PMC - PubMed
    1. Verhaak RG, et al. Integrated genomic analysis identifies clinically relevant subtypes of glioblastoma characterized by abnormalities in PDGFRA, IDH1, EGFR, and NF1. Cancer Cell. 2010;17:98–110. - PMC - PubMed
    1. Hastie, et al. The Elements of Statistical Learning. Springer; New York: 2001.
    1. Brunet JP, et al. Metagenes and molecular pattern discovery using matrix factorization. Proc. Natl. Acad. Sci. U. S. A. 2004;101:4164–4169. - PMC - PubMed
    1. Shen R, et al. Integrative clustering of multiple genomic data types using a joint latent variable model with application to breast cancer subtype analysis. Bioinformatics. 2009;25:2906–2912. - PMC - PubMed

Publication types