. 2016 Apr 4:6:23865.
doi: 10.1038/srep23865.

Pado, a fluorescent protein with proton channel activity can optically monitor membrane potential, intracellular pH, and map gap junctions

Affiliations

Pado, a fluorescent protein with proton channel activity can optically monitor membrane potential, intracellular pH, and map gap junctions

Bok Eum Kang et al. Sci Rep. .

Abstract

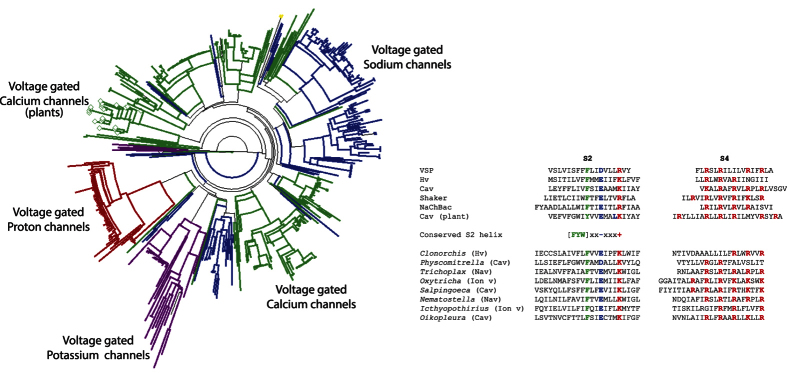
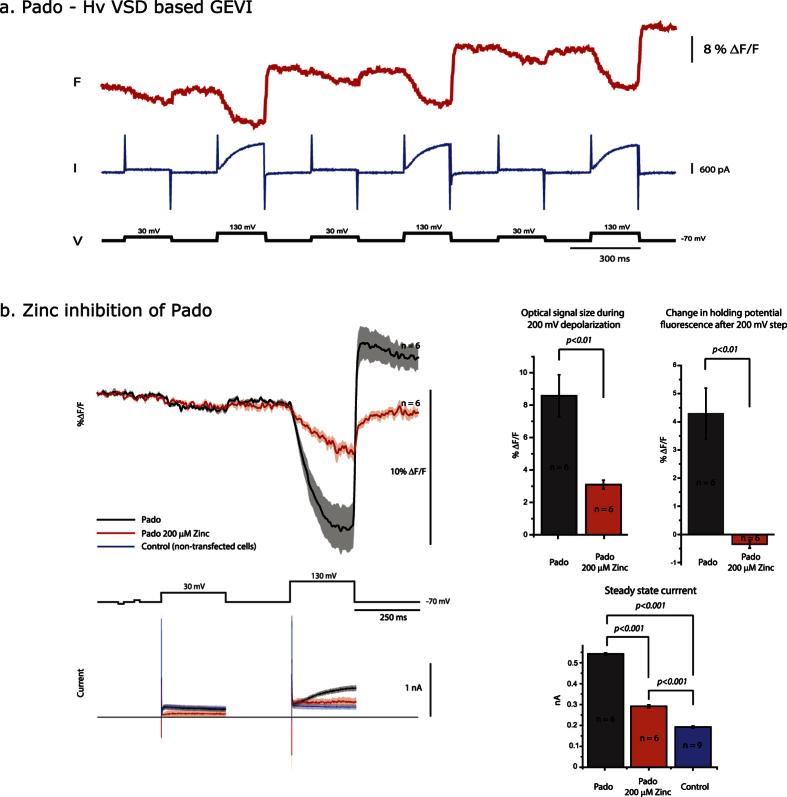
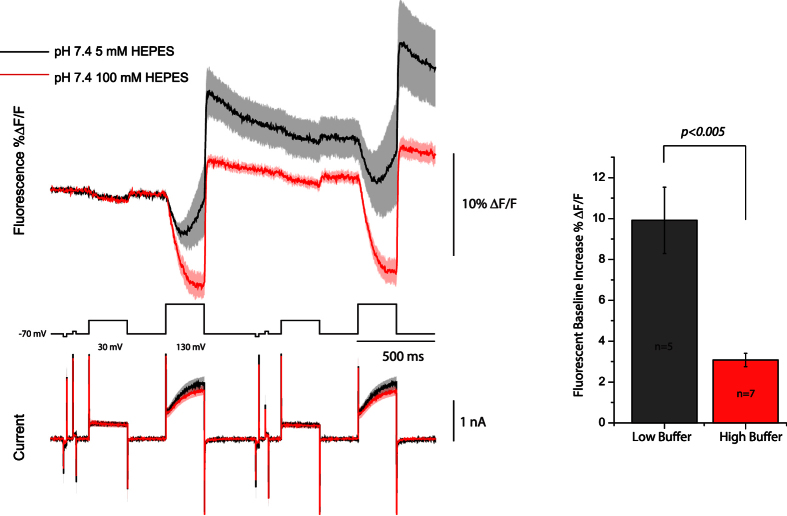
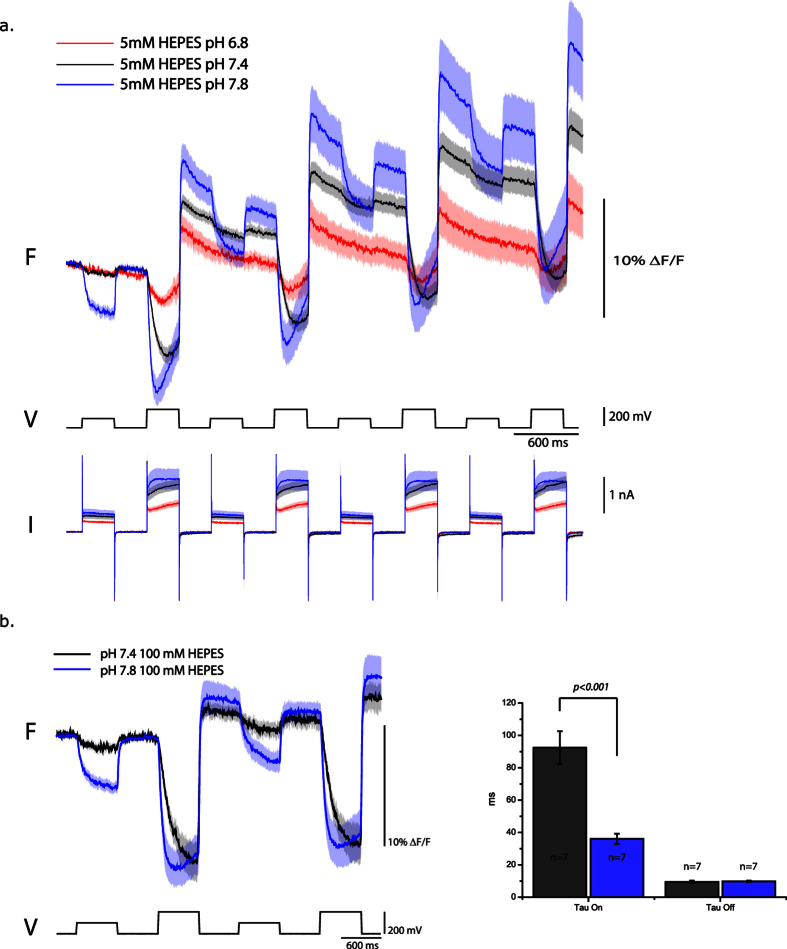
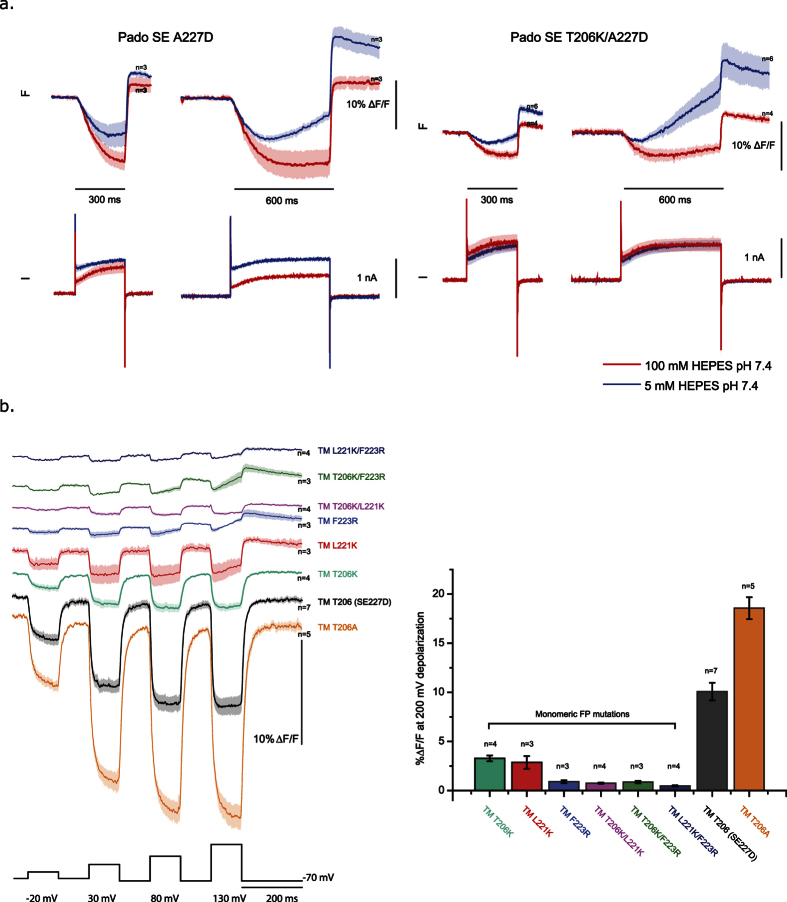
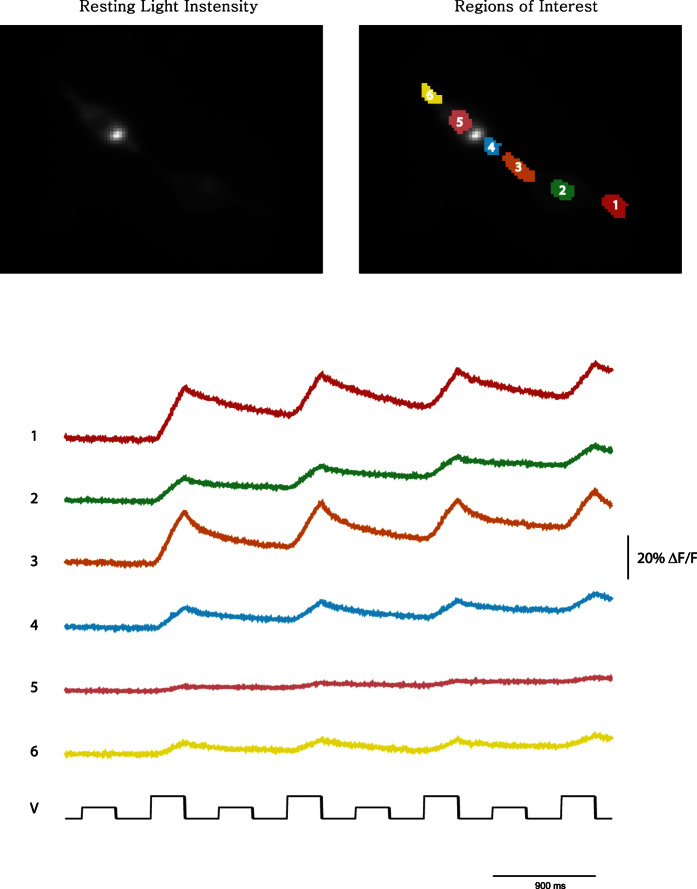
An in silico search strategy was developed to identify potential voltage-sensing domains (VSD) for the development of genetically encoded voltage indicators (GEVIs). Using a conserved charge distribution in the S2 α-helix, a single in silico search yielded most voltage-sensing proteins including voltage-gated potassium channels, voltage-gated calcium channels, voltage-gated sodium channels, voltage-gated proton channels, and voltage-sensing phosphatases from organisms ranging from mammals to bacteria and plants. A GEVI utilizing the VSD from a voltage-gated proton channel identified from that search was able to optically report changes in membrane potential. In addition this sensor was capable of manipulating the internal pH while simultaneously reporting that change optically since it maintains the voltage-gated proton channel activity of the VSD. Biophysical characterization of this GEVI, Pado, demonstrated that the voltage-dependent signal was distinct from the pH-dependent signal and was dependent on the movement of the S4 α-helix. Further investigation into the mechanism of the voltage-dependent optical signal revealed that inhibiting the dimerization of the fluorescent protein greatly reduced the optical signal. Dimerization of the FP thereby enabled the movement of the S4 α-helix to mediate a fluorescent response.


Conflict of interest statement

The authors declare no competing financial interests.

Figures

Figure 1
Figure 1. Identification of diverse VSDs.
Partial dendrogram of distantly related proteins identified using the VSD from the zebrafish VSP and requiring the sequence [FYW]xx[DE]xxx[RK]. The Hv family of proteins is in red. The Kv family of channels is in purple. The Cav proteins are denoted in green. The Cav nodes ending with a diamond are from plants. Nav channels are in blue. The VSP family and most hypothetical proteins except from plants were removed for demonstration purposes. Comparison of the S2 and S4 transmembrane sequences for the VSP (zebrafish), Hv (human), Cav (mouse), Shaker (Kv – drosophila), NaChBac (Nav - bacteria), Cav plant (Populus trichocarpa) are shown as specific examples. The conserved helix sequence was required to be present in a PHI BLAST in silico search yielding known and potential novel VSDs from the following organisms and accession numbers: Ichthyopthirius multifiliis (freshwater protozoan), EGR29338; Physcomitrella patens (moss), XP_001766478.1; Trichoplax adhaerens (metazoa), XP_002110559.1; Oxytricha Trifallax (ciliated protozoa), EJY83098.1; Oikopleura dioica (pelagic tunicate), CBY37723.1; Salpingoeca rosetta (choanoflagellate), EGD72607.1; Clonorchis sinensis (Chinese liver fluke), GAA49235.1; and Nematostella vectensis (starlet sea anemone), XP_001627761.1. The bulky, hydrophobic amino acid in the S2 transmembrane segment is in green. Negatively charged residues in the required bait sequence are in blue, positively charged amino acids are red as are the potential positive charges in the S4 transmembrane segment that respond to voltage.
Figure 2
Figure 2. Pado exhibits a voltage dependent optical signal and a voltage dependent current.
(a) Representative fluorescent (red) and current (blue) traces of an HEK cell expressing Pado in the whole cell patch clamp configuration. The cell was subjected to the voltage command pulses in black. A Gaussian 50 offline filter was used on the fluorescent trace. This trace is from a single trial. The voltage-dependent current seen at the 200 mV depolarization step results in the increase in fluorescence of the cell at the holding potential. (b) Pado can be inhibited by Zn2+. The darker fluorescence traces represent the average of the optical responses of Pado in the presence or absence of extra-cellular Zn2+. The lighter colored traces represent the standard error of the mean (n = 6 for both conditions). Bar graphs represent the fluorescence change from the start of the 200 mV depolarization step to the maximum change recorded. The fluorescence change at the holding potential represents the difference in fluorescent intensities before and after the 200 mV depolarization step. The blue trace depicts the average current from 9 non-transfected HEK 293 cells.
Figure 3
Figure 3. The voltage-dependent optical signal is dependent on the movement of S4.
(a) The schematic representation of an HEK 293 cell co-transfected with the farnesylated version of SE227D and Pado red, and a representative comparison of the red and green fluorescent signals from the same HEK cell expressing both Pado red and a farnesylated version of SE227D (co-transfection). The red channel represents a single trial with four repetitions of a 100 or 200 mV depolarization step. The green channel represents a subsequent single trial on the same cell. The pH sensitive SE227D shows a rise in the baseline fluorescence corresponding with the voltage-gated current. There is no voltage-dependent downward signal when SE227D is not attached to S4. (b) HEK cells only expressing the farnesylated version of SE227D, and a representative trace of an HEK cell expressing only the farnesylated version of SE227D. All traces were filtered offline with a low pass Gaussian 100 filter.
Figure 4
Figure 4. Increasing the buffering capacity of the internal solution reduces the change in the fluorescence baseline.
The top traces are an overlay of the optical signal from HEK cells expressing Pado that were subjected to voltage pulses with 100 mM HEPES pH 7.2 internal solution (red) or 5 mM HEPES pH 7.2 internal solution (black). The dark line represents the average from single trial recordings (5 low buffered cells, 7 high buffered cells). Lighter shade is the standard error of the mean. Both fluorescent traces were subjected to an offline, low pass Gaussion 100 filter. Bottom traces are the average current (I). Bar graph represents the change in fluorescence for the holding potential after the 200 mV depolarization activates the current.
Figure 5
Figure 5. Increasing the intracellular/extracellular pH difference alters the voltage response of Pado.
(a) Top traces compare the optical response of HEK cells expressing Pado that were voltage clamped with extracellular solution at pH 6.8 (red trace), pH 7.4 (black trace), or pH 7.8 (blue trace). The dark line is the average of the response from 3 cells for each condition. Lighter shade is the standard error of the mean. (b) Cells were also tested with higher buffering capacity solutions to show that the speed of the response is also affected by increasing the pH difference across the plasma membrane. Each cell was only tested at one pH condition. The standard error of the mean is in a lighter shade. All cells were voltage clamped at a holding potential of −70 mV with an internal solution of pH 7.2. Bar graph represents the kinetics of the optical signal for the 200 mV depolarization step.
Figure 6
Figure 6. Increasing the internal pH does not inhibit the voltage-dependent optical signal but dimerization of the FP does.
(a) Comparison of the fluorescent response from HEK 293 cells expressing Pado with varying lengths of 200 mV depolarizations. Blue trace is the average of cells voltage-clamped in 5 mM HEPES internal buffer. Red trace is the average of cells voltage-clamped in 100 mM HEPES internal buffer. Light shade is standard error of the mean. The left traces are from cells expressing Pado. The right traces are from cells expressing Pado with the 206K mutation in SE 227D that inhibits the dimerization of the FP. The T206K mutation in the FP reduces the voltage-dependent signal by ~50%. (b) Comparison of Ciona VSP-based GEVI (TM) containing mutated versions of SE227D. Three monomeric mutations were introduced into the FP as a single mutation or in combinations. Numbers of the mutation are based on the SE227D amino acid position. Optical traces are color coded for the mutations to the FP. All fluorescent traces were subjected to an offline, low pass Gaussian 100 filter. Bar graph represents the average of the absolute fluorescent signal for a 200 mV depolarization in HEK 293 cells.
Figure 7
Figure 7. Affecting the fluorescent intensity in a neighboring cell via gap junctions.
The upper left panel shows the resting light intensity of two HEK 293 cells expressing Pado (SED227A). The dimmer, lower cell was subjected to whole cell patch clamp and depolarized with 100 and 200 mV pulses. The optical traces below refer to the region of interests depicted in the upper right panel. While the patched cell showed a larger optical signal, all regions showed an increase in fluorescence upon the 200 mV depolarization suggesting that Pado can optically map gap junctions.

Similar articles

Cited by

References

    1. Jin L. et al. Single action potentials and subthreshold electrical events imaged in neurons with a fluorescent protein voltage probe. Neuron 75, 779–785, doi: 10.1016/j.neuron.2012.06.040 (2012). - DOI - PMC - PubMed
    1. Han Z. et al. Fluorescent protein voltage probes derived from ArcLight that respond to membrane voltage changes with fast kinetics. PloS One 8, e81295, doi: 10.1371/journal.pone.0081295 (2013). - DOI - PMC - PubMed
    1. Kralj J. M., Douglass A. D., Hochbaum D. R., Maclaurin D. & Cohen A. E. Optical recording of action potentials in mammalian neurons using a microbial rhodopsin. Nat Methods 9, 90–95, doi: 10.1038/nmeth.1782 (2012). - DOI - PMC - PubMed
    1. Perron A., Mutoh H., Launey T. & Knopfel T. Red-shifted voltage-sensitive fluorescent proteins. Chem Biol 16, 1268–1277, doi: 10.1016/j.chembiol.2009.11.014 (2009). - DOI - PMC - PubMed
    1. Akemann W. et al. Imaging neural circuit dynamics with a voltage-sensitive fluorescent protein. J Neurophysiol 108, 2323–2337, doi: 10.1152/jn.00452.2012 (2012). - DOI - PubMed

Publication types