. 2016 Apr 4:7:11127.
doi: 10.1038/ncomms11127.

mTORC1 and CK2 coordinate ternary and eIF4F complex assembly

Affiliations

mTORC1 and CK2 coordinate ternary and eIF4F complex assembly

Valentina Gandin et al. Nat Commun. .

Abstract

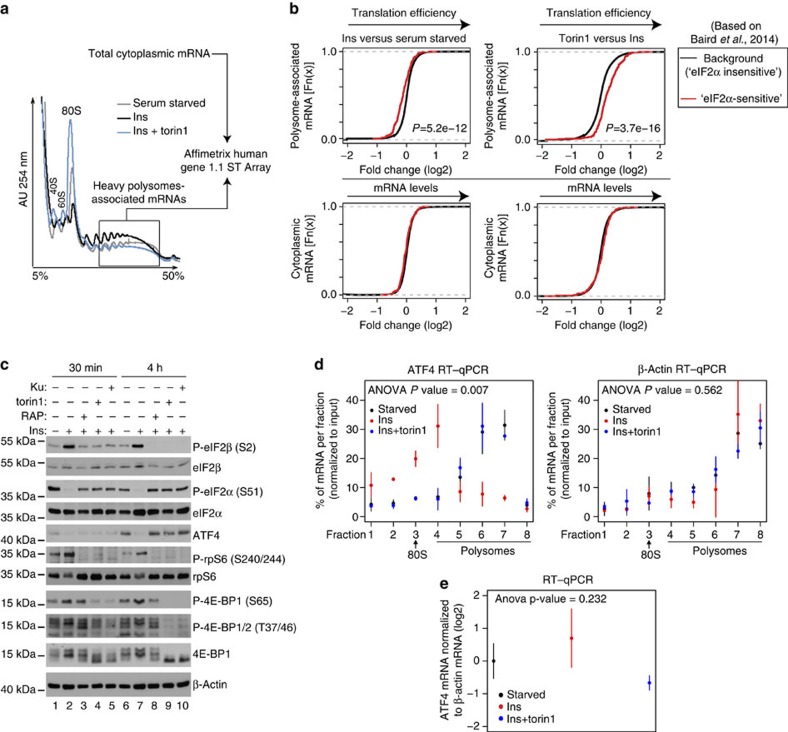
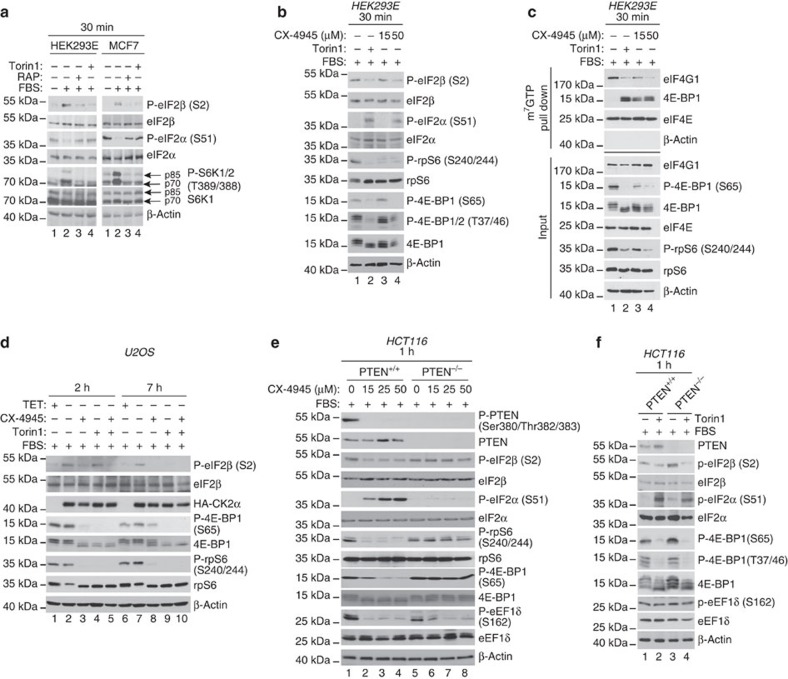
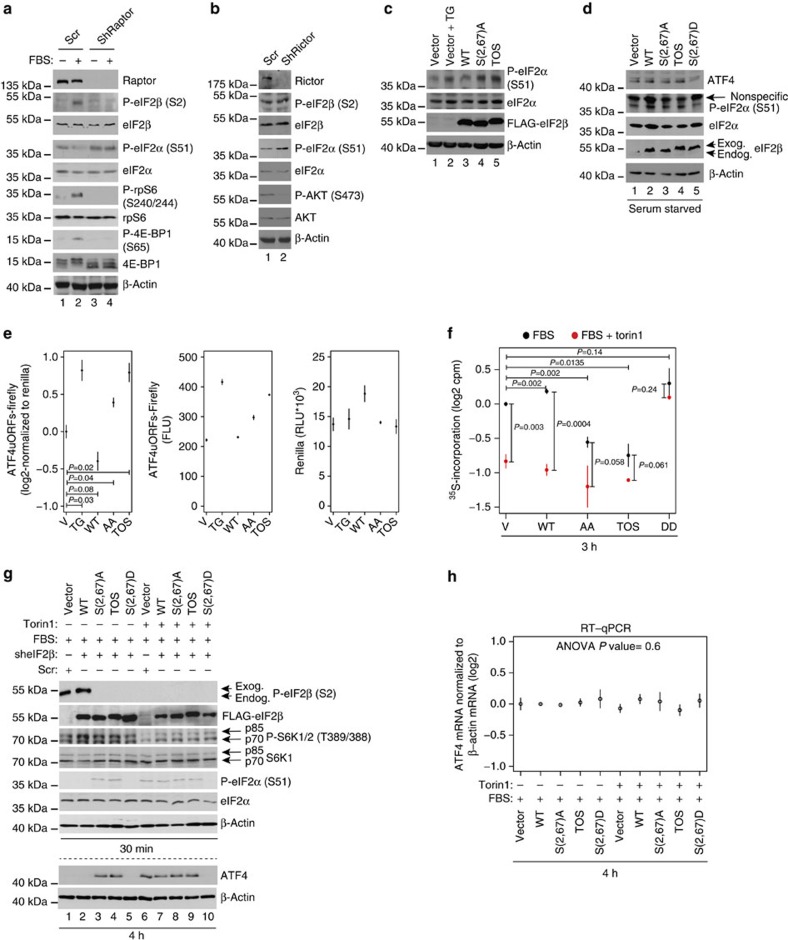
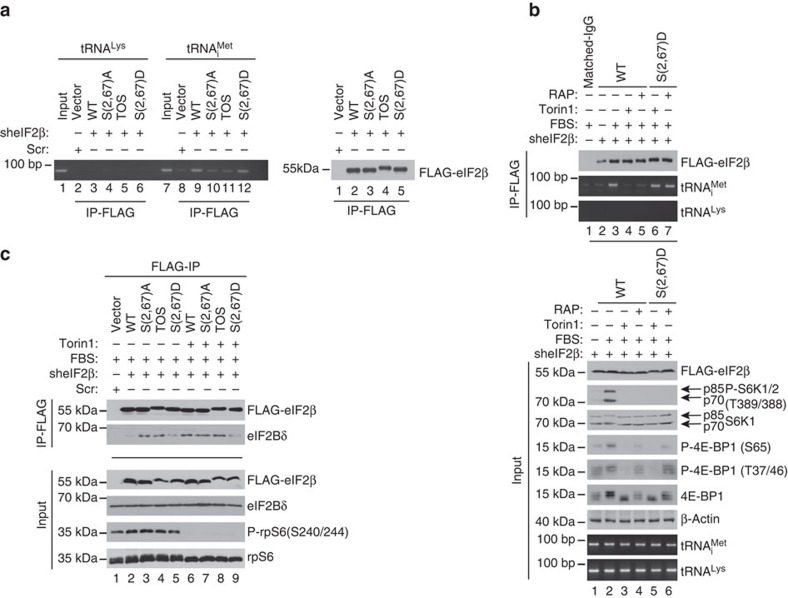
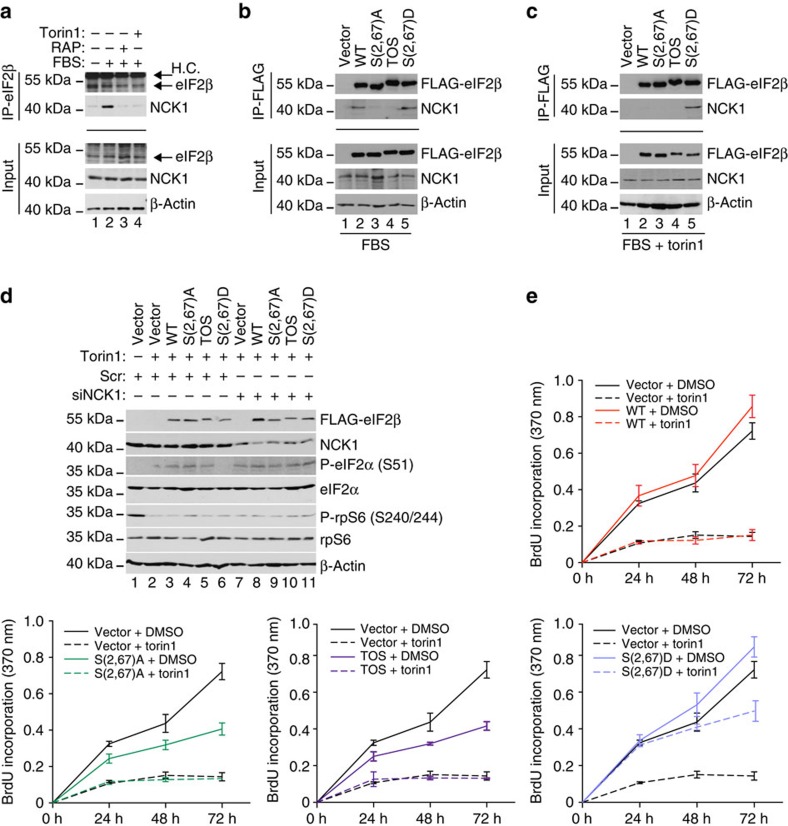
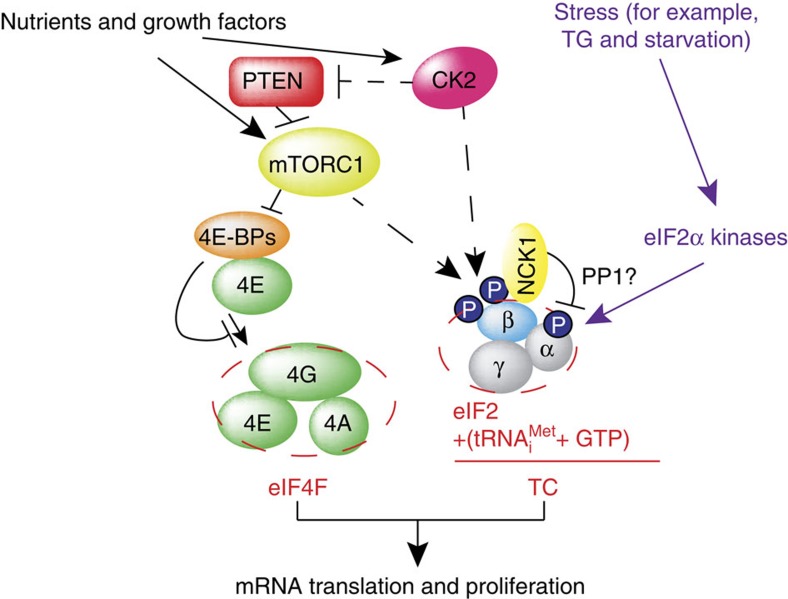
Ternary complex (TC) and eIF4F complex assembly are the two major rate-limiting steps in translation initiation regulated by eIF2α phosphorylation and the mTOR/4E-BP pathway, respectively. How TC and eIF4F assembly are coordinated, however, remains largely unknown. We show that mTOR suppresses translation of mRNAs activated under short-term stress wherein TC recycling is attenuated by eIF2α phosphorylation. During acute nutrient or growth factor stimulation, mTORC1 induces eIF2β phosphorylation and recruitment of NCK1 to eIF2, decreases eIF2α phosphorylation and bolsters TC recycling. Accordingly, eIF2β mediates the effect of mTORC1 on protein synthesis and proliferation. In addition, we demonstrate a formerly undocumented role for CK2 in regulation of translation initiation, whereby CK2 stimulates phosphorylation of eIF2β and simultaneously bolsters eIF4F complex assembly via the mTORC1/4E-BP pathway. These findings imply a previously unrecognized mode of translation regulation, whereby mTORC1 and CK2 coordinate TC and eIF4F complex assembly to stimulate cell proliferation.


Figures

Figure 1
Figure 1. mTOR stimulates eIF2β phosphorylation, decreases eIF2α phosphorylation and represses translation of mRNAs that are upregulated by phospho-eIF2α.
(a,b) MCF7 cells were serum starved for 16 h followed by 4-h stimulation with insulin (4.2 nM; Ins) in the presence of a vehicle (DMSO) or torin1 (250 nM). (a) Absorbance profiles (254 nm) of cytosolic extracts loaded onto 5–50% sucrose gradients and sedimented by ultracentrifugation. mRNA was isolated from fractions containing >3 ribosomes (box) and analysed in parallel with cytoplasmic mRNA using microarrays (see Methods). Positions of small (40S) and large (60S) ribosome subunits, monosomes (80S) and polysomes in the gradients are indicated. AU, absorbance units. (b) Transcriptome-wide effects of 4-h insulin and insulin+torin1 treatments on the translatome (polysome associated; upper panel) or steady-state cytoplasmic mRNA levels (lower panel). Presented are mRNAs whose translation is upregulated by eIF2α phosphorylation (‘eIF2α sensitive', red curve) and those that are not affected under conditions where eIF2α phosphorylation is stimulated (background; black curve) according to the study of Baird et al.. Wilcoxon P values contrasting fold changes for eIF2α-regulated to background mRNAs are indicated. The experiment was carried out in four independent replicates. (c) MCF7 cells were treated as in b for the indicated time periods. In addition to torin1, allosteric mTOR inhibitor rapamycin (RAP; 50 nM) and active-site mTOR inhibitor KU-0063794 (KU; 3 μM) were used. Phosphorylation and expression levels of indicated proteins were monitored by western blotting. β-Actin served as a loading control. Experiments were repeated in at least two independent replicates and quantified by densitometry (Supplementary Fig. 9). (d,e) MCF7 cells were serum starved for 16 h (Starved) and then treated and fractionated as in b. Relative amounts of ATF4 and β-actin mRNA in polysome fractions (d) or cytosolic extracts (for steady-state mRNA measurements) (e) were determined by reverse transcription–quantitative PCR (RT–qPCR). Position of monosome (80) and polysomal fractions are shown. (d,e) S.d.'s and interaction (treatment and fraction) P values from a two-way analysis of variance (ANOVA) using means of two independent experiments each consisting of technical replicates are indicated.
Figure 2
Figure 2. mTOR and CK2 inhibitors suppress eIF2β phosphorylation, increase phospho-eIF2α levels and interfere with eIF4F complex assembly.
(a) HEK293E or MCF7 cells were serum starved for 16 h and then stimulated with 10% serum (fetal bovine serum, FBS) in the presence of a vehicle (DMSO), rapamycin (50 nM) or torin1 (250 nM) for 30 min. Phosphorylation status and levels of indicated proteins were monitored by western blotting. β-Actin served as a loading control. (b) HEK293E cells were serum starved for 16 h and then stimulated for 30 min with serum (FBS; 10%) in the presence of a vehicle (DMSO), 250 nM torin1, 15 or 50 μM CX-4945. Phosphorylation and expression levels of indicated proteins were monitored by western blotting. β-Actin served as a loading control. (c) Extracts of HEK293E cells treated as in b were subjected to m7GTP cap pull down (see Methods). Levels and phosphorylation status of indicated proteins in the pulled down material (25%) and inputs (10%) were determined by western blotting. β-Actin served to exclude contamination of m7GTP cap pull downs (for example, non-specific binding to the agarose beads) and as a loading control for inputs. Parallel results were obtained in MCF7 and HCT116 cells (Supplementary Fig. 1a,b). (d) Expression of HA-CK2α in U2OS cells was induced by tetracycline withdrawal (doxycycline was used at 1.5 μg ml−1 to suppress expression of CK2 subunits in control cells). Cells were starved for 16 h after which cells were stimulated by 10% serum (FBS) in the presence of a vehicle (DMSO), 250 nM torin1, 50 μM CX-4945 or a combination thereof for the indicated time period. (e) HCT116 PTEN+/+ or PTEN−/− cells were treated with the indicated concentration of CX-4945 for 1 h in the presence of 10% serum (FBS). (f) Cells described in e were incubated with DMSO or torin1 (250 nM) for 1 h. (df) Expression levels and phosphorylation status of indicated proteins were monitored by western blotting. β-Actin served as a loading control. Experiments in this panel were repeated at least two times independently and the representative results are shown. Where appropriate, quantification was performed using densitometry (Supplementary Fig. 9).
Figure 3
Figure 3. eIF2β phosphorylation by mTORC1 coincides with dephosphorylation of eIF2α.
HEK293E cells infected with scrambled shRNA (Scr) (a,b), raptor (a) or rictor (b) shRNA were serum starved (16 h) and then stimulated with 10% serum (FBS; 30 min). (c,d) HEK293E cells were co-transfected with shown FLAG-eIF2β variants, p5′UTR ATF4-firefly (ATF4 uORFs) and renilla luciferase reporter constructs and treated with 1 μM thapsigargin (TG; 1 h) (c) or serum starved (d). (e) Luciferase activity in cells described in c and d was determined by chemiluminescence. Mean relative light units (RLU) of individual luciferase (middle and right panel) or ratio thereof (left panel) are shown. Data of three independent experiments were log2 transformed, normalized per replicate and to the mean of control condition, and shown as means and s.d.'s. P values from one-way analysis of variance (ANOVA) are indicated. (f) HEK293E cells were serum starved (16 h) and followed by 10% serum stimulation (FBS) in the presence of a vehicle (DMSO) or torin1 (250 nM) for 3 h. Global protein synthesis was monitored by 35S-Met/Cys incorporation. Data from three independent experiments were log2 transformed, normalized per replicate and to the mean of the control condition, and shown as means±s.d. P values from one-way ANOVAs are indicated. (g) HEK293E cells infected with empty vector+scrambled shRNA (control) or stably expressing indicated eIF2β variants and depleted of endogenous eIF2β (Supplementary Fig. 4b; Methods) were serum starved (16 h), followed by 10% serum (FBS) stimulation in the presence of a vehicle (DMSO) or torin1 (250 nM) for 30 min or 4 h. (h) Steady-state ATF4 mRNA levels after 4 h treatments as described in g were determined by RT–qPCR and normalized over β-actin values. Means from two independent experiments, each in technical triplicate were log2 transformed, normalized per replicate and to the control, and are shown as means with s.d.'s. The P value from a one-way ANOVA across all treatments is indicated. (ad,g) Experiments were repeated at least two times independently and representative results are shown. (ad,g) Levels and phosphorylation status of indicated proteins were monitored by western blotting. β-Actin was a loading control. Densitometry is shown in Supplementary Fig. 9. Endog, endogenous; exog, exogenous.
Figure 4
Figure 4. eIF2β phosphorylation stimulates TC recycling.
(a) HEK293E cells that stably express exogenous WT or indicated FLAG-eIF2β mutants in which endogenous eIF2β was depleted by shRNA (Supplementary Fig. 4b; Methods) were serum starved for 16 h, stimulated with serum (10%) for 30 min and subjected to FLAG immunoprecipitation (IP). Inputs (10%; Supplementary Fig. 4c) and quantity of immunoprecipitated proteins (25%) was determined by western blotting. The amount of tRNAiMet in the immunoprecipitated material was monitored by semi-quantitative reverse transcriptase–PCR (sqRT–PCR). tRNALys was used as a negative control. (b) Cells described in a that express WT or S(2,67)D FLAG-eIF2β were serum starved for 16 h and then stimulated with 10% serum (fetal bovine serum, FBS) in the presence of a vehicle (DMSO), rapamycin (50 nM) or torin1 (250 nM) for 30 min. Lysates were immunoprecipitated with an anti-FLAG antibody. The quantity of tRNAiMet and tRNALys in immunoprecipitates and input (10%) was analysed by sqRT–PCR, whereas the levels of indicated protein were determined by western blotting. (c) Cells described in (a) were serum starved for 16 h and then stimulated with 10% serum (FBS) for 30 min in the presence of a vehicle (DMSO) or torin1 (250 nM). Immunoprecipitations were carried out as described in a. The amount of indicated proteins in FLAG-eIF2β immunoprecipitated material and inputs (10%) was monitored by western blotting. (b,c) Western blotting experiments were performed in independent duplicates and the representative results are shown. sqRT–PCR (n=3) results were independently confirmed using quantitative RT–PCR (Supplementary Fig. 4d,e).
Figure 5
Figure 5. Phospho-eIF2β recruits NCK1 to eIF2 and mediates the effects of mTORC1 on proliferation.
(a) HEK293E cells were depleted of serum for 16 h and then stimulated with 10% serum (fetal bovine serum, FBS) in the presence of a vehicle (DMSO), rapamycin (50 nM) or torin1 (250 nM) for 30 min. Anti-eIF2β antibody immunoprecipitates (25%) and corresponding inputs (10%) were analysed by western blotting using indicated antibodies. H.C., heavy chains (b,c) HEK293E cells were transfected with the indicated eIF2β constructs, serum starved for 16 h and stimulated with 10% serum (FBS) in combination with a vehicle (DMSO) (b) or torin1 (250 nM) (c). Anti-FLAG antibody immunoprecipitates (25%) and corresponding inputs (10%) were analysed by western blotting using indicated antibodies. (d) HEK293E cells expressing indicated eIF2β constructs were transfected with a control, scrambled siRNA (Scr) or siRNA targeting NCK1 (siNCK1), serum starved and then stimulated with 10% serum in the presence of a vehicle (DMSO) or torin1 (250 nM) for 30 min. Expression and phosphorylation status of indicated proteins were monitored by western blotting. β-Actin served as a loading control. Experiments in ad were carried out two times independently. (e) HEK293E cells expressing indicated eIF2β variants in which endogenous eIF2β was depleted by shRNA (Supplementary Fig. 4b) were treated with a vehicle (DMSO) or torin1 (250 nM) for indicated times. Proliferation was measured by 5-bromo-2′-deoxyuridine (BrdU) incorporation, and the results are represented as mean absorbance at 370 nm±s.d. from three independent experiments, each consisting of a technical duplicate.
Figure 6
Figure 6. Schematic representation of the proposed model for the coordination of ternary complex (TC) and eIF4F assembly by mTOR and CK2.
On acute stimulation with nutrients, growth factors and insulin, CK2 appears to bolster mTORC1 activity, which is likely mediated via inhibition of PTEN. This leads to phosphorylation and inactivation of 4E-BPs, thereby facilitating eIF4F complex assembly. Simultaneously, CK2 bolsters TC formation by phosphorylating eIF2β. Phosphorylation of eIF2β results in the recruitment of NCK1 to eIF2, which correlates with eIF2α dephosphorylation, likely mediated by PP1. mTORC1 also stimulates eIF2β phosphorylation independently of CK2, which along with its established role in inducing eIF4F levels, demonstrates that mTORC1 also may coordinate TC and eIF4F assembly. In response to chronic increase in protein synthesis or stress (for example, thapsigargin (TG); shown in purple), activation of eIF2α kinases overcomes the effects of eIF2β phosphorylation on TC recycling, thereby allowing cells to fine-tune protein synthesis levels and energy consumption and/or adapt to stress. Broken lines represent uncertainties, such as precise hierarchy of the effects of CK2 and mTORC1 on eIF2β (Ser2) phosphorylation.

Similar articles

Cited by

References

    1. Sonenberg N. & Hinnebusch A. G. Regulation of translation initiation in eukaryotes: mechanisms and biological targets. Cell 136, 731–745 (2009). - PMC - PubMed
    1. Hinnebusch A. G. The scanning mechanism of eukaryotic translation initiation. Annu. Rev. Biochem. 83, 779–812 (2014). - PubMed
    1. Albert V. & Hall M. N. mTOR signaling in cellular and organismal energetics. Curr. Opin. Cell Biol. 33, 55–66 (2015). - PubMed
    1. Koromilas A. E. Roles of the translation initiation factor eIF2alpha serine 51 phosphorylation in cancer formation and treatment. Biochim. Biophys. Acta 1849, 871–880 (2015). - PubMed
    1. Baird T. D. et al. Selective mRNA translation during eIF2 phosphorylation induces expression of IBTKalpha. Mol. Biol. Cell 25, 1686–1697 (2014). - PMC - PubMed

Publication types

MeSH terms

Substances