. 2016 Jun 1;414(1):85-99.
doi: 10.1016/j.ydbio.2016.03.022. Epub 2016 Apr 1.

Control of the collective migration of enteric neural crest cells by the Complement anaphylatoxin C3a and N-cadherin

Affiliations

Control of the collective migration of enteric neural crest cells by the Complement anaphylatoxin C3a and N-cadherin

Florence Broders-Bondon et al. Dev Biol. .

Abstract

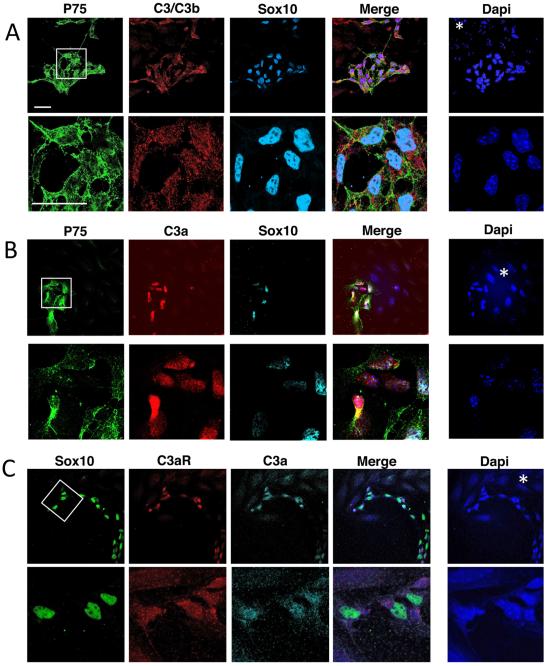
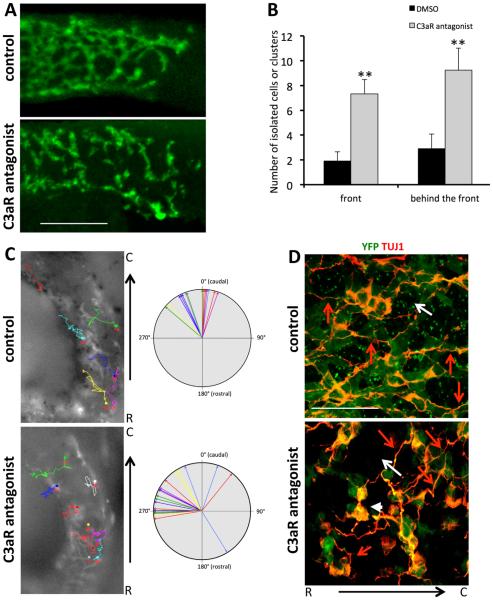
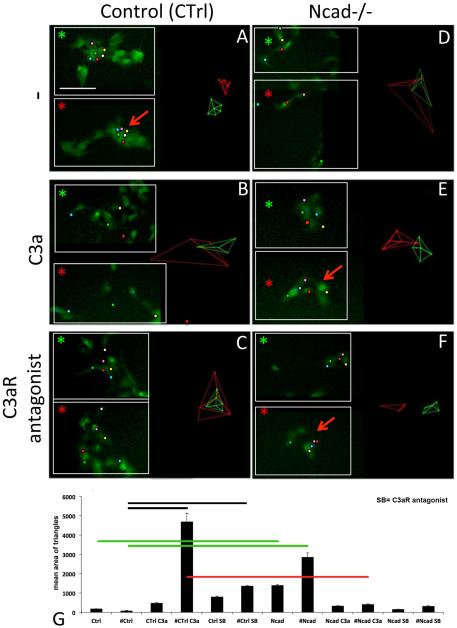
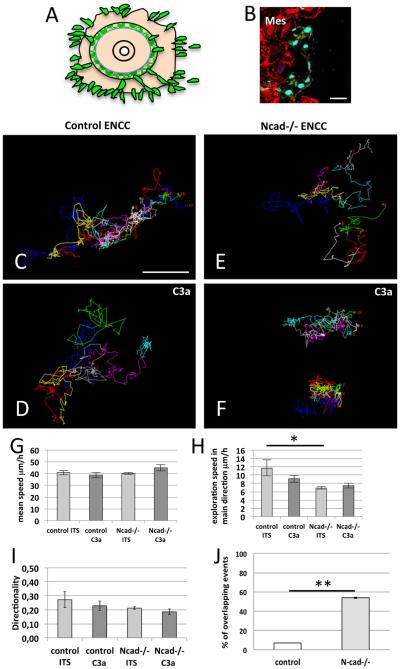
We analyzed the cellular and molecular mechanisms governing the adhesive and migratory behavior of enteric neural crest cells (ENCCs) during their collective migration within the developing mouse gut. We aimed to decipher the role of the complement anaphylatoxin C3a during this process, because this well-known immune system attractant has been implicated in cephalic NCC co-attraction, a process controlling directional migration. We used the conditional Ht-PA-cre transgenic mouse model allowing a specific ablation of the N-cadherin gene and the expression of a fluorescent reporter in migratory ENCCs without affecting the central nervous system. We performed time-lapse videomicroscopy of ENCCs from control and N-cadherin mutant gut explants cultured on fibronectin (FN) and micropatterned FN-stripes with C3a or C3aR antagonist, and studied cell migration behavior with the use of triangulation analysis to quantify cell dispersion. We performed ex vivo gut cultures with or without C3aR antagonist to determine the effect on ENCC behavior. Confocal microscopy was used to analyze the cell-matrix adhesion properties. We provide the first demonstration of the localization of the complement anaphylatoxin C3a and its receptor on ENCCs during their migration in the embryonic gut. C3aR receptor inhibition alters ENCC adhesion and migration, perturbing directionality and increasing cell dispersion both in vitro and ex vivo. N-cadherin-null ENCCs do not respond to C3a co-attraction. These findings indicate that C3a regulates cell migration in a N-cadherin-dependent process. Our results shed light on the role of C3a in regulating collective and directional cell migration, and in ganglia network organization during enteric nervous system ontogenesis. The detection of an immune system chemokine in ENCCs during ENS development may also shed light on new mechanisms for gastrointestinal disorders.

Keywords: Adhesion; Co-attraction; Complement anaphylatoxin C3a; Enteric nervous system; Migration; N-cadherin; Neural crest cells.


Figures

Fig. 1
Fig. 1
Localization of C3 fragments and C3aR in E12.5 gut. (A) Confocal images of midgut sections immunostained with antibodies against C3b/iC3b (red), P75NTR (P75, green), YFP (cytoplasmic staining, green), Sox10 (nuclear staining, cyan) and labeled with Dapi (blue). (B) Confocal images of E12.5 embryo sections at the level of gut and immunostained with antibodies against C3a (red), P75NTR (green) and labeled with Dapi (blue). (C) Confocal images of midgut sections with antibodies against C3aR (red), P75NTR (green), YFP (green). The white boxes in the upper panels indicate the regions shown at higher magnification in the lower panels. The white asterisk and arrows indicate the position of mesenchymal cells and ENCCs, respectively. Scale bars in A represent 30 μm. Scale bar in C represent 50 μm.
Fig. 2
Fig. 2
Detection of C3 fragments and C3aR in E12.5 midgut explant cultures. (A) Confocal images of cultures immunostained with antibodies against C3b/iC3b fragments (red), P75NTR (P75, green), YFP (cytoplasmic staining, green), Sox10 (nuclear staining, cyan) and labeled with Dapi (blue). (B) Confocal images of cultures immunostained with antibodies against C3a (red), YFP (green), Sox10 (cyan) and labeled with Dapi (blue). (C) Confocal images of cultures showing the expression of C3aR (red) by ENCC progenitors (Sox10 + ; nuclear, green). The white boxes in the upper panels indicate the regions shown at higher magnification in the lower panels. The white asterisk shows the position of mesenchymal cells. Scale bars in A represent 30 μm.
Fig. 3
Fig. 3
The addition of a C3aR antagonist disturbs gut colonization by ENCCs. (A) Whole-mount anti-GFP immunostaining of E12.5 control (solvent-treated, upper panel) and C3aR antagonist-treated (lower panel) gut taken at the level of the migratory front. ENCCs are visible in green. (B) Quantification of the number of isolated cells, disconnected chains or clusters (broken chains) in control (DMSO-treated, black bars) and C3aR antagonist-treated gut (gray bars) counted in a zone covering 200 μm from the migratory front (front) or 200 μm behind this zone (behind the front). Error bars are SEM, **p < 0.01. (C) Mean directionality of ENCCs tracked in ex vivo gut culture in control condition (in the presence of solvent, DMSO) and in the presence of the C3aR antagonist. Directionality was evaluated by measuring the angle between the rostro-caudal axis of the gut and the straight line separating the initial and final positions of the cell. Each arrow corresponds to individual ENCC. The pictures show individual trajectories of ENCCs (YFP + ) within the proximal hindgut in control condition (n = 16 cells) and in the presence of the C3aR antagonist (n = 23 cells). The tracks overlay the first image in the time series, with the initial positions of the cells indicated by circles. (D) Whole-mount TUJ1 immunostaining (red) of E12.5 gut. ENCCs are visible in green. The ENCC network in C3aR antagonist-treated guts (bottom panel) is disorganized with larger ENCC-free spaces (white arrow) and small groups of non-cohesive cells (white arrowhead) compared to control gut (upper panel). Red arrows point on the orientation of neurites and ENCC network Scale bars in A and D represent 100 and 20 μm, respectively.
Fig. 4
Fig. 4
Dynamic analysis of ENCCs in gut explants cultured in vitro on a 2D FN-coated substrate. (A–C) Behavior of control ENCCs (Ctrl, YFP + , green) in culture medium (A), and with C3a (B) or the C3aR antagonist (C). In ENCC clusters, the tracked cells are highlighted with colored dots at two time points: t = 5 minutes (top inset, green asterisk) and t = 3.5 h (bottom inset, red asterisk). The Delaunay triangles obtained are shown on the left part of the panels. (D–F) Behavior of Ncad−/− ENCCs in culture medium (D), and with C3a (E) or the C3aR antagonist (F). (G) Quantitative analysis of the Delaunay triangulation results. The mean areas of Delaunay triangles are combined for each set of conditions into two groups. One group corresponds to the first 25 min of time-lapse video microscopy for untreated control (Ctrl) and Ncad −/− ENCCs (Ncad), for C3a-treated control (Ctrl C3a) and Ncad −/− ENCCs (Ncad C3a), and for control (Ctrl SB) and Ncad −/− ENCCs (Ncad SB) treated with C3aR antagonist (SB). The second group corresponds to all time points after 75 min of time-lapse video microscopy for untreated control (#Ctrl) and Ncad −/− ENCCs (#Ncad), for C3a-treated control (#Ctrl C3a) and Ncad −/− ENCCs (#Ncad C3a), and for control (#Ctrl SB) and Ncad −/− ENCCs (#Ncad SB) treated with C3aR antagonist (SB). The black, green and red lines indicate significant differences (p < 0.01) between the corresponding conditions. The errors bars are SEM. Scale bar in A represents 30 μm.
Fig. 5
Fig. 5
Analysis of the migratory behavior of ENCCs on 2D substrates. (A) Diagram of the organotypic culture of gut explants with ENCCs escaping the explant and moving on 2D-FN-coated substrates (ENCCs, green; other cells of the gut in light orange). (B) Immunofluorescence staining of a gut explant culture after 18 h for YFP (green) and paxillin (red), with Sox10 (cyan), showing ENCCs (Sox10 + ) and mesenchymal cells (highly positive for paxilline staining, Mes). (C–E) Representative tracks followed by the ENCCs on FN coated-surfaces for control (C, D) and Ncad−/− ENCCs (E, F) in culture medium without (C, E) or with C3a (D, F). (G–I) Quantification of mean speed (G), exploration speed (H) and directionality (I). (J) Quantification of overlapping/crossing events between control (white bar) and Ncad −/− (gray bar) ENCCs. Error bars are SEM, *p < 0.05. Scale bars in B and C represent 30 and 50 μm, respectively.
Fig. 6
Fig. 6
Analysis of the migratory behavior of ENCCs on FN stripes. (A) Diagram of gut explant cultured on micro-patterned-FN stripes (13-μm FN-stripes /40-μm non-adhesive stripes; ENCCs, green; other cells of the gut, light orange). (B) Immunostaining of gut cultures for Sox10 and P75 (green), and cortactin (red), with Dapi labeling (blue), on Alexa594-coupled stripes of FN (cyan). The ENCCs migrate on the stripes (merge). (C–F) Representative tracks followed by ENCCs on FN stripes for control (C, D) and Ncad − / − ENCCs (E, F) without (C, E) or with C3a (D, F). (G–I) Quantification of mean speed (G), exploration speed (H) and directionality (I) in culture medium (ITS) without or with C3a. Error bars are SEM, *** p < 0.005. Scale bars in B and C represent 30 and 50 μm, respectively.
Fig. 7
Fig. 7
Effects of C3a/C3aR on the FAs of ENCCs. (A) Immunofluorescence staining of ENCCs cultured without (–), with C3a, C3aR antagonist or a mixture of C3a + C3aR antagonist, for paxillin (red), YFP (green), Sox10 (cyan), and with Dapi labeling (blue). The small white boxes in the upper panels indicate the regions shown the paxillin staining at higher magnification in the left inserts. (B, C) Quantification of paxillin-positive adhesion sites (FAs): the graphs show the mean area (B) and mean Feret's diameter (C)( ± SEM). n > 40 cells; n > 300 sites and n > 50 cells; n > 500 sites from control cells with and without C3a treatment; n > 20 cells; n > 79 sites and n > 24 cells; n > 400 sites from control cells with C3aR antagonist and C3a + C3aR antagonist, respectively. Two independent experiments were carried out for this analysis. (D, E) Quantification of activated beta1 integrin-positive adhesion sites: the graphs show the mean area (E) and mean Feret's diameter (F) ( ± SEM). n > 40 cells; n > 300 sites and n > 50 cells; n > 500 sites from control cells with and without C3a treatment. n > 20 cells; n > 260 sites and n > 15 cells; n > 220 sites from Ncad −/− cells without and with C3a treatment, respectively. Two independent experiments were carried out for this analysis. Error bars are SEM, ****; p < 0.0001. **, p < 0.01). Scale bar in A represents 10 μm.
Fig. 8
Fig. 8
Proposed additional mechanisms involved in the collective migration of ENCCs during gut colonization. In addition to other mechanisms, the C3a/C3aR-dependent co-attraction and the N-cadherin dependent regulation of ENCC dispersion upon intercellular contact could contribute to regulate ENCC behavior.

References

    1. Abercrombie M, Heaysman JE. Observations on the social behaviour of cells in tissue culture. I. Speed of movement of chick heart fibroblasts in relation to their mutual contacts. Exp. Cell Res. 1953;5(1):111–131. - PubMed
    1. Abercrombie M, Heaysman JE. Observations on the social behaviour of cells in tissue culture. II. Monolayering of fibroblasts. Exp. Cell Res. 1954;6(2):293–306. - PubMed
    1. Ames RS, et al. Identification of a selective nonpeptide antagonist of the anaphylatoxin C3a receptor that demonstrates antiinflammatory activity in animal models. J. Immunol. 2001;166(10):6341–6348. - PubMed
    1. Anderson RB, et al. The cell adhesion molecule L1 Is required for chain migration of neural crest cells in the developing mouse gut. Gastroenterology. 2006;130(4):1221–1232. - PubMed
    1. Azioune A, et al. Simple and rapid process for single cell micro-patterning. Lab Chip. 2009;9(11):1640–1642. - PubMed

Publication types

MeSH terms

LinkOut - more resources