. 2016 Apr 20;90(2):348-361.
doi: 10.1016/j.neuron.2016.03.004. Epub 2016 Mar 31.

Divergent Routing of Positive and Negative Information from the Amygdala during Memory Retrieval

Affiliations

Divergent Routing of Positive and Negative Information from the Amygdala during Memory Retrieval

Anna Beyeler et al. Neuron. .

Abstract

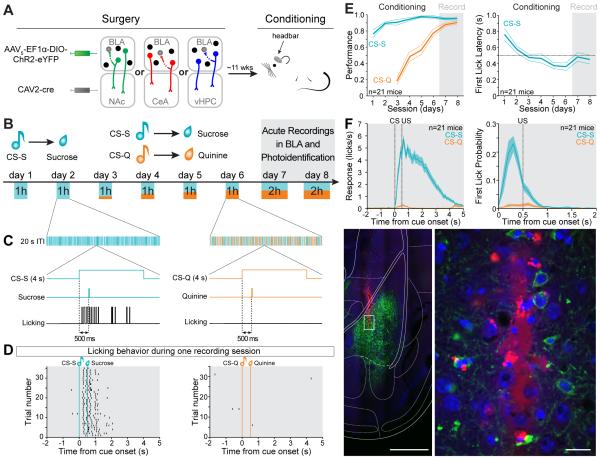
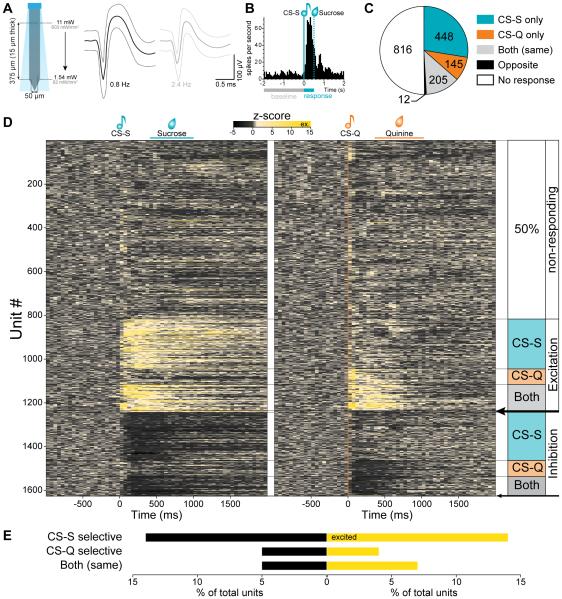
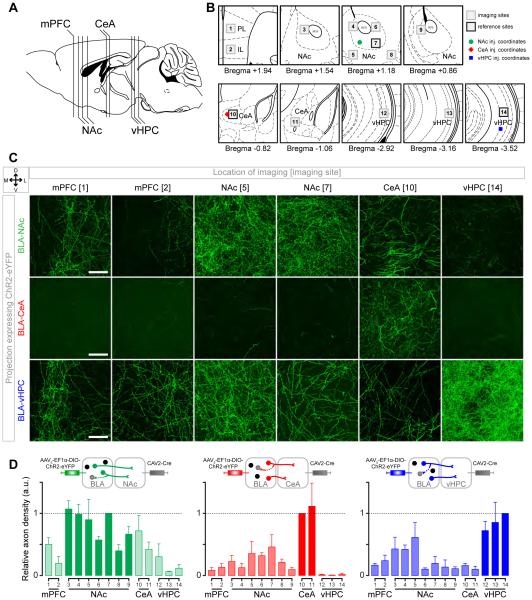
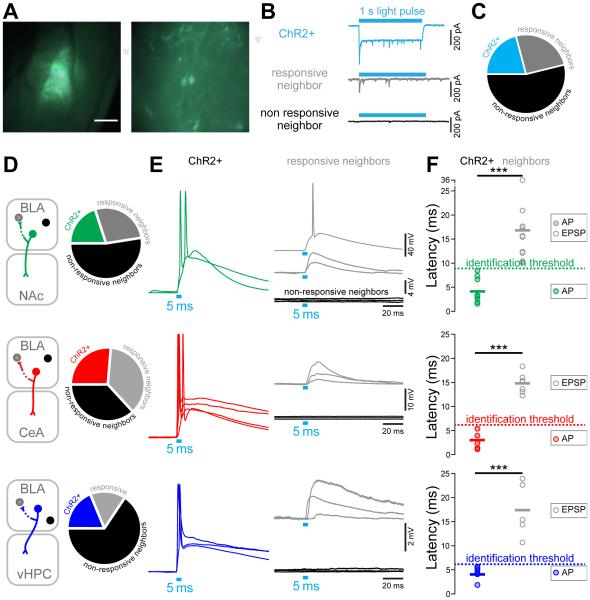
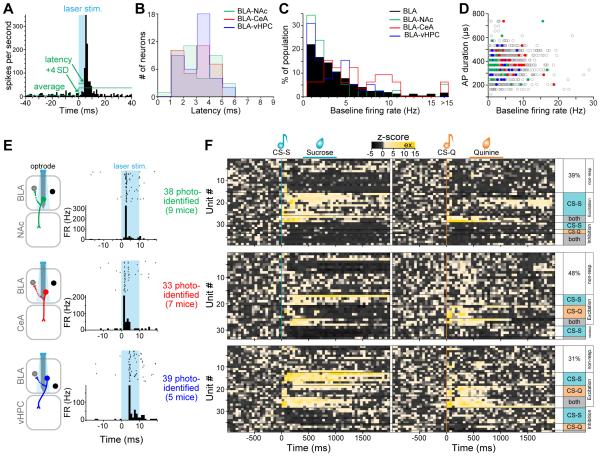
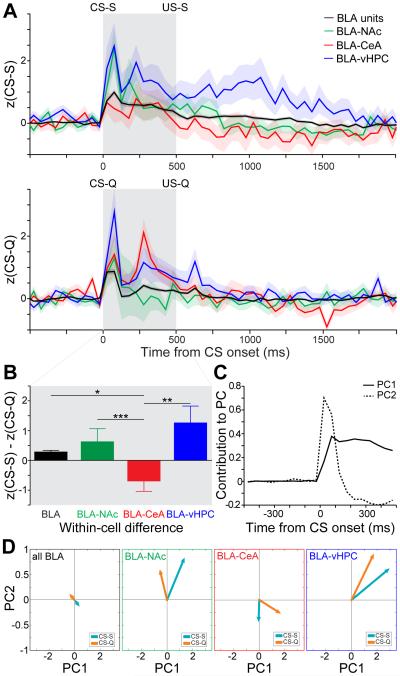
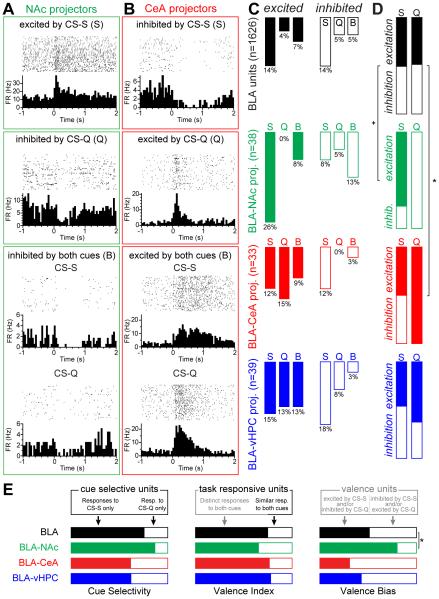
Although the basolateral amygdala (BLA) is known to play a critical role in the formation of memories of both positive and negative valence, the coding and routing of valence-related information is poorly understood. Here, we recorded BLA neurons during the retrieval of associative memories and used optogenetic-mediated phototagging to identify populations of neurons that synapse in the nucleus accumbens (NAc), the central amygdala (CeA), or ventral hippocampus (vHPC). We found that despite heterogeneous neural responses within each population, the proportions of BLA-NAc neurons excited by reward predictive cues and of BLA-CeA neurons excited by aversion predictive cues were higher than within the entire BLA. Although the BLA-vHPC projection is known to drive behaviors of innate negative valence, these neurons did not preferentially code for learned negative valence. Together, these findings suggest that valence encoding in the BLA is at least partially mediated via divergent activity of anatomically defined neural populations.


Figures

Figure 1
Figure 1. Experimental design and behavioral training
(A) Anterograde AAV5-EF1α-DIO-ChR2-eYFP was injected in the BLA and retrograde CAV2-cre was injected in one of the following downstream targets: NAc, CeA or vHPC. A head bar was cemented to the skull to enable subsequent head-fixed training and recording. The animals were exposed to one week of dual Pavlovian conditioning, wherein one conditioned stimulus (CS-S) predicted the delivery of a sucrose solution, and a different conditioned stimulus (CS-Q) predicted the delivery of a bitter solution (quinine). (B) Schematic of conditioning and retrieval task. On days 1-2, an auditory cue was paired with a sucrose delivery and on days 3-6, a second auditory cue was paired with quinine deliveries. The number of quinine cues was gradually increased from 10% to 50% of total trials. On days 7-8, during the retrieval of rewarding and aversive associations an optrode was inserted into the BLA to record neural activity, and laser stimulation was used to photoidentify neurons expressing ChR2. (C) Time courses of a reward trial (left panel) and an aversive trial (right panel). The cues were played for 4 s and a 3 μL drop of solution (sucrose or quinine) was delivered ~500 ms after the onset of the cue. Anticipatory licking before the sucrose delivery indicates acquisition of the reward association and no licking indicates expression of the aversive association. (D) Licking behavior of a representative mouse in response to the CS-S (left raster) and the CS-Q presentations (right raster) during a recording session. (E) Performance for the reward association (CS-S performance = sucrose trials with licks / number of sucrose trials) and for the aversive association (CS-Q performance = quinine trials without licks / number of quinine trials) increased during learning of the task (left panel) and the latency of the first lick after the CS-S onset decreased across training (right panel). The thinner lines represent the SEM, and the dashed line at 500 ms indicates the time of US delivery. (F) Licking behavior during the recording sessions, averaged across all animals. Left panel represents the licking behavior and right panel represents the probability of first lick in response to the cues. The shaded areas represent SEM. (G) Representative image of a recording track in the BLA. The recording optrode was coated with red fluorescent microspheres before insertion into the brain (left image, scale bar 500 μm The area containing the tip of the electrode in the BLA (white rectangle on the left image) is enlarged to the right. Scale bar reflects 20 μm. Blue is DAPI, green is eYFP and red is red fluorescent microspheres.
Figure 2
Figure 2. BLA units respond to matched modality sucrose and/or quinine cues
(A) Schematic of the optrode used to record neural activity. The blue quadrilateral represents the theoretical light cone. Right, the average waveform of 2 units isolated from one recording site (average ±99.7% confidence interval). (B) Peri-stimulus time histogram (PSTH) of the firing rate of a single unit, to the onset of 30 sucrose predicting cues (CS-S). For each unit, a Wilcoxon signed-rank test determined if the firing rate during the first 500 ms of the cue was significantly different from the 2 s baseline window (p<0.01). (C) 1626 BLA units were recorded from 21 mice. 810 (50%) had a significantly different firing rates during the first 500 ms of the cue compared to the 2 s before the cue (Wilcoxon signed rank test, p<0.01). 28% responded selectively to the CS-S, 9% to the CS-Q, 13% responded to both cues in the same way and less than 1% responded to both cues in an opposite way. (D) Heat maps of the z-score of all recorded units in response to the CS-S (vertical teal line, left map) and in response to the CS-Q (vertical orange line, right map). 26% of the units showed a significant excitatory response to one and/or the other auditory cue (Wilcoxon signed-rank test, p<0.01). 14% of the units were selectively excited by the CS-S and 4% by the CS-Q, while 7% were excited by both cues. 24% of the units showed a significant inhibitory response to one and/or the other cue. 14% were selectively inhibited by the CS-S and 5% by the CS-Q while 5% were inhibited by both cues. The black arrows indicate units responding to both cues in an opposite manner (top arrow: excited by the CS-S and inhibited by the CS-Q (0.5%); bottom arrow: inhibited by the CS-S and excited by the CS-Q (0.2%)). (E) Proportion of units responding to the rewarding cue only (CS-S selective), to the aversive cue only (CS-Q selective) or to both cues in the same way, with an inhibitory response (black) or with an excitatory response (yellow).
Figure 3
Figure 3. Evidence of collateralization of BLA projection neurons
(A) Sagittal view representing the relative position of brain sections imaged to quantify membrane fluorescence of neurites expressing ChR2-eYFP. (B) Coronal locations of the 14 sites imaged for each mouse. Locations proximal to the injection coordinates were used as reference sites (black outlines) to compare the fluorescence intensity with other imaging sites (gray outlines). (C) Confocal images containing a section of (from left to right): the prelimbic (PL) and infralimbic (IL) medial prefrontal cortex (mPFC), the NAc medial shell and lateral core, the medial CeA and the vHPC from one mouse expressing ChR2-eYFP in BLA-NAc projectors (top row), in BLA-CeA projectors (middle row), or in BLA-vHPC projectors (bottom row). Scale bars represent 50 μm. (D) Quantification of the fluorescent pixels per confocal image for each experimental group (BLA-NAc n=3 mice, except for mPFC where n=2, BLA-CeA n=4 mice and BLA-vHPC, n=3 mice). The relative axon density represents the fraction of fluorescent pixels normalized within each animal. The number of fluorescent pixels was obtained by thresholding the maximum intensity projection (MIP) of the confocal z-stack (>0.5, see Figure S3).
Figure 4
Figure 4. Empirical determination of photoresponse latency threshold ex vivo
(A) Left panel: differential interference contrast (DIC) image of a 300 μm thick coronal brain section of a mouse expressing ChR2-eYFP in BLA-NAc projectors, with green fluorescence image overlaid. Right panel: BLA-NAc projectors expressing ChR2-eYFP and recorded in whole-cell patch-clamp. (B) Representative peak/steady state current of a neuron expressing ChR2 (ChR2+, sky-blue trace) in response to a 1 s light pulse (sky-blue rectangle). In non-expressing neighboring cells, light stimulation either evoked a transient current (gray trace) or the cells did not respond (black trace). (C) Proportion of all cells recorded ex vivo expressing ChR2-eYFP (ChR2+, 21%, sky-blue), of responsive neighbors (25%, gray), and of non-responsive neighbors (54%, black). Numbers indicate the number of recorded neurons. (D) Proportion of ChR2+ neurons, responsive neighbors, and non-responsive neighbors recorded in the BLA of mice expressing ChR2-eYFP in BLA-NAc (green), BLA-CeA (red) or BLA-vHPC (dark blue) projectors. (E) Representative traces of neural responses to a 5 ms light pulse of BLA projectors expressing ChR2-eYFP (green, red or dark blue traces), in responsive neighbors (gray traces) and non-responsive neighbors (black traces). (F) Light evoked peak response latency in BLA-NAc, BLA-CeA and BLA-vHPC projectors expressing ChR2 and in non-expressing neighbors. Light evoked response latencies are significantly shorter in BLA-NAc (unpaired t-test, t17=4.64, ***p<0.001), BLA-CeA (unpaired ttest, t10=10.64, ***p<0.001) and BLA-vHPC (unpaired t-test, t9=5.62, ***plt;0.001) projectors compared to their non-expressing neighbors. The distribution of the latency in expressing and non-expressing cells was used to define the latency threshold for in vivo photoidentification (9 ms for BLA-NAc projectors and 6 ms for BLA-CeA and BLA-vHPC projectors).
Figure 5
Figure 5. Neural response of BLA projection neurons to cues predicting sucrose or quinine
(A) Photoresponse latencies in vivo were calculated by measuring the time from stimulation onset to the first bin in which firing rate increased at least four standard deviations (4 SD) above baseline. (B) No differences were detected in photoresponse latency distributions among BLA-NAc, BLA-CeA and BLA-vHPC projectors (Kolmogorov-Smirnov tests, p>0.05). (C) The distribution of firing rates in BLA-NAc and BLA-vHPC projectors was not different from the BLA distribution (Kolmogorov-Smirnov tests, p>0.05) while the firing rate distribution in BLA-CeA projectors was different from the BLA distribution (Kolmogorov-Smirnov tests, p<0.01). (D) Scatterplot depicting the action potential (AP) duration (peak-trough) as a function of the firing rate of all the recorded units (gray) and in the three photoidentified populations (BLA-NAc in green, BLA-CeA in red and BLA-vHPC in blue). (E) Representative examples of firing rate (FR) in response to 10 ms photostimulation for units photoidentified as BLA-NAc (green), BLA-CeA (red) or BLA-vHPC (blue) projectors. (F) Heat maps of the z-scores of all the units photoidentified as BLA-NAc projectors (top), BLA-CeA projectors (middle) or BLA-vHPC projectors (bottom) in response to the CS-S (teal line, left) and to the CS-Q (orange line, right).
Figure 6
Figure 6. Category-independent coding properties of BLA populations
We first analyzed responses within each population independent of qualitative classifications. (A) Z-score time courses averaged across all BLA units (black), all BLA-NAc projectors (green), all BLA-CeA projectors (red) or all BLA-vHPC projectors (blue), in response to the CS-S (upper panel) and in response to the CS-Q (bottom panel). Shaded areas represent the SEM. The gray shaded box depicts the interval from CS onset to US onset. (B) Difference between CS-S and CS-Q z-scores, averaged from the onset of the CS to the US delivery, for each BLA units (black bar) and for neurons of the three projector populations (green, red and blue bars). Positive values indicate greater magnitude responsiveness to the CS-S, while negative values indicate greater magnitude responsiveness to the CS-Q. BLA-CeA projectors respond more to the CS-Q than the CS-S compared to all other populations (Kruskal-Wallis test p<0.01, BLA-CeA post-hoc comparisons: to BLA-NAc ***p<0.001, to BLA *p<0.05, and to BLA-vHPC **p<0.01). (C) The z-score time course of each neuron from −500 ms to 500 ms relative to cue-onset was projected onto two-dimensions using principal component analysis (PCA). In order to visualize the time periods that contribute most significantly to the principal components depicted in (D), we plotted the contribution of each 50 ms time bin to principal component 1 (PC1) and principal component 2 (PC2). Bins prior to the cue onset did not contribute to either principal component, whereas the first time bins after CS onset contribute most strongly to PC2 and subsequent bins contribute to PC1. (D) Neural responses to the sucrose predictive cue (CS-S) and quinine predictive cue (CS-Q) in all BLA units, BLA-NAc, BLA-CeA and BLA-vHPC projector populations, visualized along PC1 and PC2. Neural dynamics in principal component (PC) space across all neurons in each population were averaged for each cue to obtain the position of the vectors.
Figure 7
Figure 7. Distinct roles in coding positive and negative valence defined by projection target
For these analyses, we grouped neurons based upon their qualitative response to the CS-S and CS-Q. (A) PSTHs of the firing rates (FR) of three units photoidentified as BLA-NAc projectors, one showing an excitatory response to the cue associated with sucrose (CS-S, top), one showing an inhibitory response to the cue associated with quinine (CS-Q, middle), and one showing an inhibitory response to both cues (B, bottom). (B) Perievent raster histograms of the firing rates of three units photoidentified as BLA-CeA projectors, one inhibited by the cue associated with sucrose (CS-S, top), one excited by the cue associated with quinine (CS-Q, middle) and one excited by both cues (B, bottom). (C) Distribution of units excited (left, filled bars) or inhibited (right, open bars) by the CS-S (S), by the CS-Q (Q), or by both cues in the same way (B), in all the BLA units (black), in the BLA-NAc photoidentified units (green), in the BLA-CeA photoidentified units (red) and in BLA-vHPC photoidentified units (blue). (D) Proportion of units excited and inhibited by the sucrose cue (S) or the quinine cue (Q), in the four neural populations. A larger proportion of BLA-NAc neurons (77%) showed phasic excitations to the CS-S than in the nonspecific BLA neural population as a whole (51%; binomial distribution, +p=0.093). A larger proportion of BLA-CeA neurons (100%) showed phasic excitation to the CS-Q than in the nonspecific BLA neural population (49%; binomial distribution, *p<0.05) (E) Valence definitions applied to all BLA units and the three projector populations. Cue selectivity: proportion of cue responsive cells responding exclusively to the sucrose cue (filled bars) or to the quinine cues (open bars). Valence index: proportion of task responsive cells encoding valence (including those responsive to only one cue, or responding oppositely to both cues; closed bars) compared to those responding in the same way to both cues. Valence bias: relative proportion of neurons responding to positive valence (filled bars) and negative valence (open bars). The BLA-NAc projector population has a greater proportion of cells encoding positive valence than the nonspecific BLA population based upon this valence bias metric (binomial distribution, *p<0.05).

Comment in

References

    1. Adhikari A. Distributed circuits underlying anxiety. Front. Behav. Neurosci. 2014;8:112. - PMC - PubMed
    1. Allsop SA, Vander Weele CM, Wichmann R, Tye KM. Optogenetic insights on the relationship between anxiety-related behaviors and social deficits. Front. Behav. Neurosci. 2014;8:241. - PMC - PubMed
    1. Ambroggi F, Ishikawa A, Fields HL, Nicola SM. Basolateral amygdala neurons facilitate reward-seeking behavior by exciting nucleus accumbens neurons. Neuron. 2008;59:648–661. - PMC - PubMed
    1. Amorapanth P. Lesions of Periaqueductal Gray Dissociate-Conditioned Freezing From Conditioned Suppression Behavior in Rats. Learn. Mem. 1999;6:491–499. - PMC - PubMed
    1. Ben-Ari Y, Tremblay E, Ottersen OP. Injections of kainic acid into the amygdaloid complex of the rat: an electrographic, clinical and histological study in relation to the pathology of epilepsy. Neuroscience. 1980;5:515–528. - PubMed

Publication types

LinkOut - more resources