. 2016 Apr 4:7:11206.
doi: 10.1038/ncomms11206.

Immediate ecotoxicological effects of short-lived oil spills on marine biota

Affiliations

Immediate ecotoxicological effects of short-lived oil spills on marine biota

Corina P D Brussaard et al. Nat Commun. .

Abstract

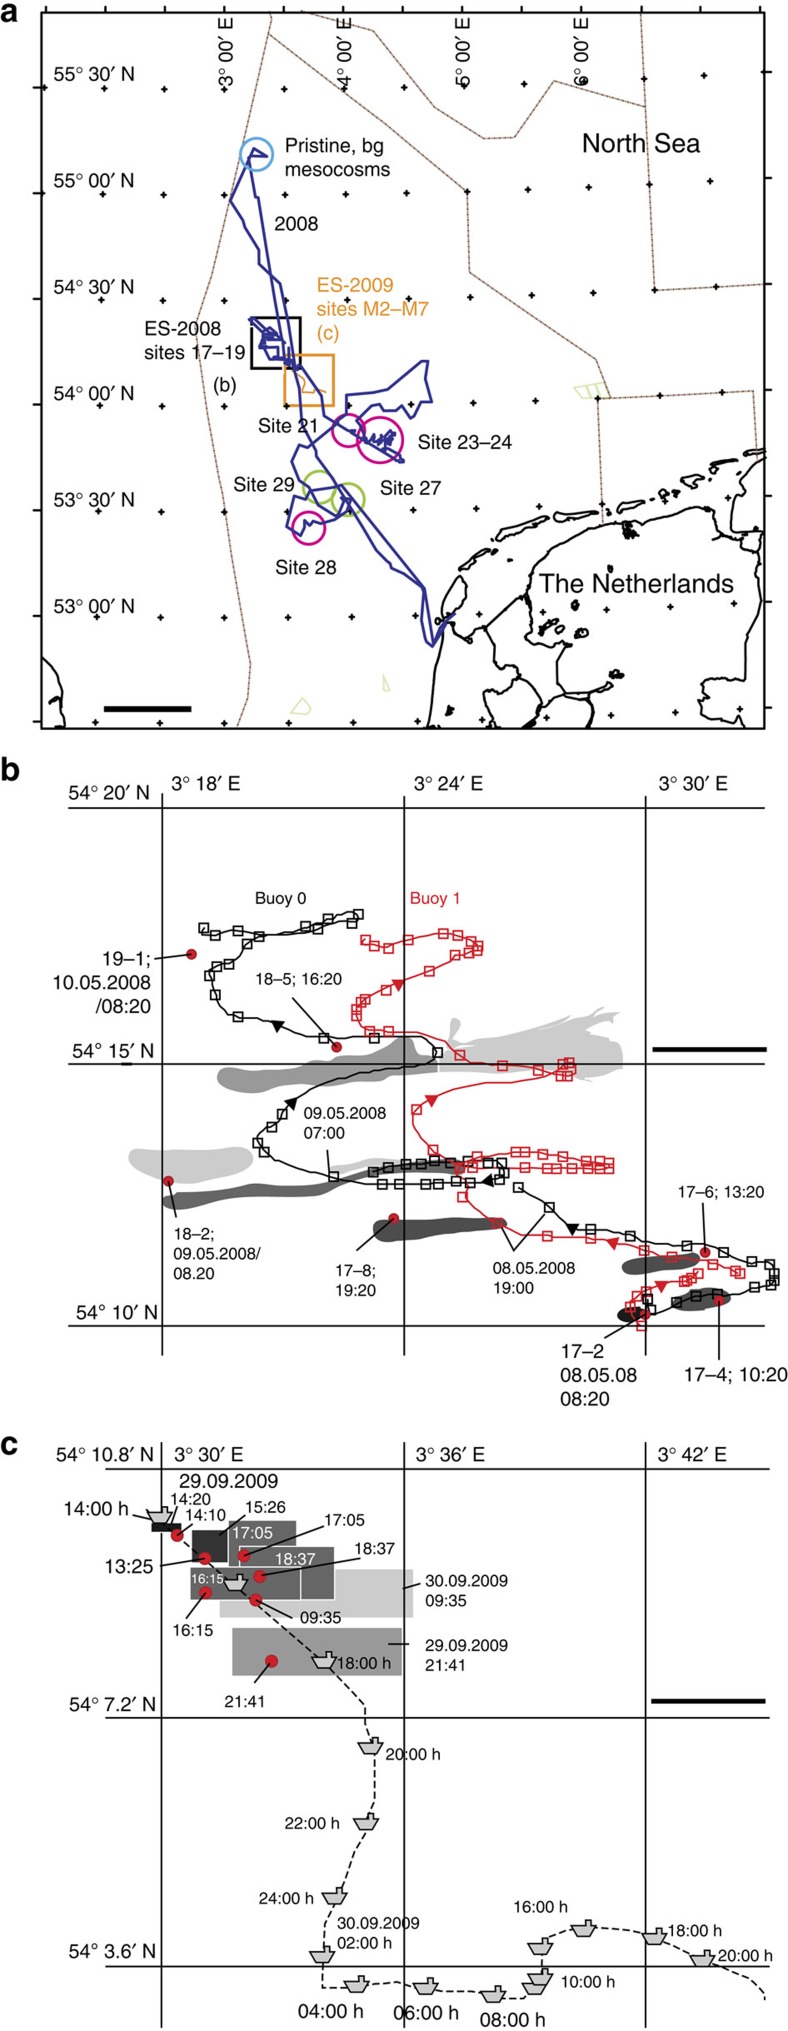
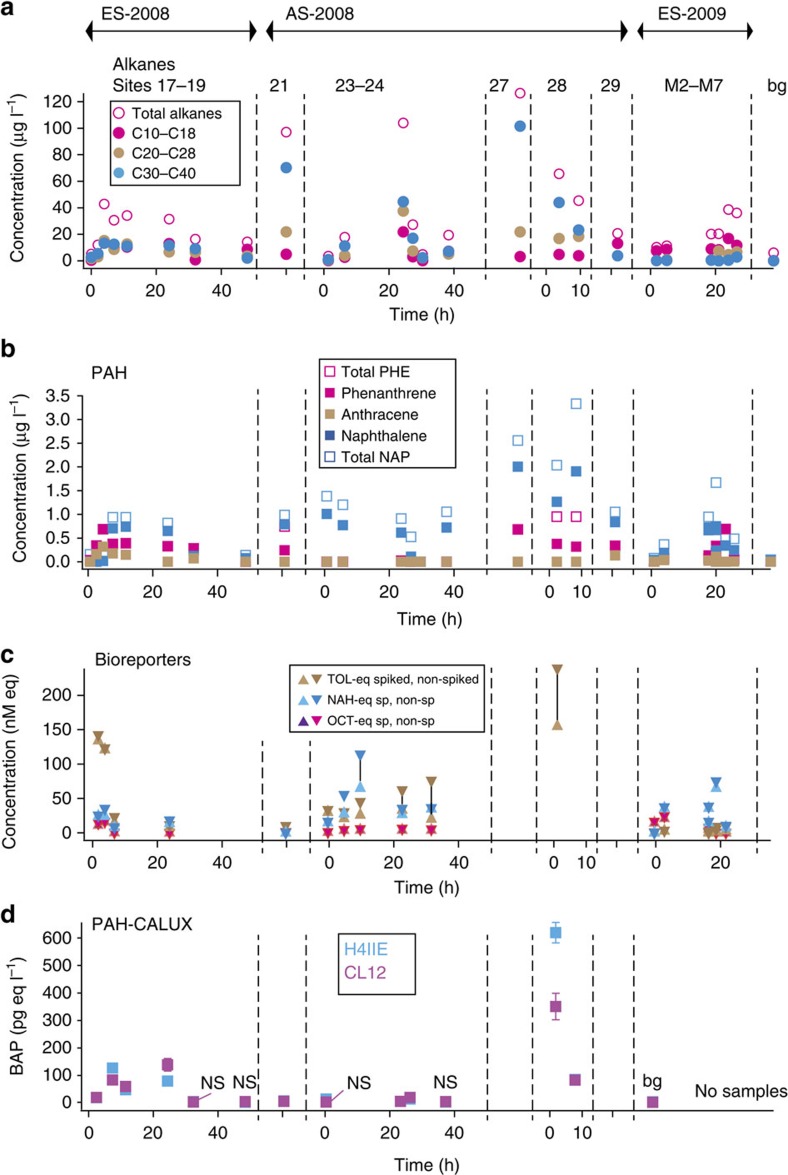
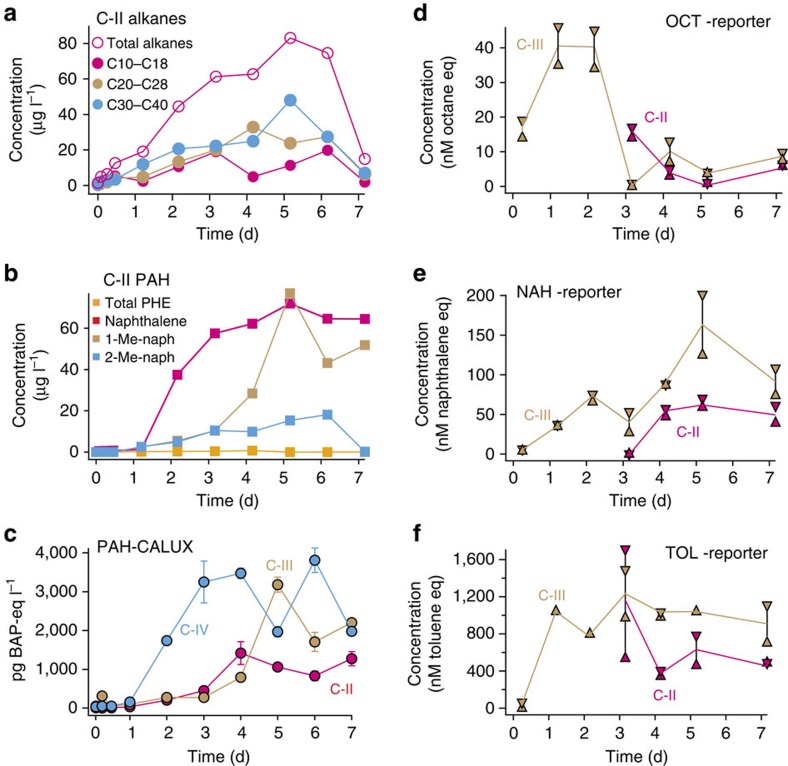
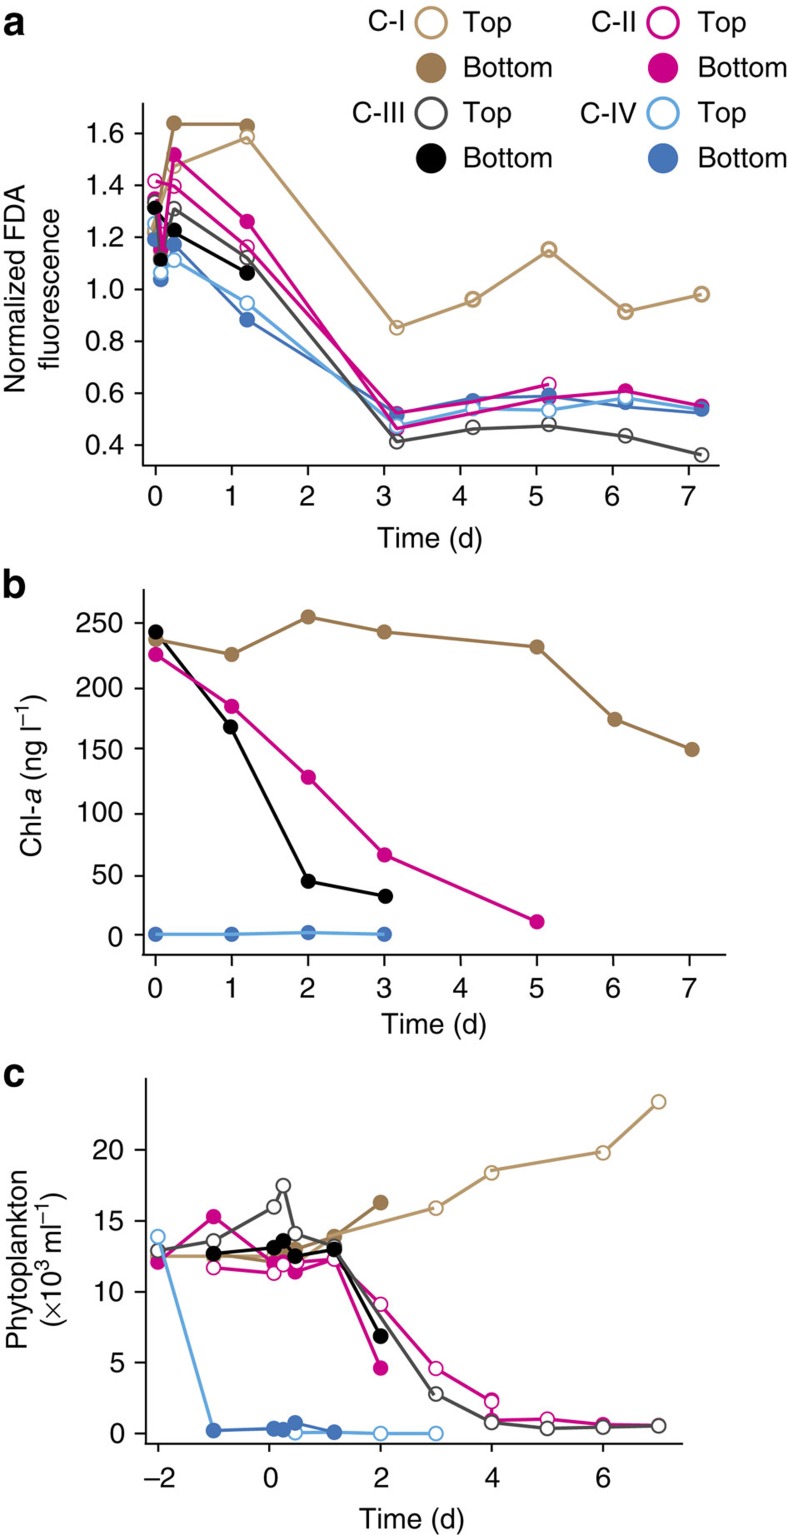
Marine environments are frequently exposed to oil spills as a result of transportation, oil drilling or fuel usage. Whereas large oil spills and their effects have been widely documented, more common and recurrent small spills typically escape attention. To fill this important gap in the assessment of oil-spill effects, we performed two independent supervised full sea releases of 5 m(3) of crude oil, complemented by on-board mesocosm studies and sampling of accidentally encountered slicks. Using rapid on-board biological assays, we detect high bioavailability and toxicity of dissolved and dispersed oil within 24 h after the spills, occurring fairly deep (8 m) below the slicks. Selective decline of marine plankton is observed, equally relevant for early stages of larger spills. Our results demonstrate that, contrary to common thinking, even small spills have immediate adverse biological effects and their recurrent nature is likely to affect marine ecosystem functioning.


Figures

Figure 1
Figure 1. Overview of the experimental and accidental open sea spill locations on the North Sea.
(a) Comparative locations of experimental spills (ES) ES-2008 (sites 17–19) and ES-2009 (sites M2–M7), the location of sampling of the pristine seawater for the mesocosms and for background (bg) controls, and further sampling sites (21, 23–24 and 28, with visible slicks, magenta; sites 27 and 29, no visible slicks, green). (b) Enlargement of the ES-2008 area with the location of the sampling sites, the visual aspect of the slick development (in grey: lighter shades representing thinner oil sheens on the surface) and the traces of both tracking buoys (red and grey squares). (c) ES-2009 with the schematic aspect of the slick (grey) over time (red, observation points), and the location of the research/survey vessel Arca (boat symbol). Times in MET. Scale bar, 50 km (a); 3 km (b,c).
Figure 2
Figure 2. Overview of dissolved oil compound concentrations measured in both experimental (ES) and accidental spills (AS) at −1.5-m depth.
(a) Total extracted and summed alkane concentrations by chemical analysis. (b) Total extracted selected polycyclic aromatic hydrocarbon (PAH) concentrations (NAP, naphthalenes; PHE, phenanthrenes) by the chemical analysis. (c) Bioavailable alkane (OCT-eq, essentially C5–C10 linear alkanes), toluene (TOL-eq, essentially the group of toluene, benzene, ethylbenzene, m- and p-xylene) and naphthalene (NAH-eq, essentially naphthalene, phenanthrene and mono-methyl derivatives) concentrations (in nM compound-equivalent) measured in on-board bacterial bioreporter assays. High and low values correspond to averages determined from triplicate assays spiked or not with 50–100 nM pure standard (variations from triplicate assays is 5–10% of the arithmetic mean). (d) Benzo[a]pyrene (BAP) concentrations (pg l−1) equivalent to the response elicited by seawater samples in the rat hepatoma cell line-based PAH-CALUX toxicity assays (H4IIE and CL12 (ref. 28)). Data points are the mean from triplicate assays on the same sample. Error bars denote calculated s.d.'s. NS, nonsignificantly different from seawater background (bg), average from three ES-2008 pristine locations. Note that time axis for ES is the time after spill release; for AS it means the time after encounter of the spill.
Figure 3
Figure 3. Mesocosm dissolved oil compound concentrations.
(a) Total extracted selected summed alkane concentrations by chemical analysis over time in mesocosm C-II (2 l crude oil dosed per m3) measured at the bottom tap (25 cm above container floor). (b) Total extracted selected polyaromatic hydrocarbon (PAH) concentrations by chemical analysis. Total PHE, sum of phenanthrene and methylphenanthrenes. 1-Me- and 2-Me-naph, 1- and 2-methylnaphthalene, respectively. (c) Toxicity equivalent of pg benzo[a]pyrene (BAP) per litre in bottom-sampled mesocosm vessels (C-II; 2 l and C-III, 5.5 l crude oil dosed per m3; C-IV, 2 l crude oil but ultraviolet treated) in the rat hepatoma cell line-based PAH-CALUX bioassay. Data points are the mean from triplicate assays on the same sample. Error bars denote calculated s.d.'s (df) Bioavailable alkane (OCT-eq, essentially C5–C10 linear alkanes), toluene (TOL-eq, essentially the group of toluene, benzene, ethylbenzene, m- and p-xylene) and naphthalene (NAH-eq, essentially naphthalene, phenanthrene and mono-methyl derivatives) measured in the bacterial bioreporter assays. Concentrations expressed as nM equivalent standard. High and low values correspond to averages determined from triplicate assays spiked or not with 50–100 nM pure standard (variations from triplicate assays is 5–10% of the arithmetic mean). d, days.
Figure 4
Figure 4. Phytoplankton responses to oil pollution in the mesocosms.
(a) Viability of Micromonas pusilla exposed to mesocosm samples, expressed as fluorescence released from stainings with fluorescein diacetate (FDA) normalized to an incubation in control medium (=1). (b) Total chlorophyll-a (Chl-a) concentrations (ng l−1) over time in the mesocosm vessels. (c) Total phytoplankton abundance (flow cytometric analysis, cells<20 μm) over time in the four mesocosms at the top (open symbols) and bottom (closed symbols) of the containers. Mesocosm indications: C-I, non-contaminated; C-II, 2 l crude oil per m3; C-III, 5.5 l crude oil per m3; C-IV, 2 l crude oil, ultraviolet treated. Note that time=0 refers to the moment of oil addition. UV treatment of C-IV was done at t=–2 d. top (70 cm above container floor) and bottom (25 cm) refer to sampling ports on the mesocosm vessel. d, days.

References

    1. Kemsley J. Reckoning with oil spills. Chem. Eng. News 93, 8–12 (2015) .
    1. Joye S. B. Deepwater Horizon, 5 years on. Science 349, 592–593 (2015) . - PubMed
    1. The International Tanker Owners Pollution Federation Ltd. Oil tanker spill statistics 2014. Available at www.itopf.com/.../data/.../Oil_Spill_Stats_2014FINALlowres.pdfITOPF, London, UK (2015) .
    1. Yin F., Hayworth J. S. & Clement T. P. A tale of two recent spills-comparison of 2014 Galveston Bay and 2010 Deepwater Horizon oil spill residues. PLoS ONE 10, e0118098 (2015) . - PMC - PubMed
    1. Incardona J. P. et al. Deepwater Horizon crude oil impacts the developing hearts of large predatory pelagic fish. Proc. Natl Acad. Sci. USA 111, E1510–E1518 (2014) . - PMC - PubMed

Publication types