

Computer Aided Detection System for Prediction of the Malaise during Hemodialysis
- PMID: 27042200
- PMCID: PMC4799825
- DOI: 10.1155/2016/8748156
Computer Aided Detection System for Prediction of the Malaise during Hemodialysis
Abstract
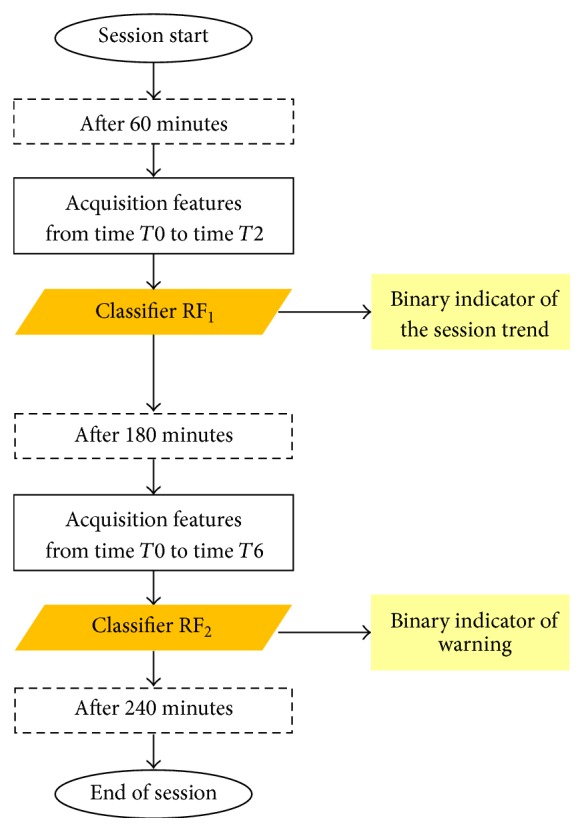
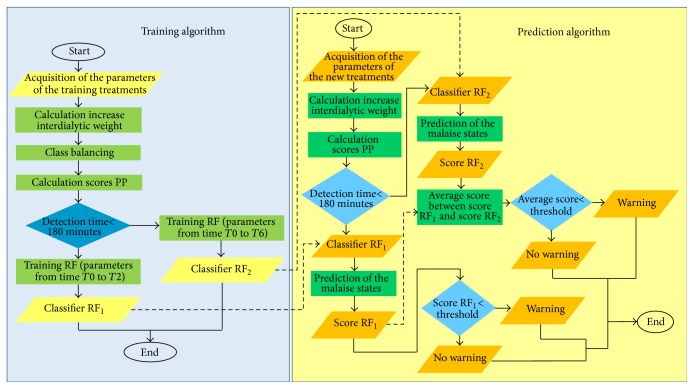
Monitoring of dialysis sessions is crucial as different stress factors can yield suffering or critical situations. Specialized personnel is usually required for the administration of this medical treatment; nevertheless, subjects whose clinical status can be considered stable require different monitoring strategies when compared with subjects with critical clinical conditions. In this case domiciliary treatment or monitoring can substantially improve the quality of life of patients undergoing dialysis. In this work, we present a Computer Aided Detection (CAD) system for the telemonitoring of patients' clinical parameters. The CAD was mainly designed to predict the insurgence of critical events; it consisted of two Random Forest (RF) classifiers: the first one (RF1) predicting the onset of any malaise one hour after the treatment start and the second one (RF2) again two hours later. The developed system shows an accurate classification performance in terms of both sensitivity and specificity. The specificity in the identification of nonsymptomatic sessions and the sensitivity in the identification of symptomatic sessions for RF2 are equal to 86.60% and 71.40%, respectively, thus suggesting the CAD as an effective tool to support expert nephrologists in telemonitoring the patients.
Figures
References
-
- Chronic kidney disease a challenge for european healthcare systems, 2015, http://www.era-edta2015.org/press/1_150526_18.00_Press%20Release_CKD_Cha....
-
- Whole systems demonstrators: an overview of telecare and telehealth. 2009, http://webarchive.nationalarchives.gov.uk/20130107105354/http://www.dh.g....
MeSH terms
LinkOut - more resources
Full Text Sources
Other Literature Sources
Medical
Miscellaneous
