. 2016 Jan 1;3(3):154-65.
doi: 10.1002/acn3.274. eCollection 2016 Mar.

CSF Aβ42/Aβ40 and Aβ42/Aβ38 ratios: better diagnostic markers of Alzheimer disease

Affiliations

CSF Aβ42/Aβ40 and Aβ42/Aβ38 ratios: better diagnostic markers of Alzheimer disease

Shorena Janelidze et al. Ann Clin Transl Neurol. .

Abstract

Objective: The diagnostic accuracy of cerebrospinal fluid (CSF) biomarkers for Alzheimer's disease (AD) must be improved before widespread clinical use. This study aimed to determine whether CSF Aβ42/Aβ40 and Aβ42/Aβ38 ratios are better diagnostic biomarkers of AD during both predementia and dementia stages in comparison to CSF Aβ42 alone.

Methods: The study comprised three different cohorts (n = 1182) in whom CSF levels of Aβ42, Aβ40, and Aβ38 were assessed. CSF Aβs were quantified using three different immunoassays (Euroimmun, Meso Scale Discovery, Quanterix). As reference standard, we used either amyloid ((18)F-flutemetamol) positron emission tomography (PET) imaging (n = 215) or clinical diagnosis (n = 967) of well-characterized patients.

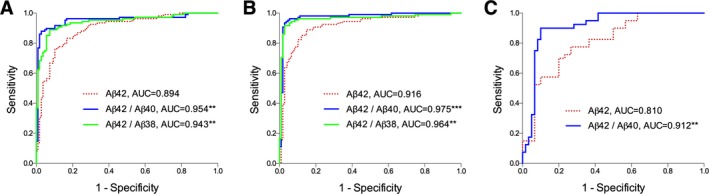
Results: When using three different immunoassays in cases with subjective cognitive decline and mild cognitive impairment, the CSF Aβ42/Aβ40 and Aβ42/Aβ38 ratios were significantly better predictors of abnormal amyloid PET than CSF Aβ42. Lower Aβ42, Aβ42/Aβ40, and Aβ42/Aβ38 ratios, but not Aβ40 and Aβ38, correlated with smaller hippocampal volumes measured by magnetic resonance imaging. However, lower Aβ38, Aβ40, and Aβ42, but not the ratios, correlated with non-AD-specific subcortical changes, that is, larger lateral ventricles and white matter lesions. Further, the Aβ42/Aβ40 and Aβ42/Aβ38 ratios showed increased accuracy compared to Aβ42 when distinguishing AD from dementia with Lewy bodies or Parkinson's disease dementia and subcortical vascular dementia, where all Aβs (including Aβ42) were decreased.

Interpretation: The CSF Aβ42/Aβ40 and Aβ42/Aβ38 ratios are significantly better than CSF Aβ42 to detect brain amyloid deposition in prodromal AD and to differentiate AD dementia from non-AD dementias. The ratios reflect AD-type pathology better, whereas decline in CSF Aβ42 is also associated with non-AD subcortical pathologies. These findings strongly suggest that the ratios rather than CSF Aβ42 should be used in the clinical work-up of AD.


Figures

Figure 1
Figure 1
ROC curves of CSF Aβ42 and the Aβ42/Aβ40 and Aβ42/Aβ38 ratios for discriminating abnormal (≥1.42) and normal (<1.42) amyloid PET. Aβ isoforms were measured in 108 PET‐positive and 107 PET‐negative cases using the Euroimmun (A) and MSD (B) immunoassays, and in 40 PET‐positive and 30 PET‐negative cases using the Quanterix immunoassay (C); **P < 0.01, ***P < 0.001 when comparing to Aβ42 AUC. ROC, receiver operating characteristic; CSF, cerebrospinal fluid; PET, positron emission tomography; MSD, Meso Scale Discovery; AUC, area under the curve.
Figure 2
Figure 2
Scatterplots of CSF Aβ42 and the Aβ42/Aβ40 and Aβ42/Aβ38 ratios and amyloid PET SUVR values. (A–C) depict CSF values derived from the Euroimmun immunoassay. Horizontal lines represent optimal cutoffs for Aβ42 (A, cut off 507.5 pg/mL, 83% was identified identically with CSF and PET), Aβ42/Aβ40 (B, cut off 0.10, 93% was identified identically with CSF and PET) and Aβ42/Aβ38 (C, cut off 0.29, 91% was identified identically with CSF and PET) corresponding to the highest Youden's J indices. (D and E) depict CSF values derived from the MSD immunoassay. Horizontal lines represent optimal cutoffs for Aβ42 (D, cut off 495.9 pg/mL, 87% was identified identically with CSF and PET), Aβ42/Aβ40 (E, cut off 0.09, 95% was identified identically with CSF and PET) and Aβ42/Aβ38 (F, cut off 0.17, 93% was identified identically with CSF and PET). The PET cutoff 1.42 has been defined previously.20 CSF, cerebrospinal fluid; PET, positron emission tomography; SUVR, standardized uptake value ratio.
Figure 3
Figure 3
Effects of using the CSF Aβ42/Aβ40 ratio instead of the CSF Aβ42 measurement alone. The CSF values derived from the EI assay are given in (A and B) and values from the MSD assay are given in (C and D). (A and C) depict the differences between standardized CSF Aβ42/Aβ40 ratio and CSF Aβ42 (y‐axis) as a function of amyloid PET (x‐axis). Cases where the ratio was lower than CSF Aβ42 alone are indicated by solid gray lines and cases where the ratio was higher than CSF Aβ42 alone are indicated by dashed red lines. A local regression line suggested that the ratio adjusted the results upwards mainly in the low amyloid PET range and downwards mainly in the medium‐high amyloid PET range. (B and D) depict the change in classification of subjects when using the CSF Aβ42/Aβ40 ratio instead of CSF Aβ42 alone (based on cutoffs presented in Table 1). Green and red circles indicate that subjects were consistently classified as normal or pathological, respectively, when using CSF Aβ42 alone or the ratio. Blue dots indicate that subjects changed classification from pathological to normal when using the ratio, and orange dots indicate that subjects changed classification from normal to pathological when using the ratio. CSF, cerebrospinal fluid; EI, Euroimmun; MSD, Meso Scale Discovery; PET, positron emission tomography.
Figure 4
Figure 4
Aβ42, Aβ40, Aβ38, Aβ42/Aβ40 ratio, and Aβ42/Aβ38 ratio in the CSF of patients with different forms of dementia, sMCI and healthy controls. (A–E) Aβ42, Aβ40, Aβ38, Aβ42/Aβ40 ratio, and Aβ42/Aβ38 ratio in the CSF of healthy controls (n = 53) and patients with sMCI (n = 62 for Aβ42, Aβ40; n = 61 for Aβ38), AD (n = 110), PDD/DLB (n = 47), VaD (n = 34 for Aβ42, Aβ40; n = 33 for Aβ38) and FTD (n = 33). Data are presented as mean ± 95% CI; p values are from univariate general linear models controlling for age and sex; *P < 0.05; **P < 0.01; ***P < 0.001, ****P < 0.0001. (F) ROC curves of CSF Aβ42, Aβ42/Aβ40 ratio and Aβ42/Aβ38 ratio for discriminating AD from non‐AD dementias; ***P < 0.001 when comparing to Aβ42 AUC. CSF, cerebrospinal fluid; sMCI, stable mild cognitive impairment; AD, Alzheimer's disease; PDD, Parkinson's disease with dementia; DLB, dementia with Lewy bodies; VaD, vascular dementia; FTD, frontotemporal dementia; ROC, receiver operating characteristic; AUC, area under the curve.

References

    1. Wilquet V, De Strooper B. Amyloid‐beta precursor protein processing in neurodegeneration. Curr Opin Neurobiol 2004;14:582–588. - PubMed
    1. Portelius E, Price E, Brinkmalm G, et al. A novel pathway for amyloid precursor protein processing. Neurobiol Aging 2011;32:1090–1098. - PubMed
    1. Meisl G, Yang X, Hellstrand E, et al. Differences in nucleation behavior underlie the contrasting aggregation kinetics of the Abeta40 and Abeta42 peptides. Proc Natl Acad Sci USA 2014;111:9384–9389. - PMC - PubMed
    1. Sanchez L, Madurga S, Pukala T, et al. Abeta40 and Abeta42 amyloid fibrils exhibit distinct molecular recycling properties. J Am Chem Soc 2011;133:6505–6508. - PubMed
    1. Iwatsubo T, Odaka A, Suzuki N, et al. Visualization of A beta 42(43) and A beta 40 in senile plaques with end‐specific A beta monoclonals: evidence that an initially deposited species is A beta 42(43). Neuron 1994;13:45–53. - PubMed