. 2016 Feb 1;3(3):166-79.
doi: 10.1002/acn3.293. eCollection 2016 Mar.

Insufficient disease inhibition by intrathecal rituximab in progressive multiple sclerosis

Affiliations

Insufficient disease inhibition by intrathecal rituximab in progressive multiple sclerosis

Mika Komori et al. Ann Clin Transl Neurol. .

Abstract

Objective: Inaccessibility of the inflammation compartmentalized to the central nervous system (CNS) may underlie the lack of efficacy of immunomodulatory treatments in progressive multiple sclerosis (MS). The double blind combination of Rituximab by IntraVenous and IntraThecAl injection versus placebo in patients with Low-Inflammatory SEcondary progressive MS (RIVITALISE; NCT01212094) trial was designed to answer: (1) Whether an induction dose of intravenous and intrathecal rituximab efficiently depletes CNS B cells? and (2) If so, whether this leads to global inhibition of CNS inflammation and slowing of CNS tissue destruction?

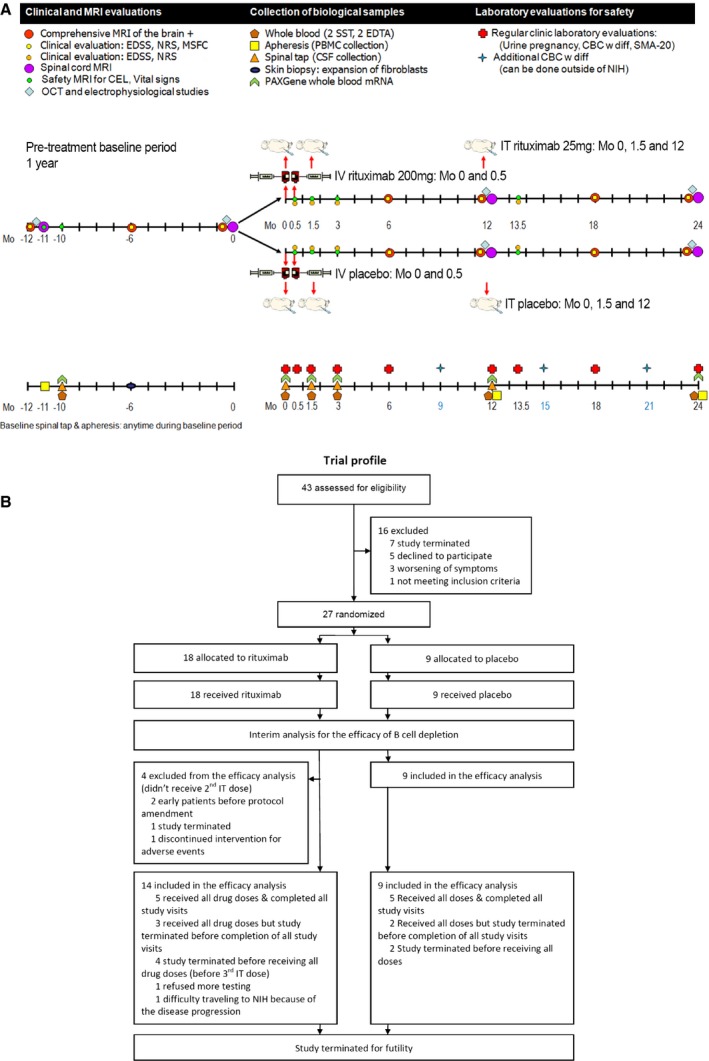
Methods: Patients aged 18-65 years were randomly assigned to rituximab or placebo. Protocol-stipulated interim analysis quantified the efficacy of B-cell depletion.

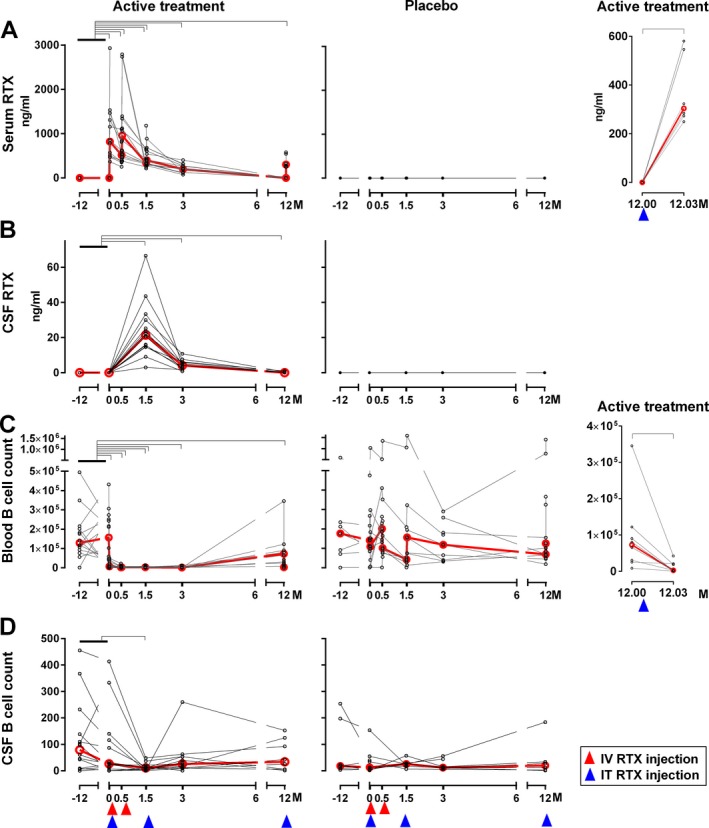
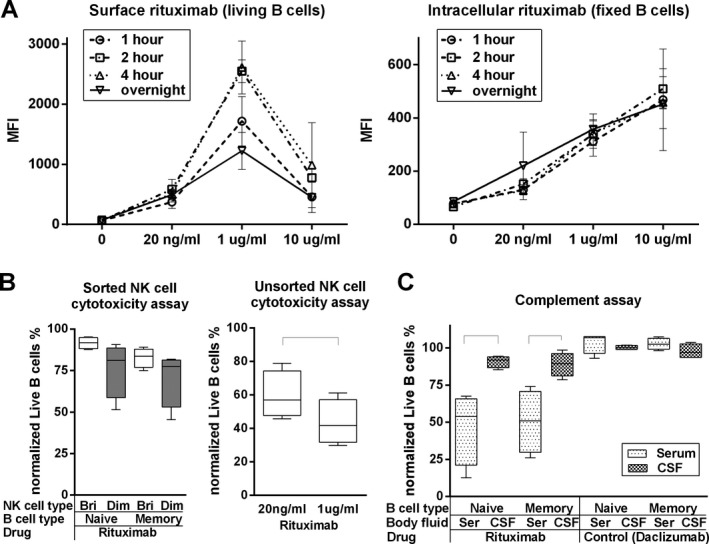
Results: The efficacy on cerebrospinal fluid (CSF) biomarkers failed to reach criteria for continuation of the trial. B-cell-related CSF biomarkers (sCD21 and B-cell activating factor) changed only in the active-treatment arm. While CSF B cells were killed robustly (median -79.71%, P = 0.0176), B cells in CNS tissue were depleted inadequately (~-10-20%, P < 0.0001). Consequently, the T-cell-specific CSF biomarker sCD27 decreased slightly (-10.97%, P = 0.0005), while axonal damage marker, neurofilament light chain did not change. Insufficient saturation of CD20, lack of lytic complement, and paucity of cytotoxic CD56(dim) NK cells contribute to decreased efficacy of rituximab in the CNS.

Interpretation: Biomarker studies reliably quantified complementary pharmacodynamic effects of rituximab in the CNS, exposed causes for poor efficacy and determined that RIVITALISE trial would be underpowered to measure efficacy on clinical outcomes. Identified mechanisms for poor efficacy are applicable to all CNS-inflammation targeting monoclonal antibodies.


Figures

Figure 1
Figure 1
Trial design. (A) Trial design scheme; (B) CONSORT trial diagram. IT, intrathecal; NIH, National Institutes of Health.
Figure 2
Figure 2
Intrathecal dosing leads to measurable cerebrospinal fluid (CSF) concentrations of rituximab sustained for several months, but depletion of CSF B cells is incomplete and transient. Free rituximab (RTX) levels in the serum (A) and CSF (B) were measured in coded samples (active‐treatment cohort: n = 14, placebo cohort: n = 9) using electrochemiluminescence assay. Absolute number of CD19‐positive B cells in blood (C) and CSF (D) were counted by flow cytometry. Red lines show median values of biomarkers at each follow‐up visit. Red and blue arrows show the timing of intravenous (IV) or intrathecal (IT) injection of rituximab or placebo, respectively. Black brackets represent statistical significance (P < 0.05) based on adjusted P‐value (Dunnett's method). Concentrations of rituximab and counts of B cells in blood and CSF for the active‐treatment cohort (left panels) and placebo (middle panels) were compared to baseline (average of visit Months ‐12 and 0) and each follow‐up visit (serum: Months 0.5, 0.53, 1.5, 1.53, 3, 12, and 12.03; CSF: Months 1.5, 3, and 12). Additionally, concentration of rituximab in serum and absolute numbers of the blood B cell number (right panels) for the active‐treatment cohort was compared between visit Months 12 and 12.03 (Tukey's method).
Figure 3
Figure 3
Soluble B‐cell‐related biomarkers corroborate robust and lasting depletion of blood B cells, but poor depletion of central nervous system B cells by rituximab (RTX) treatment. Concentration of serum and cerebrospinal fluid (CSF) B‐cell activating factor (BAFF) (A), C‐X‐C motif chemokine 13 (CXCL13) (B), and soluble CD21 (sCD21) (C) were measured in coded samples (active‐treatment cohort: n = 14, placebo cohort: n = 9; placebo data not shown) using electrochemiluminescence assay. Red lines show median values of biomarkers at each follow‐up visit. Red and blue arrows show the timing of intravenous (IV) or intrathecal (IT) injection of RTX. Black brackets represent statistical significance (P < 0.05) based on adjusted P‐value (Dunnett's method). Concentrations of BAFF, CXCL13, and sCD21 were compared between baseline (average of visit Months ‐12 and 0) and each follow‐up visit (serum: Months 0.5, 0.53, 1.5, 1.53, 3, 12, and 12.03; CSF: Months 1.5, 3, and 12).
Figure 4
Figure 4
The low levels of complement components in the cerebrospinal fluid (CSF) underlies poor B‐cell depletion in the intrathecal compartment. (A) In vitro B‐cell surface and intracellular rituximab saturation assay. Purified B cells were cultured in the absence or presence of different concentrations of rituximab (10 μg/mL, 1 μg/mL [average serum concentration in current study], 20 ng/mL [average CSF concentration in current study], using time‐assay (1, 2, 4 h or overnight). Surface or intracellular rituximab mean fluorescence intensity (MFI) of living or fixed B cells was measured by flow cytometry. Error bars represent standard deviation (SD). (B left) In vitro NK cell cytotoxicity assay. Sorted CD56dim or CD56bright NK cells and negatively purified naïve and memory B cells were obtained. Each NK cell type was seeded with equal number of either Naïve B cells or Memory B cells for 6 h, in the presence of 1 μg/mL of rituximab. Cytotoxicity of NK cells to B cells was calculated as: % cytotoxicity = (relative B cell numbers in the sample/relative B cell numbers in B cell control) × 100. (B right) In vitro rituximab dose‐dependent NK cell cytotoxicity assay. Negatively selected NK cells were cultured for 6 h with equal number of negatively selected B cells, in the presence of either 1 μg/mL or 20 ng/mL of rituximab. Cytotoxicity of NK cells to B cells was determined by the % cytotoxicity formula. Black brackets represent statistical significant (P < 0.05) difference between the two conditions based on the paired t‐test. (C) In vitro B cell cytotoxicity assay. Negatively purified naïve and memory B cells was cultured 4 h with rituximab (1 μg/mL) or a control antibody (daclizumab: 1 μg/mL) in the presence of 50% serum or pooled multiple sclerosis CSF samples (to assure identical conditions for all donors). Cytotoxicity of NK cells to B cells was determined by the % cytotoxicity formula. Black brackets represent statistical significant (P < 0.05) difference between the two conditions based on the paired t‐test.
Figure 5
Figure 5
Clinical scores showed tendency for worsening during the observation period for both treated and placebo groups. (A) Clinical scores of expanded disability status scale (EDSS), Scripps neurological rating scale (NRS), and multiple sclerosis functional composite (MSFC) for patients in active treatment and placebo cohorts. (B) Average cumulative contrast‐enhancing lesion (CEL) counts on brain MRI for patients in active treatment and placebo cohorts.
Figure 6
Figure 6
Schematic representation of differences between blood and intrathecal compartment that underlie poor efficacy of rituximab in depleting CNS B cells. CSF, cerebrospinal fluid; CNS, central nervous system; NK cell, natural killer cell.

References

    1. Stys PK, Zamponi GW, van Minnen J, Geurts JJ. Will the real multiple sclerosis please stand up? Nat Rev Neurosci 2012;13:507–514. - PubMed
    1. Magliozzi R, Howell O, Vora A, et al. Meningeal B‐cell follicles in secondary progressive multiple sclerosis associate with early onset of disease and severe cortical pathology. Brain 2007;130(Pt 4):1089–1104. - PubMed
    1. Frischer JM, Bramow S, Dal‐Bianco A, et al. The relation between inflammation and neurodegeneration in multiple sclerosis brains. Brain 2009;132(Pt 5):1175–1190. - PMC - PubMed
    1. Komori M, Blake A, Greenwood M, et al. CSF markers reveal intrathecal inflammation in progressive multiple sclerosis. Ann Neurol 2015;78:3–20. - PMC - PubMed
    1. Wuest SC, Mexhitaj I, Chai NR, et al. A complex role of herpes viruses in the disease process of multiple sclerosis. PLoS ONE 2014;9:e105434. - PMC - PubMed