. 2016 Feb 1;3(3):216-25.
doi: 10.1002/acn3.290. eCollection 2016 Mar.

Plasma neurofilament light chain predicts progression in progressive supranuclear palsy

Affiliations

Plasma neurofilament light chain predicts progression in progressive supranuclear palsy

Julio C Rojas et al. Ann Clin Transl Neurol. .

Abstract

Objective: Blood-based biomarkers for neurodegenerative conditions could improve diagnosis and treatment development. Neurofilament light chain (NfL), a marker of axonal injury, is elevated in cerebrospinal fluid (CSF) of patients with progressive supranuclear palsy (PSP). The goal of this study was to determine the diagnostic and prognostic value of plasma NfL in patients with PSP.

Methods: Plasma NfL was measured with ultrasensitive digital immunoassay-based technology at baseline and 1-year follow-up in a pilot cohort of 15 PSP patients and 12 healthy controls, and a validation cohort of 147 PSP patients. Mixed linear models tested the ability of plasma NfL to predict neurological, cognitive and functional decline, and brain atrophy.

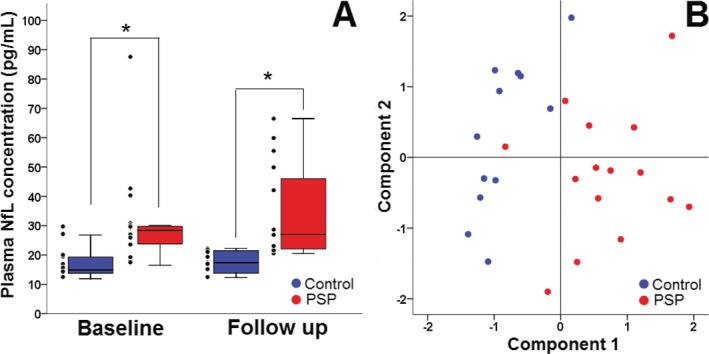
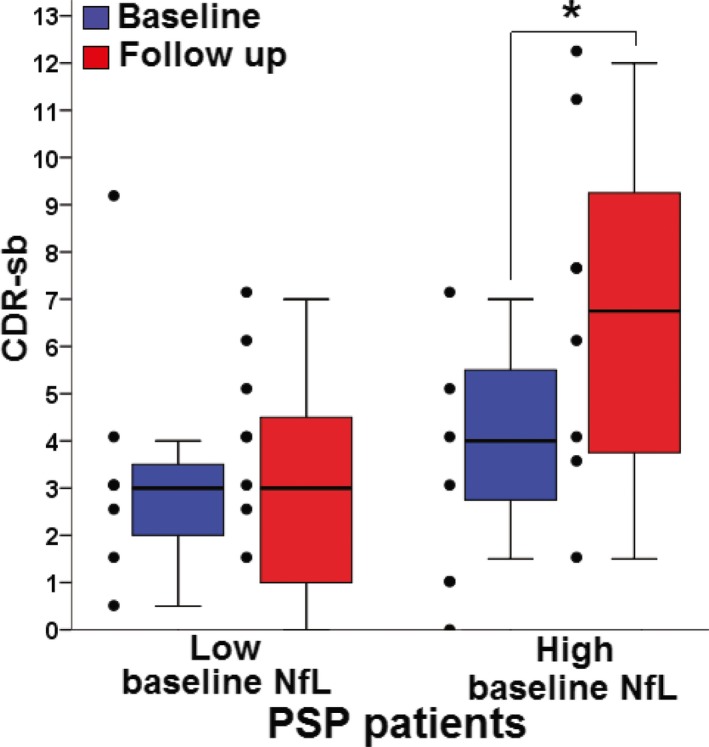
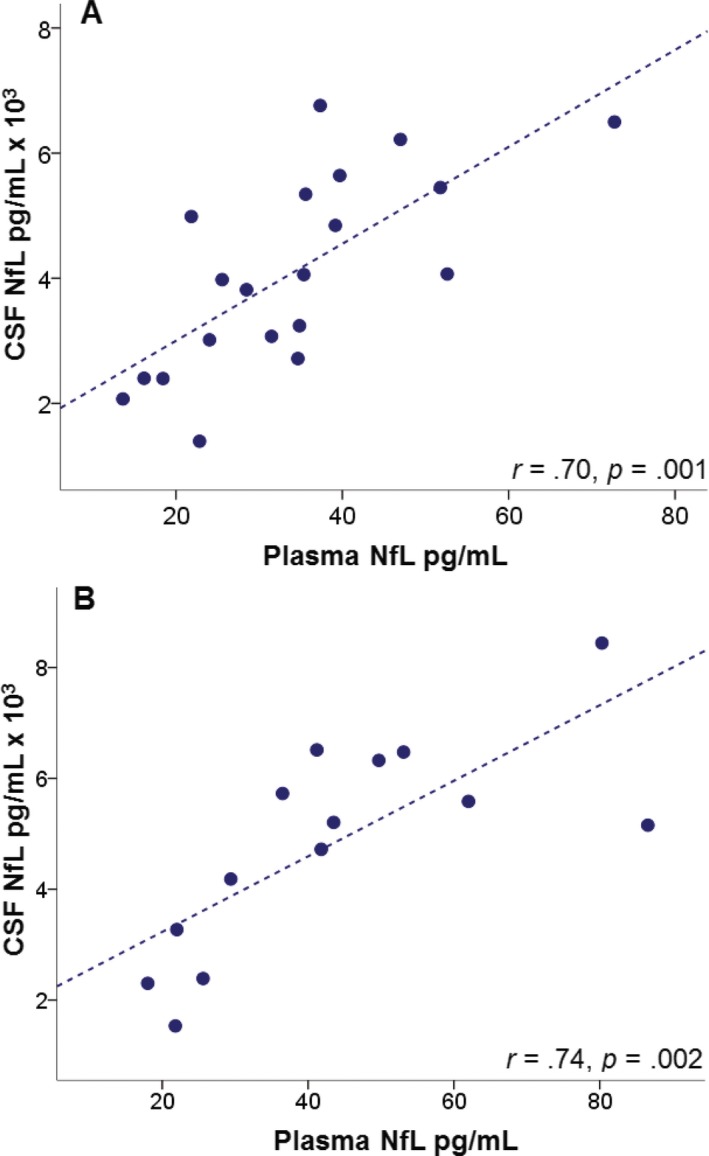
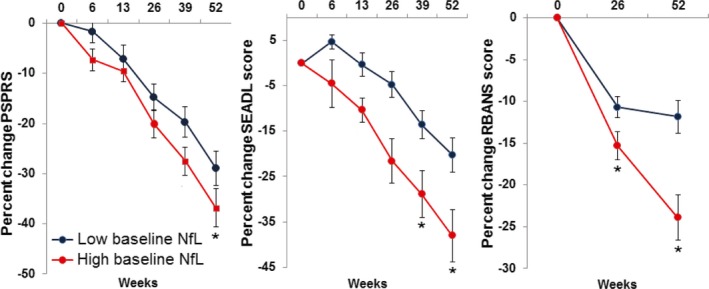
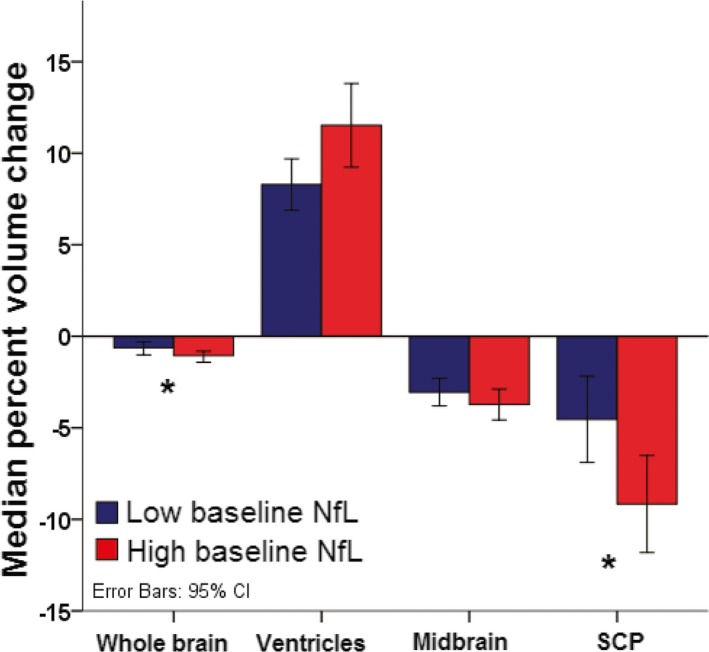
Results: Baseline mean plasma NfL levels were elevated in PSP patients (31 ± 4 pg/mL, vs. control, 17.5 ± 1 pg/mL, P < 0.05) and this difference persisted at follow-up. A cutoff value of 20 pg/mL related to the diagnosis of PSP with a sensitivity of 0.80 and specificity of 0.83 (positive likelihood ratio = 4.7 and a negative likelihood radio of 0.24). Patients with higher NfL levels had more severe neurological (PSPRS, -36.9% vs. -28.9%, P = 0.04), functional (SEADL, -38.2% vs. -20%, P = 0.03), and neuropsychological (RBANS, -23.9% vs. -12.3%, P = 001) deterioration over 1 year. Higher baseline NfL predicted greater whole-brain and superior cerebellar peduncle volume loss. Plasma and CSF NfL were significantly correlated (r = 0.74, P = 0.002).

Interpretation: Plasma NfL is elevated in PSP and could be of value as a biomarker both to assist clinical diagnosis and to monitor pharmacodynamic effects on the neurodegenerative process in clinical trials.


Figures

Figure 1
Figure 1
Plasma NfL is elevated in PSP patients, UCSF cohort. (A) Plasma NfL concentrations in control (blue) and PSP (red) patients at baseline and follow‐up. In both groups, NfL levels remained constant overtime, but they were comparatively elevated and showed wider variability in PSP patients. Thick horizontal bars represent the median. Upper and lower box limits represent the 75th and 25th percentiles. Error bars represents the minimum and maximum values. Individual data points, including extreme values, appear to the left of each box. (B) Principal component analysis showing classification of PSP patients (red circles) from healthy controls (blue circles) with high accuracy. Clustering was observed on “Component 1” axis which contained baseline NfL level as the major contributing factor. Major contributing variables on “Component 2” were age and education level. *Significant within‐group difference, < 0.05. NfL, neurofilament light chain; PSP, progressive supranuclear palsy.
Figure 2
Figure 2
Plasma NfL levels predict cognitive function at 1‐year follow‐up in PSP, UCSF cohort. CDR‐sb scores at baseline (blue) and follow‐up (red) in patients in the low and high median baseline plasma NfL. No change over time is seen in the low baseline group, whereas a significant CDR‐sb score worsening is observed in PSP patients in high baseline plasma NfL levels. Thick horizontal bars represent the median. Upper and lower box limits represent the 75th and 25th percentiles. Error bars represents the minimum and maximum values. Individual data points appear to the left of each box. *Significant within‐group difference, < 0.05. NfL, neurofilament light chain; PSP, progressive supranuclear palsy; CDR‐sb, clinical dementia rating sum of boxes.
Figure 3
Figure 3
Plasma NfL levels correlate with CSF NfL levels in PSP, Allon cohort. The graph shows plasma and their correlations with CSF NfL values at (A) baseline (n = 20) and (B) 1 year follow‐up (n = 14). NfL, neurofilament light chain; CSF, cerebrospinal fluid; PSP, progressive supranuclear palsy.
Figure 4
Figure 4
High baseline plasma NfL levels in PSP are associated with more severe neurologic, functional and cognitive decline at 1 year follow‐up, Allon cohort. Graphs represent percent change in clinical scale scores in PSP patients with low (blue) and high (red) median plasma NfL levels at baseline. *Fixed effects of baseline NfL level at the specified time point, < 0.05. NfL, neurofilament light chain; PSP, progressive supranuclear palsy; PSPRS, progressive supranuclear palsy rating scale score; SEADL, Schwab and England activities of daily living score; RBANS, repeatable battery for the assessment of neuropsychological disease severity score.
Figure 5
Figure 5
Baseline plasma NfL levels predict higher brain atrophy at 1 year follow‐up, Allon cohort. Median percent decrease in regional volume in PSP patients with low (blue, <36.7 pg/mL) and high (red, ≥36.7 pg/mL) baseline NfL concentrations. Error bars represent 95% confidence intervals. *< 0.05. NfL, neurofilament light chain; PSP, progressive supranuclear palsy; SCP, superior cerebellar peduncle.

References

    1. Steele JC, Richardson JC, Olszewski J. Progressive supranuclear palsy. A heterogeneous degeneration involving the brain stem, basal ganglia and cerebellum with vertical gaze and pseudobulbar palsy, nuchal dystonia and dementia. Arch Neurol 1964;10:333–359. - PubMed
    1. Kawashima M, Miyake M, Kusumi M, et al. Prevalence of progressive supranuclear palsy in Yonago, Japan. Mov Disord 2004;19:1239–1240. - PubMed
    1. Nath U, Ben‐Shlomo Y, Thomson RG, et al. The prevalence of progressive supranuclear palsy (Steele‐Richardson‐Olszewski syndrome) in the UK. Brain 2001;124:1438–1449. - PubMed
    1. Golbe LI. Progressive supranuclear palsy. Semin Neurol 2014;34:151–159. - PubMed
    1. Hall S, Ohrfelt A, Constantinescu R, et al. Accuracy of a panel of 5 cerebrospinal fluid biomarkers in the differential diagnosis of patients with dementia and/or parkinsonian disorders. Arch Neurol 2012;69:1445–1452. - PubMed