
Targeting mitochondrial biogenesis to overcome drug resistance to MAPK inhibitors

Gao Zhang et al. J Clin Invest. .

Abstract

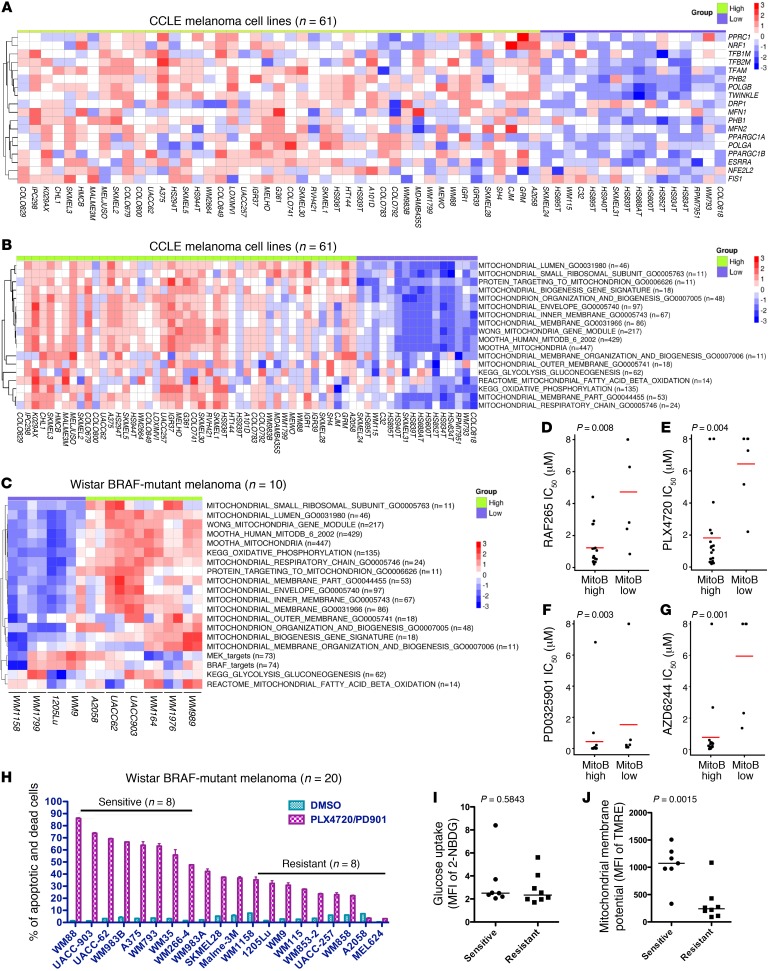
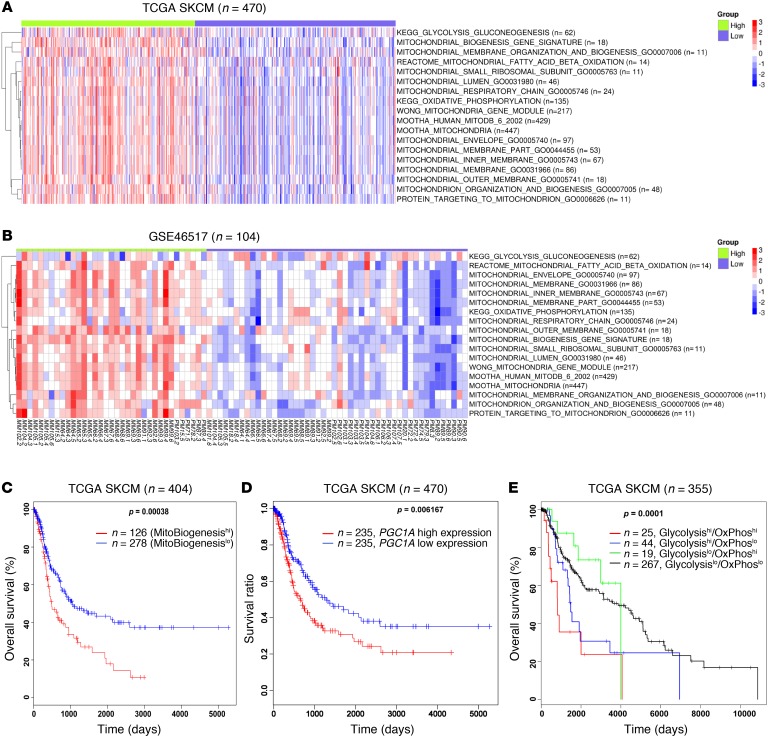
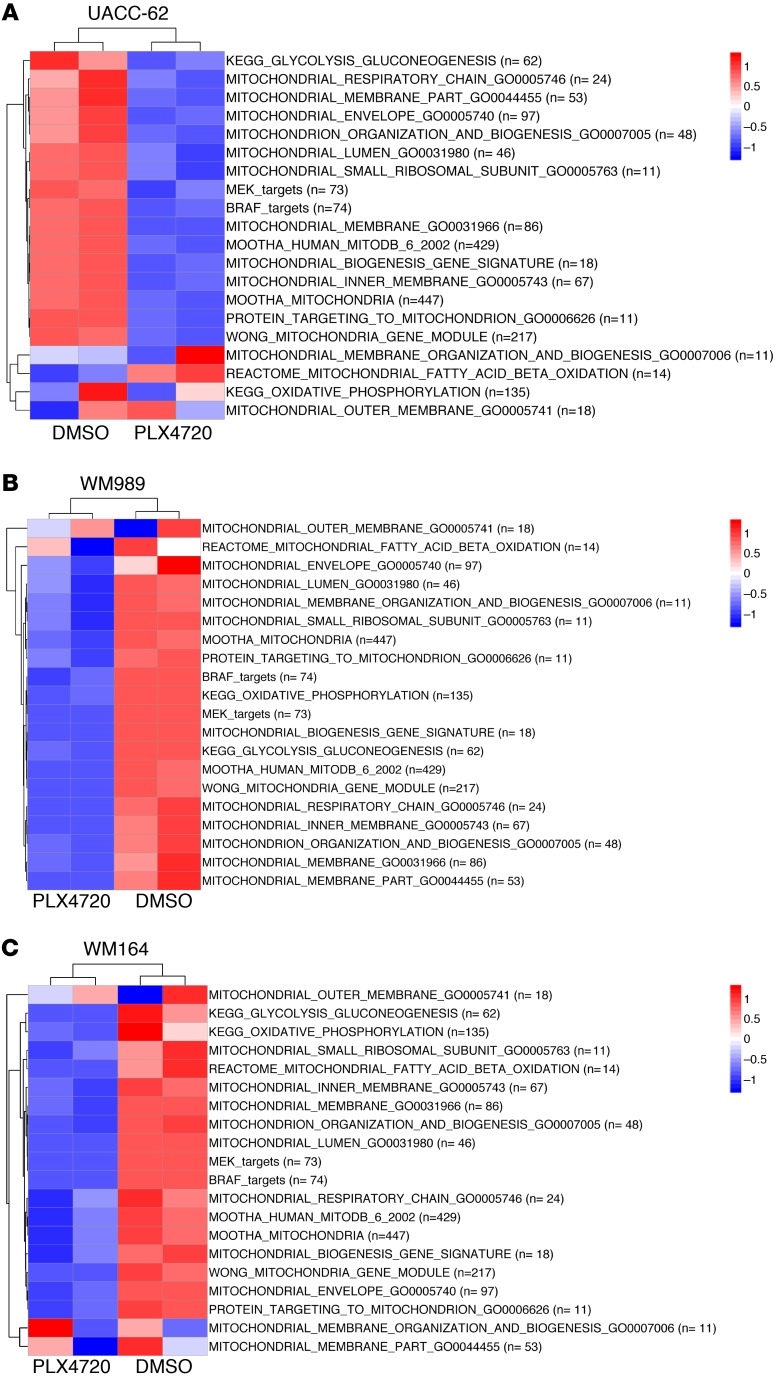
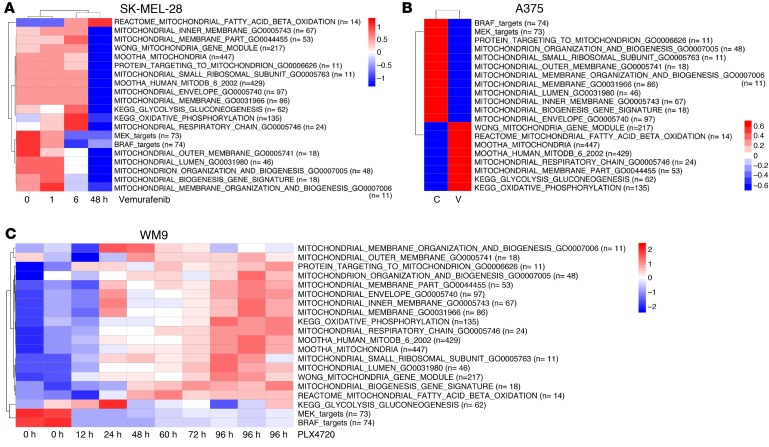
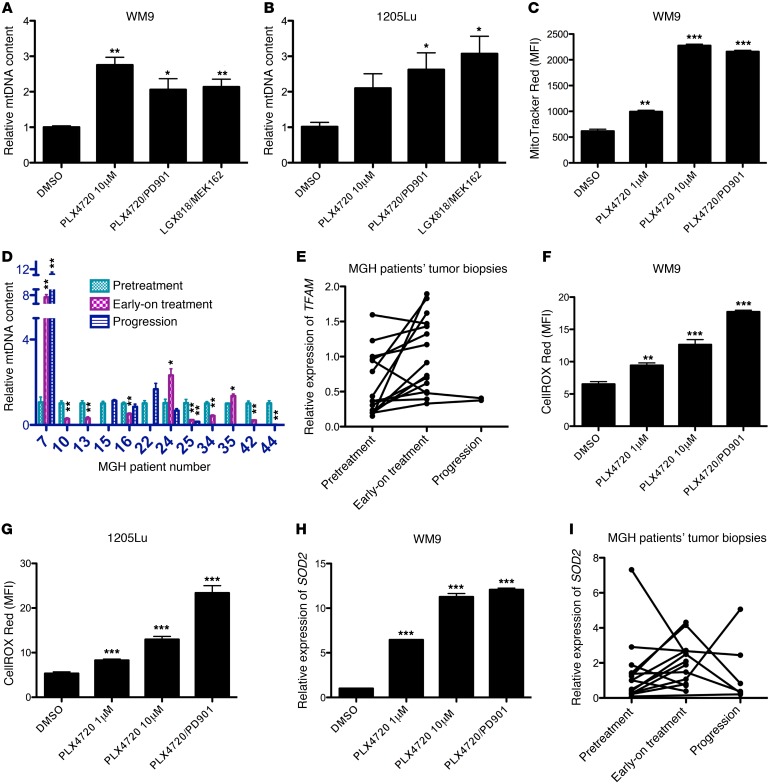
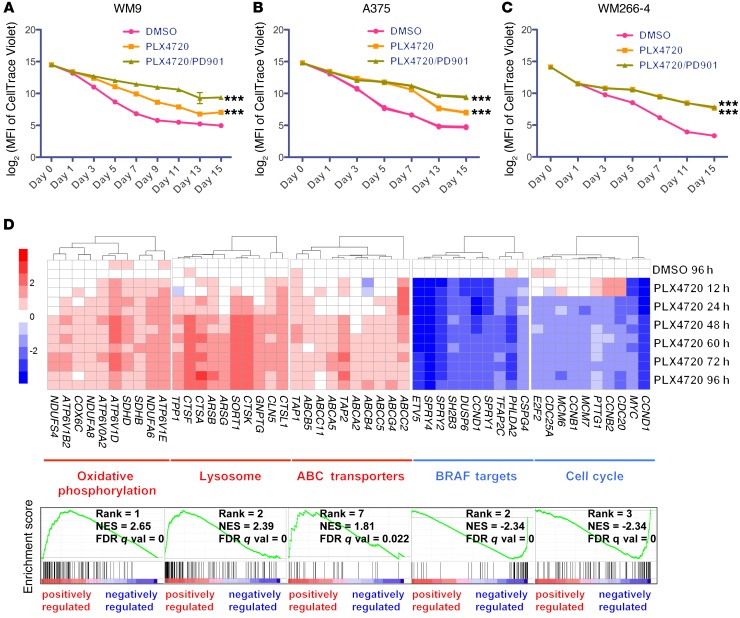
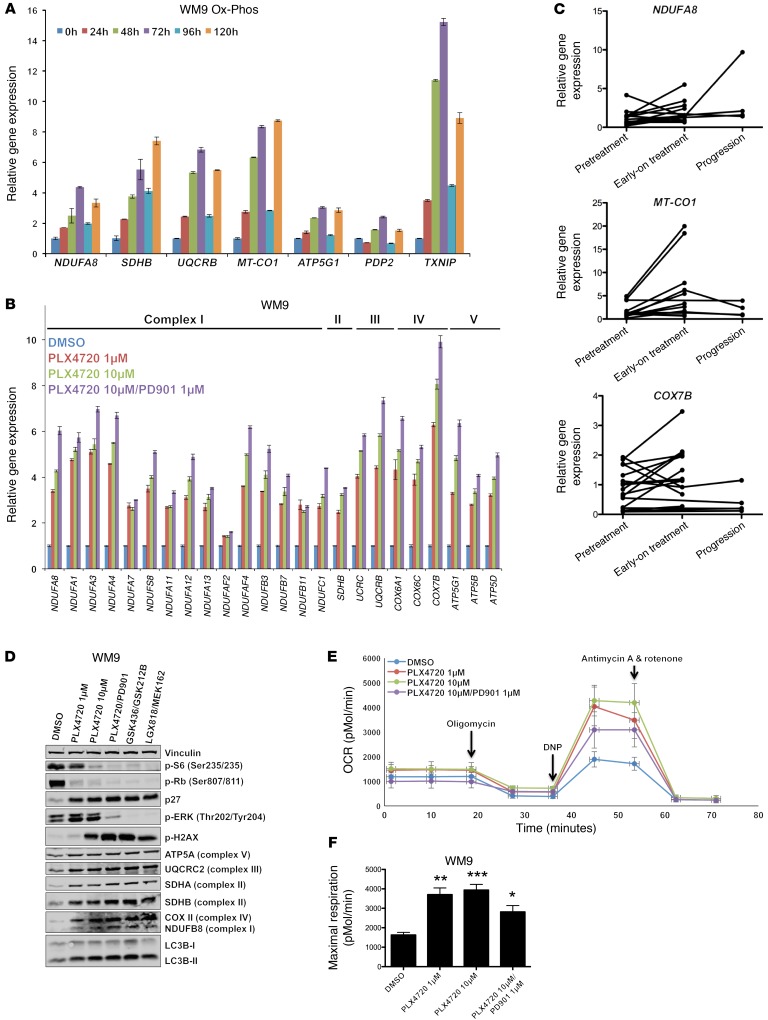
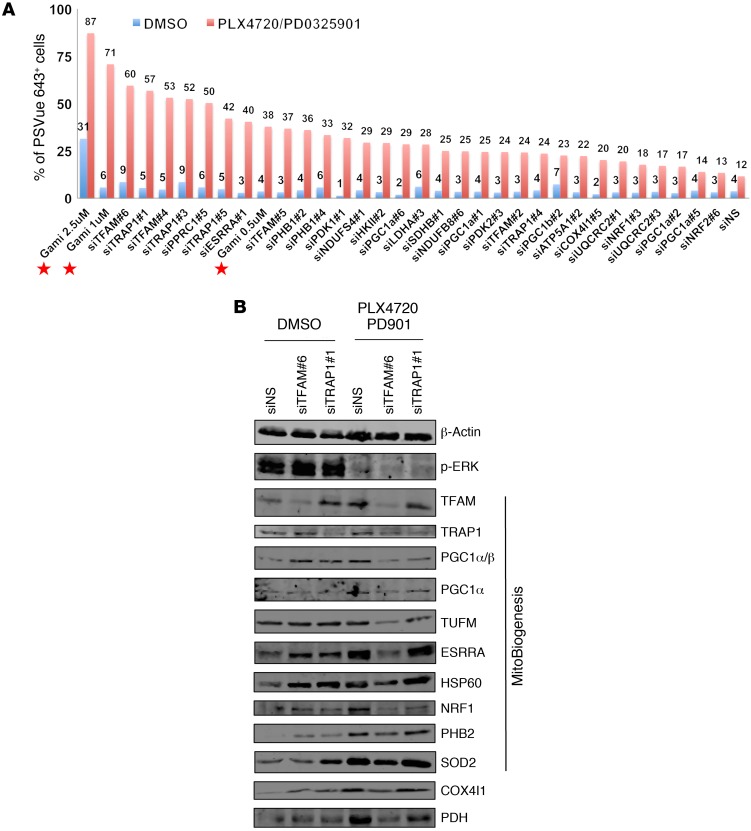
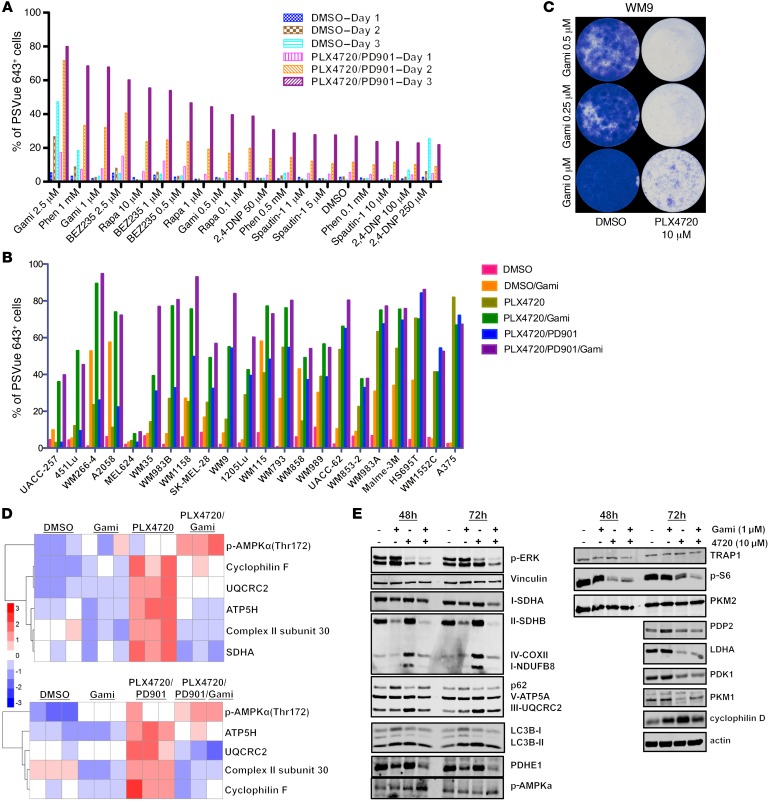
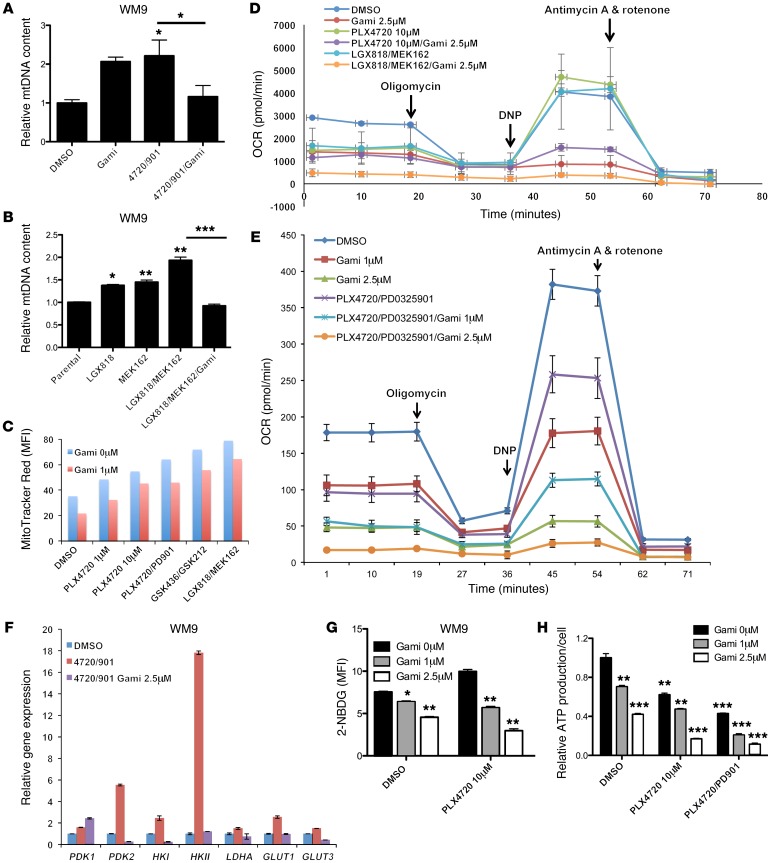
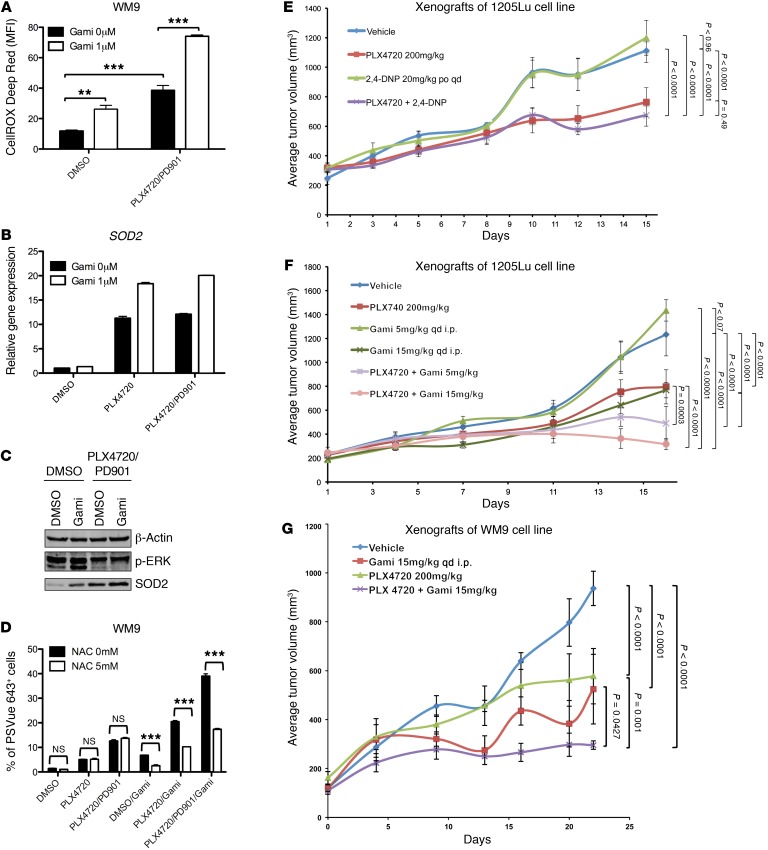
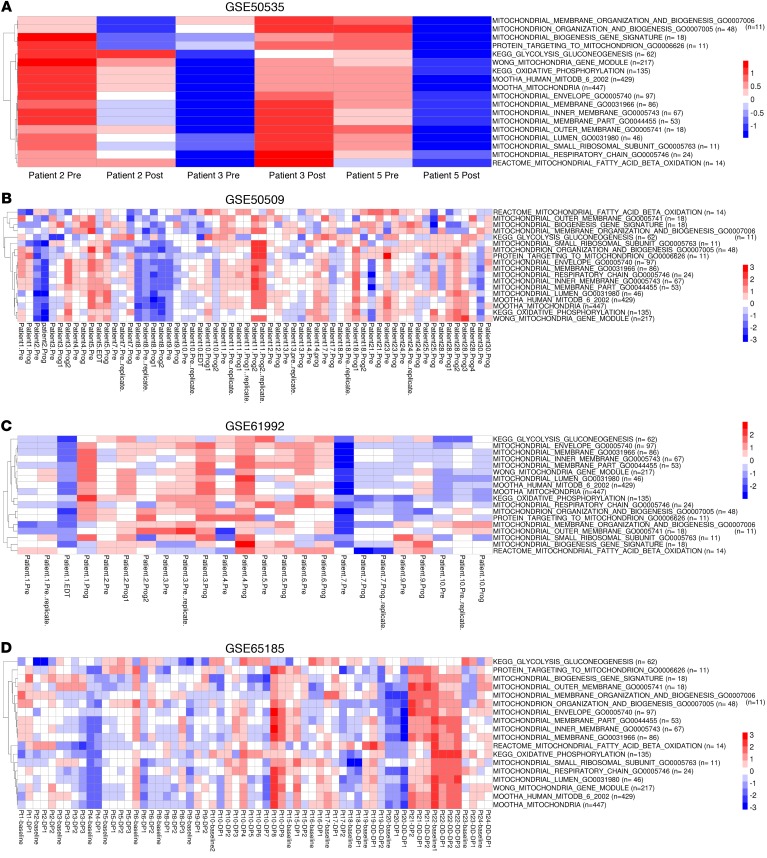
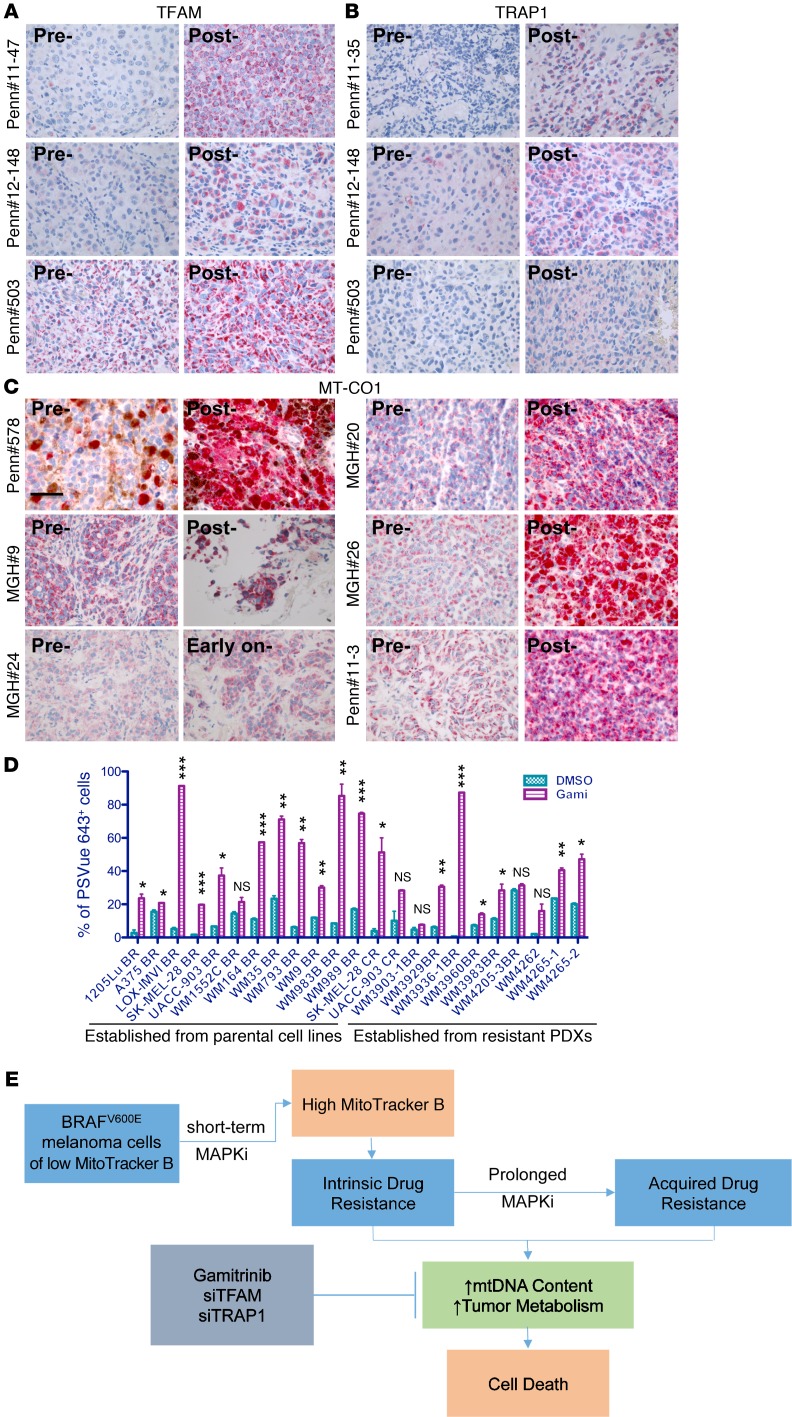
Targeting multiple components of the MAPK pathway can prolong the survival of patients with BRAFV600E melanoma. This approach is not curative, as some BRAF-mutated melanoma cells are intrinsically resistant to MAPK inhibitors (MAPKi). At the systemic level, our knowledge of how signaling pathways underlie drug resistance needs to be further expanded. Here, we have shown that intrinsically resistant BRAF-mutated melanoma cells with a low basal level of mitochondrial biogenesis depend on this process to survive MAPKi. Intrinsically resistant cells exploited an integrated stress response, exhibited an increase in mitochondrial DNA content, and required oxidative phosphorylation to meet their bioenergetic needs. We determined that intrinsically resistant cells rely on the genes encoding TFAM, which controls mitochondrial genome replication and transcription, and TRAP1, which regulates mitochondrial protein folding. Therefore, we targeted mitochondrial biogenesis with a mitochondrium-targeted, small-molecule HSP90 inhibitor (Gamitrinib), which eradicated intrinsically resistant cells and augmented the efficacy of MAPKi by inducing mitochondrial dysfunction and inhibiting tumor bioenergetics. A subset of tumor biopsies from patients with disease progression despite MAPKi treatment showed increased mitochondrial biogenesis and tumor bioenergetics. A subset of acquired drug-resistant melanoma cell lines was sensitive to Gamitrinib. Our study establishes mitochondrial biogenesis, coupled with aberrant tumor bioenergetics, as a potential therapy escape mechanism and paves the way for a rationale-based combinatorial strategy to improve the efficacy of MAPKi.


Figures

Figure 1
Figure 1. BRAF-mutated melanoma cells with lower mitochondrial biogenesis and mass at the basal level are resistant to MAPKi.
(A) Heatmap of microarray data for MitoBiogenesis in 61 CCLE melanoma cell lines. (B and C) Heatmaps of enrichment scores for 16 mitochondrial gene sets, 2 metabolic gene sets, and 2 MAPK pathway gene sets in 61 CCLE (B) and 10 Wistar Institute (C) melanoma cell lines. (DG) Drug IC50 of CCLE BRAF-mutated melanoma cell lines RAF265 (D), PLX4720 (E), PD0325901 (F), and AZD6244 (G). A 2-sample t test was used to determine the P values in DG. (H) Percentage of PSVue 643+ cells in each BRAF-mutated melanoma cell line treated with DMSO or MAPKi for 72 hours. (I and J) Mean fluorescence intensity (MFI) of 2-NBDG (I) and MitoTracker Red (J) in melanoma cell lines. Data were normalized to the MFI derived from the unstained sample of each cell line. (HJ) n = 3; data represent 2 independent experiments. A 2-tailed, unpaired t test was used to determine the P values in H and I. MitoB, MitoTracker B. Horizontal bars in panels DJ denote the mean of each group.
Figure 2
Figure 2. TCGA melanoma patients have a worse overall survival outcome if their tumors express high levels of MitoBiogenesis.
(A and B) Heatmaps of enrichment scores for 16 mitochondrial gene sets and 2 metabolic genes in 470 TCGA melanoma patients (A) and 104 melanoma patients (GSE46517) (B). (CE) Kaplan-Meier survival curves for TCGA melanoma patients who were divided into 2 subgroups of high and low expression of MitoTracker B (C), 2 subgroups of high and low expression of PGC1A (D), and 4 subgroups on the basis of their expression of 62 glycolytic and 135 OxPhos genes (E). P values in CE were determined by log-rank test.
Figure 3
Figure 3. MAPKi regulate the expression of MitoBiogenesis in BRAF-mutated melanoma cell lines at the RNA level.
Heatmaps of enrichment scores for 16 mitochondrial gene sets, 2 metabolic gene sets, and 2 MAPK pathway gene sets in UACC-62 (A), WM989 (B), and WM164 cells (C) treated with 10 μM DMSO or PLX4720 for 96 hours.
Figure 4
Figure 4. MAPKi regulate the expression of MitoBiogenesis in BRAF-mutated melanoma cell lines at the RNA level.
Heatmaps of enrichment scores for 16 mitochondrial gene sets, 2 metabolic gene sets, and 2 MAPK pathway gene sets in SK-MEL-28 cells (A) treated with vemurafenib for 48 hours, in A375 cells (B) treated with the control and vemurafenib for 48 hours, and in WM9 cells (C) treated with 10 μM PLX4720 for 96 hours. C, control; V, vemurafenib.
Figure 5
Figure 5. MAPKi regulate the expression of MitoBiogenesis in BRAF-mutated melanoma cell lines at the protein level.
(AF) Immunoblotting of proteins related to MitoBiogenesis and the MAPK pathway in SK-MEL-28 (A), A375 (B and C), and WM9 (DF) cells treated with DMSO or the indicated MAPKi for 72 hours.
Figure 6
Figure 6. MAPKi increase mtDNA copy numbers, mitochondrial mass, ROS, and expression of SOD2 in a subset of BRAF-mutated melanoma cell lines and patients’ tumor biopsies.
(A and B) Relative mtDNA copy numbers in WM9 (A) and 1205Lu (B) cells treated with DMSO or the indicated MAPKi for 72 hours. (C) MFI for MitoTracker Red in WM9 cells treated with DMSO or the indicated MAPKi for 72 hours. (D) Relative mtDNA copy numbers in patients’ tumor biopsies. Each patient’s pretreatment tumor biopsy was used as an internal control. (E) Relative gene expression of TFAM determined by qRT-PCR in patients’ tumor biopsies. (F and G) MFI of CellROX Deep Red in WM9 (F) and 1205Lu (G) cells treated with DMSO or the indicated MAPKi for 72 hours. (H and I) Relative gene expression of SOD2 determined by qRT-PCR in samples included in F and in patients’ tumor biopsies (I). (AC and FH) n = 3 biological replicates; data are representative of 2 independent experiments. (E and I) The pretreatment tumor biopsy from MGH patient 5 was used as a control for all other samples. n = 3 technical replicates; data represent the average. (C, F, and G) Data were normalized to the MFI derived from the unstained sample in each experimental condition. n = 3 (biological replicates); data are representative of 2 independent experiments. (D, E, and I) n = 3 technical replicates. (AD and FH) *P <0.05, **P <0.005, and ***P <0.0005, by 2-tailed, unpaired t test.
Figure 7
Figure 7. Surviving cells adopt a slow-growing phenotype and activate OxPhos, lysosomes, and ABC transporters in response to MAPKi.
(AC) Log2 transformation of the MFI of CellTrace Violet in WM9 (A), A375 (B), and WM266-4 (C) cells treated with DMSO or the indicated MAPKi for 15 days. n = 3 biological replicates; data are representative of 2 independent experiments. ***P <0.0005, by 2-way ANOVA. (D) WM9 cells were treated with 10 μM DMSO or PLX4720, and cells were harvested at 12, 24, 48, 60, 72, and 96 hours for a time-course gene expression microarray study. Upper panel: heatmaps of 10 significantly altered genes chosen from each of 5 gene sets. Lower panel: GSEA plots of the 5 top-ranked gene sets shown in the upper panel. WM9 cells treated with DMSO for 96 hours were included as a control. NES, normalized enrichment score.
Figure 8
Figure 8. Surviving cells and patients’ early-on treatment tumor biopsies highly express mitochondrial respiratory chain complex subunits and increase maximal respiration.
(AC) Relative gene expression of the indicated genes was determined by qRT-PCR in WM9 cells treated with 10 μM PLX4720 for 120 hours and harvested at the indicated time points (A); in WM9 cells treated for 72 hours with DMSO or the indicated MAPKi (B); and in patients’ tumor biopsies (C). n = 3 technical replicates; data are representative of 2 independent experiments. (C) The pretreatment tumor biopsy from MGH patient 2 was used as the baseline for all other samples. (D) Immunoblot analysis of proteins in WM9 cells treated with DMSO or the indicated MAPKi for 72 hours. (E) Mitochondrial respiration, indicated as the OCR of WM9 cells treated with the indicated MAPKi for 72 hours, was measured by a Seahorse XF24 Analyzer. Coupled and maximal respirations were determined by the sequential addition of oligomycin, DNP, and antimycin and rotenone, respectively. Data are representative of 4 biological replicates. (F) Maximal respiration measured in the samples in E. *P <0.05, **P <0.005, and ***P <0.0005, by 2-tailed, unpaired t test.
Figure 9
Figure 9. Knockdown of TFAM or TRAP1 improves the efficacy of MAPKi.
(A) Percentage of PSVue 643+ WM9 cells that were transfected with the indicated siRNA clone and treated with MAPKi for 72 hours. Cells transfected with siNS (nontargeting sequence) were included as a negative control. Gamitrinib, used at 0.5, 1, and 2.5 μM, is indicated by a red star in the graph. The average of 2 biological replicates was plotted, and data are representative of 2 independent experiments. Gami, Gamitrinib. (B) Immunoblot analysis of proteins in WM9 cells transfected with siTFAM or siTRAP1 and treated with DMSO or the indicated MAPKi for 72 hours.
Figure 10
Figure 10. Gamitrinib suppresses MitoBiogenesis and tumor bioenergetics.
(A) Percentage of PSVue 643+ WM9 cells treated with DMSO or the indicated MAPKi in combination with Gamitrinib (Gami), rapamycin (Rapa), Phenformin (Phen), BEZ235, 2,4-DNP, or Spautin-1 for 72 hours and harvested on days 1, 2, and 3 for FACS analysis. (B) Percentage of PSVue 643+ cells in 22 BRAF-mutated melanoma cell lines treated with a combination of the indicated MAPKi and Gamitrinib for 72 hours (PLX4720, 10 μM; PD901, 1 μM; Gamitrinib, 2.5 M). (A and B) Cells treated with DMSO were used as a control. The average of 2 biological replicates was plotted, and data are representative of 2 independent experiments. (C) Long-term cell growth assay of WM9 cells treated with 10 μM DMSO or PLX4720 in combination with Gamitrinib for 15 days. Cells were fixed and stained with crystal violet on day 15. Data are representative of 2 independent experiments. (D) Two heatmaps of RPPA data on WM9 cells treated with DMSO or the indicated MAPKi in combination with 1 μM Gamitrinib for 72 hours. Upper panel: PLX4720, 10 μM; lower panel: PLX4720, 10 μM and PD0325901, 1 μM. n = 3 biological replicates. (E) Immunoblot analysis of proteins in WM9 cells treated with 10 μM DMSO or PLX4720, with or without 1 μM Gamitrinib, for 72 hours.
Figure 11
Figure 11. Gamitrinib leads to decreased mtDNA copy numbers, mass, and respiration and inhibits glycolysis and ATP production.
(A and B) Relative mtDNA copy numbers in WM9 cells treated with DMSO or the indicated MAPKi, with or without 1 μM Gamitrinib, for 72 hours. (C) MFI of MitoTracker Red for WM9 cells treated for 72 hours with DMSO or the indicated MAPKi, with or without 1 or 2.5 μM Gamitrinib. n = 2 biological replicates, and the average was plotted. Data are representative of 2 independent experiments. (D and E) Real-time oxygen consumption of WM9 cells subjected to a metabolic stress test with a Seahorse XF 24 Analyzer. Cells were treated for 72 hours with DMSO or the indicated MAPK inhibitor, with or without 1 or 2.5 μM Gamitrinib. n = 4 biological replicates. (F) Relative gene expression was assessed by qRT-PCR in WM9 cells treated for 48 hours with DMSO or the indicated MAPKi, with or without 2.5 μM Gamitrinib. (G and H) MFI of 2-NBDG (G) and relative ATP production (H) in WM9 cells treated for 72 hours with DMSO or the indicated MAPKi, with or without 1 or 2.5 μM Gamitrinib. (A, B, and F) n = 3 technical replicates, and data are representative of 2 independent experiments. (G and H) n = 3 biological replicates, which were included in each sample, and the data are representative of 2 independent experiments. *P <0.05, **P <0.005, and ***P <0.0005, by 2-tailed, unpaired t test.
Figure 12
Figure 12. The combination of Gamitrinib and MAPKi results in mitochondrial dysfunction and delays tumor growth in vivo.
(A) MFI of CellROX Deep Red in WM9 cells treated with DMSO or the indicated MAPKi, with or without 1 μM Gamitrinib, for 72 hours. (B) Relative gene expression of SOD2 was assessed by qRT-PCR in WM9 cells treated with DMSO or the indicated MAPKi, with or without 1 μM Gamitrinib, for 72 hours. n = 3 technical replicates, and data are representative of 2 independent experiments. (C) Immunoblot analysis of p-ERK and SOD2 in WM9 cells treated with DMSO or the indicated MAPKi, with or without 1 μM Gamitrinib, for 72 hours. (D) Percentage of PSVue 643+ WM9 cells treated with DMSO, the indicated MAPKi, 1 μM Gamitrinib, and 5 mM NAC, used either alone or in combination, for 72 hours. (EG) Tumor volume of 1205Lu xenografts treated for 15 days with the vehicle control or PLX4720, either alone or in combination with 2,4-DNP (E), 1205Lu xenografts treated for 17 days with the vehicle control or PLX4720, either alone or in combination with Gamitrinib (F), and WM9 xenografts treated for 22 days with the vehicle control or PLX4720, either alone or in combination with Gamitrinib (G). (E and F) n = 10 mice per group; (G) n = 5 mice per group. (A and D) n = 3 biological replicates, which were included in each sample. Data are representative of 2 independent experiments. **P <0.005 and ***P <0.0005, by 2-tailed, unpaired t test (A and D). A 2-tailed, unpaired t test was also used to determine the P values in EG.
Figure 13
Figure 13. Clinical relevance of mitochondrial biogenesis and tumor bioenergetics in the context of acquired drug resistance.
(AD) Heatmaps of enrichment scores for 16 mitochondrial gene sets and 2 metabolic gene sets in patients’ paired pre- and post-treatment tumor biopsies that are included in GSE50535 (A), GSE50509 (B), GSE61992 (C), and GSE65185 (D). Pre, before treatment; Post, after treatment; Prog, progression.
Figure 14
Figure 14. Increases of mitochondrial biogenesis proteins exhibited in patients’ progressive tumor biopsies and targeting acquired drug resistant cells with Gamitrinib.
(AC) Immunohistochemical staining of TFAM (A), TRAP1 (B), and MT-CO1 (C) in patients’ paired pre-, early-on, and post-treatment tumor biopsies. Scale bars represent 40 μm. (D) Percentage of PSVue 643+ cells in 23 BRAF-mutated resistant melanoma cell lines that were treated with 2.5 μM Gamitrinib for 72 hours. n =2 biological replicates, which were included for each sample. Data are representative of 2 independent experiments. *P <0.05, **P <0.005, and ***P <0.0005, by 2-tailed, unpaired t test was used. PDXs, patient-derived xenografts.(E) Schematic model showing cotargeting the MAPK pathway and mitochondrial biogenesis in BRAF-mutated melanoma cells as a viable therapeutic strategy.

Comment in

Similar articles

Cited by

References

    1. Bhatia S, Tykodi SS, Thompson JA. Treatment of metastatic melanoma: an overview. Oncology (Williston Park) 2009;23(6):488–496. - PMC - PubMed
    1. Davies H, et al. Mutations of the BRAF gene in human cancer. Nature. 2002;417(6892):949–954. doi: 10.1038/nature00766. - DOI - PubMed
    1. McArthur GA, et al. Safety and efficacy of vemurafenib in BRAF(V600E) and BRAF(V600K) mutation-positive melanoma (BRIM-3): extended follow-up of a phase 3, randomised, open-label study. Lancet Oncol. 2014;15(3):323–332. doi: 10.1016/S1470-2045(14)70012-9. - DOI - PMC - PubMed
    1. Flaherty KT, et al. Inhibition of mutated, activated BRAF in metastatic melanoma. N Engl J Med. 2010;363(9):809–819. doi: 10.1056/NEJMoa1002011. - DOI - PMC - PubMed
    1. Bollag G, et al. Clinical efficacy of a RAF inhibitor needs broad target blockade in BRAF-mutant melanoma. Nature. 2010;467(7315):596–599. doi: 10.1038/nature09454. - DOI - PMC - PubMed

Publication types

MeSH terms